| Param | Original file | Final file |
|---|---|---|
| Filename | modeM0/AS1A07_138T05_9000003410_23110cztM0_level2.evt | modeM0/AS1A07_138T05_9000003410_23110cztM0_level2_quad_clean.evt |
| Size (bytes) | 387,938,880 | 49,979,520 |
| Size | 370.0 MB | 47.7 MB |
| Events in quadrant A | 3,283,209 | 295,991 |
| Events in quadrant B | 2,175,276 | 306,626 |
| Events in quadrant C | 2,159,140 | 294,280 |
| Events in quadrant D | 3,812,991 | 287,825 |
| Mode SS | |||
|---|---|---|---|
| Quadrant | BADHDUFLAG | Total packets | Discarded packets |
| A | 0 | 94 | 0 |
| B | 0 | 94 | 0 |
| C | 0 | 94 | 0 |
| D | 0 | 94 | 0 |
| Mode M0 | |||
|---|---|---|---|
| Quadrant | BADHDUFLAG | Total packets | Discarded packets |
| A | 0 | 12833 | 0 |
| B | 0 | 9441 | 0 |
| C | 0 | 9415 | 0 |
| D | 0 | 14508 | 0 |
| Quadrant | Total seconds | Saturated seconds | Saturation percentage |
|---|---|---|---|
| A | 4671 | 343 | 7.343181% |
| B | 4672 | 7 | 0.149829% |
| C | 4672 | 18 | 0.385274% |
| D | 4672 | 308 | 6.592466% |
Noise dominated data is calculated using 1-second bins in cleaned event files. If a bin has >2000 counts, and if more than 50% of those come from <1% of pixels, then it is considered to be noise-dominated and hence unusable.
| Quadrant | # 1 sec bins | Bins with >0 counts | Bins with >2000 counts | High rate bins dominated by noise | Noise dominated (total time) | Noise dominated (detector-on time) | Marked lightcurve |
|---|---|---|---|---|---|---|---|
| A | 4671 | 4671 | 274 | 274 | 5.87% | 5.87% | 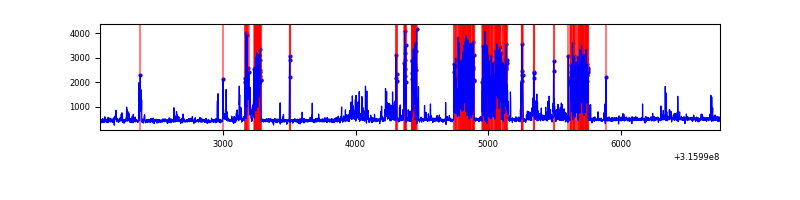 |
| B | 4672 | 4672 | 0 | 0 | 0.00% | 0.00% | 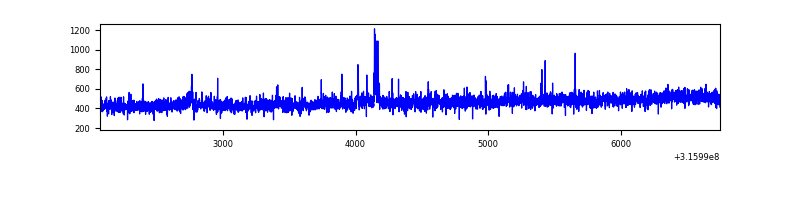 |
| C | 4672 | 4672 | 0 | 0 | 0.00% | 0.00% | 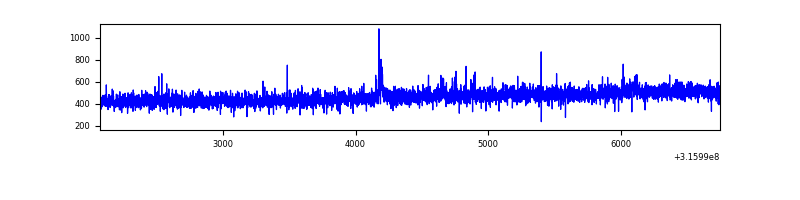 |
| D | 4672 | 4672 | 270 | 270 | 5.78% | 5.78% | 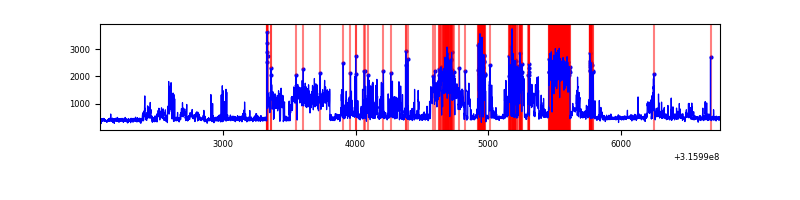 |
Top three noisy pixels from each quadrant. If the there are fewer than three noisy pixels in the level2.evt file, extra rows are filled as -1
| Pixel properties | Quadrant properties | ||||||
|---|---|---|---|---|---|---|---|
| Quadrant | DetID | PixID | Counts | Sigma | Mean | Median | Sigma |
| A | 6 | 16 | 1229086 | 11262.9 | 532 | 520 | 109.1 |
| A | 13 | 254 | 6682 | 56.49 | 532 | 520 | 109.1 |
| A | 3 | 137 | 4750 | 38.78 | 532 | 520 | 109.1 |
| B | 0 | 190 | 24046 | 220.79 | 545 | 531 | 106.5 |
| B | 12 | 111 | 12693 | 114.2 | 545 | 531 | 106.5 |
| B | 11 | 111 | 11555 | 103.51 | 545 | 531 | 106.5 |
| C | 14 | 238 | 82349 | 651.58 | 527 | 529 | 125.6 |
| C | 0 | 207 | 13855 | 106.12 | 527 | 529 | 125.6 |
| C | 0 | 10 | 7817 | 58.04 | 527 | 529 | 125.6 |
| D | 7 | 238 | 877648 | 6823.08 | 525 | 512 | 128.6 |
| D | 13 | 153 | 522648 | 4061.6 | 525 | 512 | 128.6 |
| D | 1 | 52 | 335393 | 2604.98 | 525 | 512 | 128.6 |
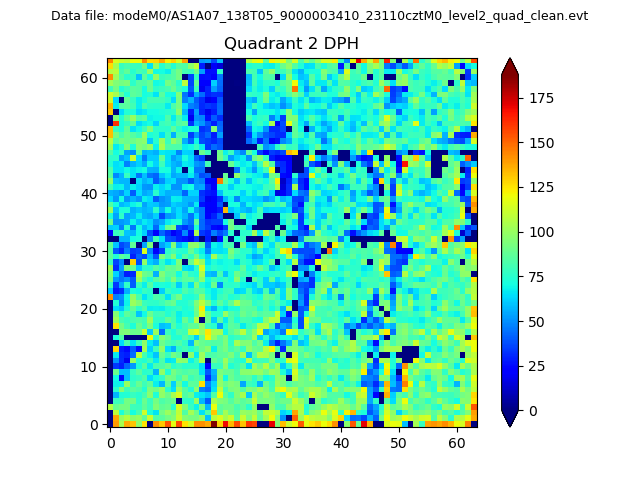
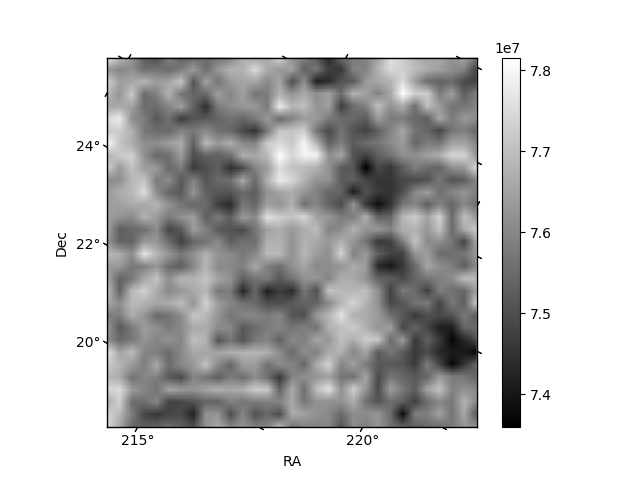
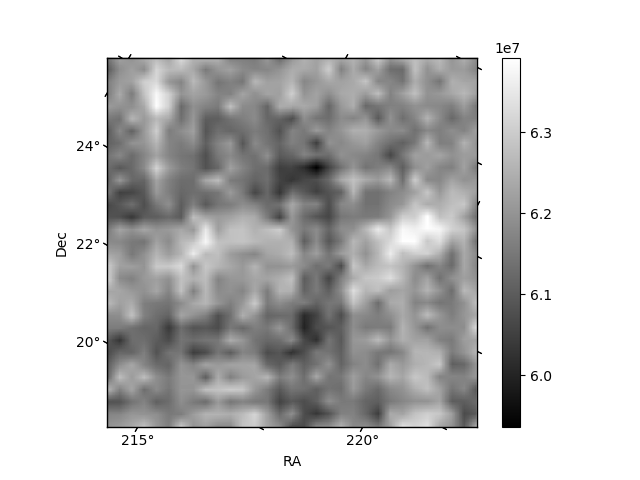
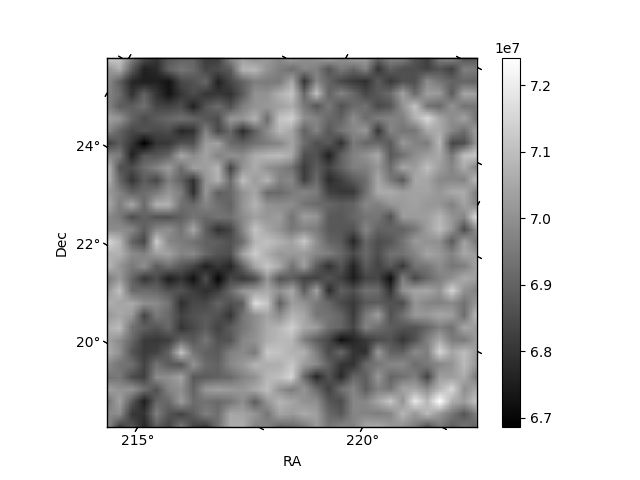
Histogram calculated using DETX and DETY for each event in the final _common_clean file
| Quadrant A | 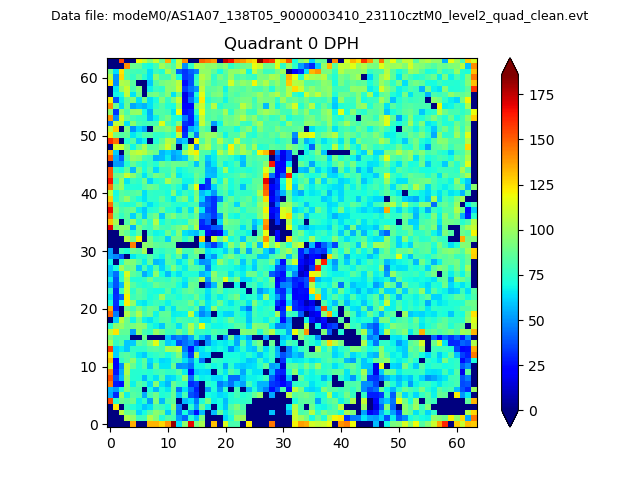 |
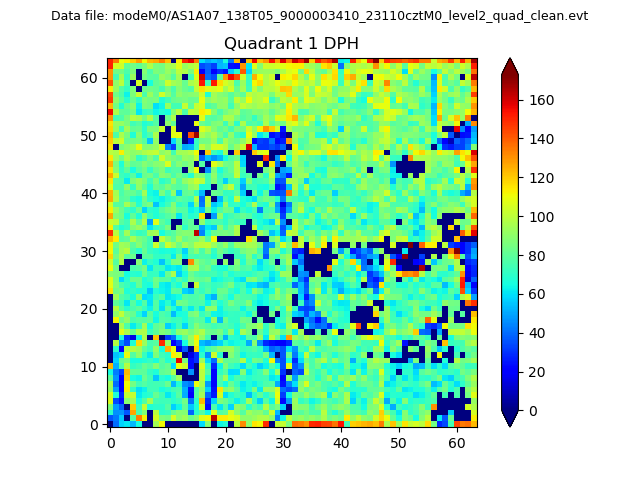 |
Quadrant B |
|---|---|---|---|
| Quadrant D | 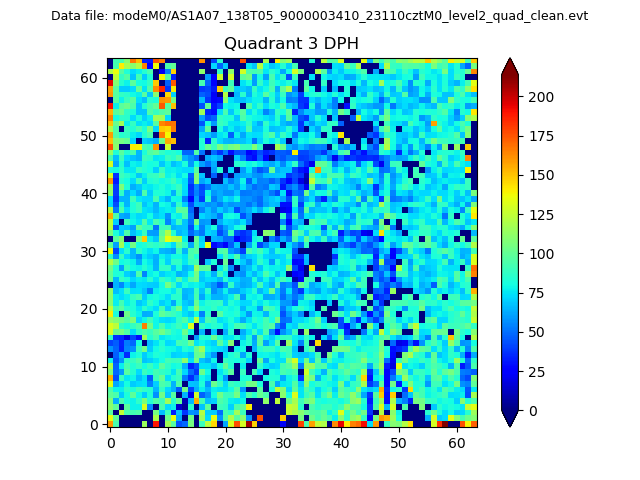 |
 |
Quadrant C |
| Plot type | Count rate plots | Images |
|---|---|---|
| Comparison with Poisson distribution Blue bars denote a histogram of data divided into 1 sec bins. Red curve is a Poisson curve with rate = median count rate of data. |
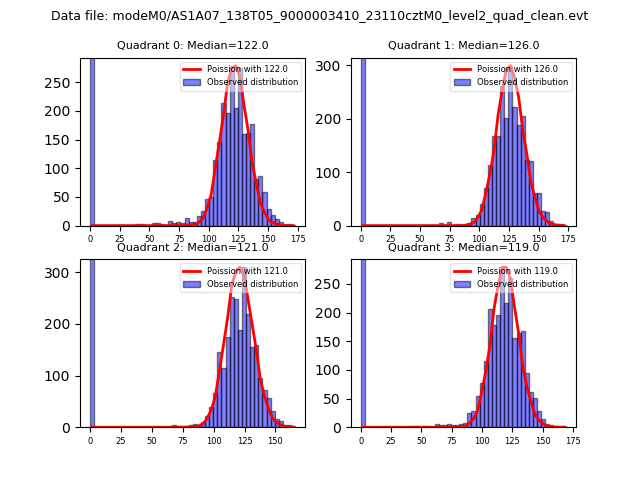 |
 |
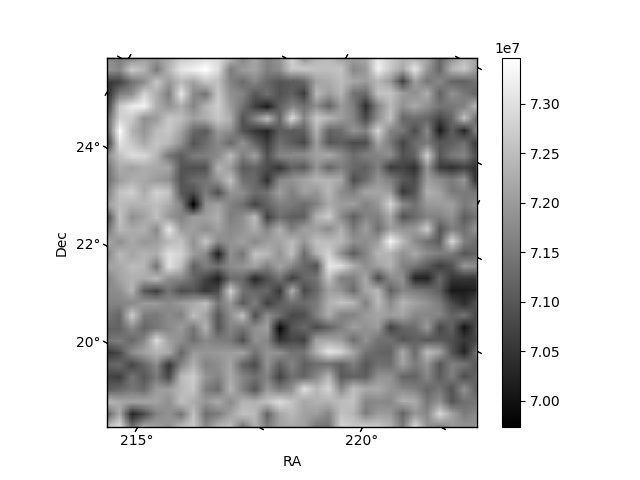
| Quadrant-wise count rates Data is divided into 100 sec bins |
 |
|
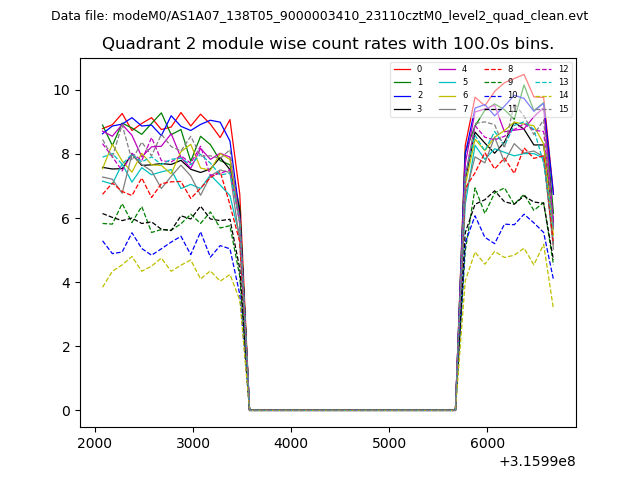
| Module-wise count rates for Quadrant A Data is divided into 100 sec bins |
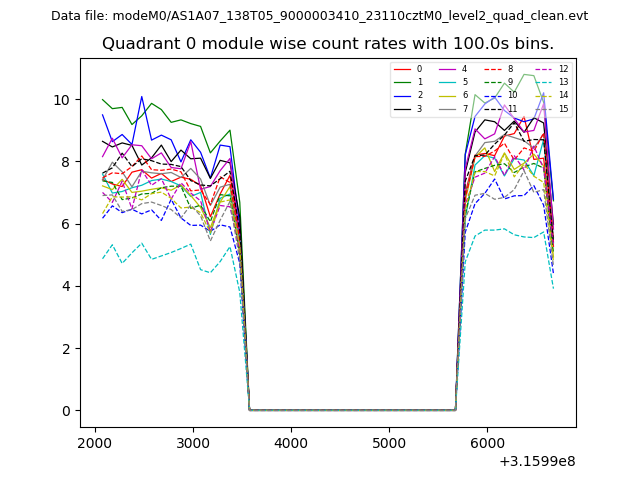 |
 |
| Module-wise count rates for Quadrant B Data is divided into 100 sec bins |
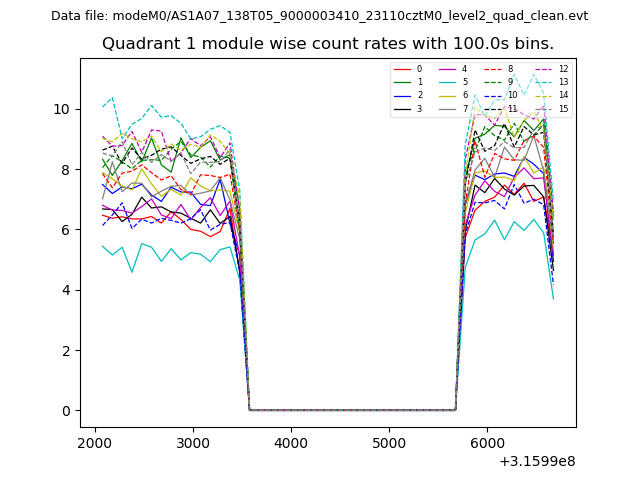 |
 |
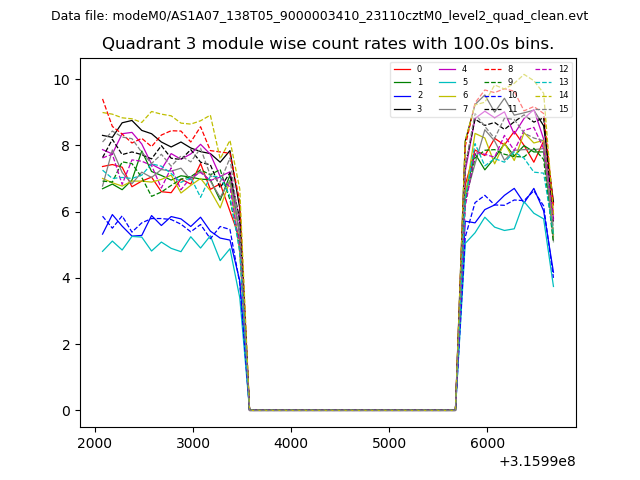
| Module-wise count rates for Quadrant C Data is divided into 100 sec bins |
 |
 |
| Module-wise count rates for Quadrant D Data is divided into 100 sec bins |
 |
 |
| Parameter | Plot |
|---|---|
| CZT HV Monitor | 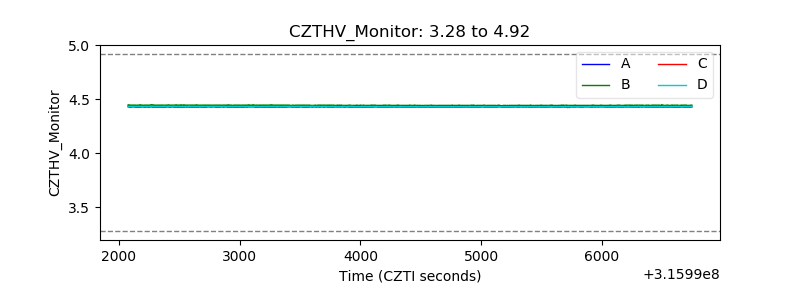 |
| D_VDD | 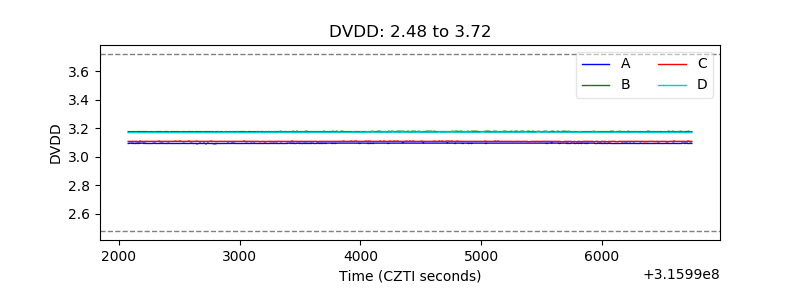 |
| Temperature 1 | 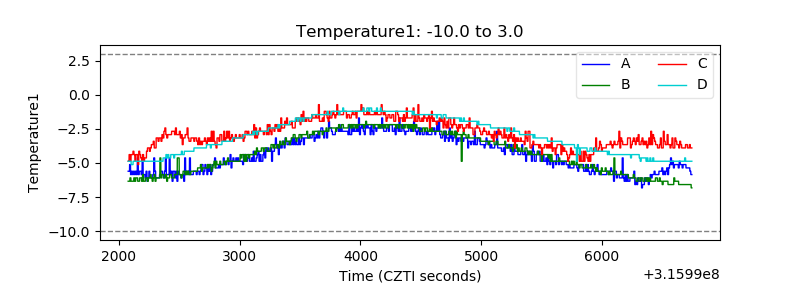 |
| Veto HV Monitor |  |
| Veto LLD |  |
| Alpha Counter | 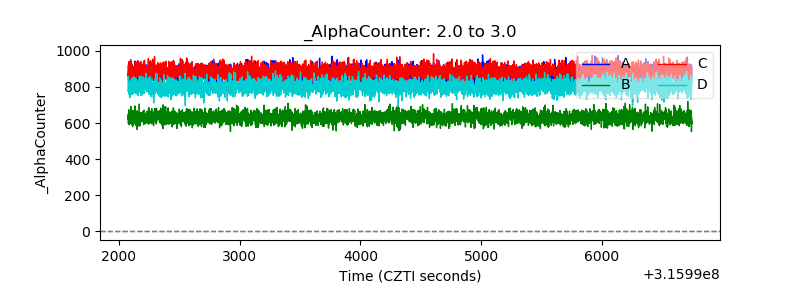 |
| _CPM_Rate | 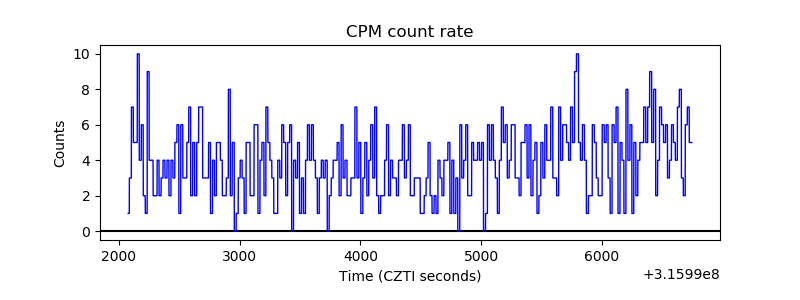 |
| CZT Counter | 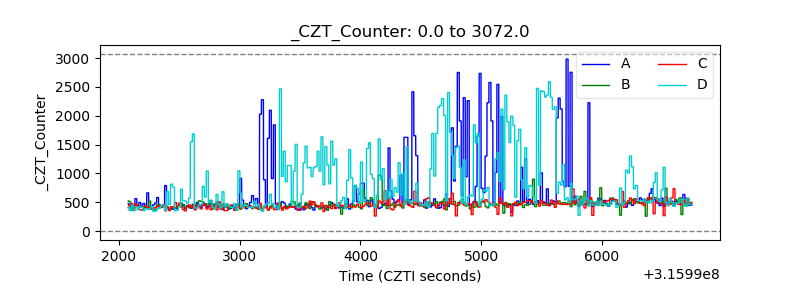 |
| +2.5 Volts monitor |  |
| +5 Volts monitor |  |
| _ROLL_ROT | 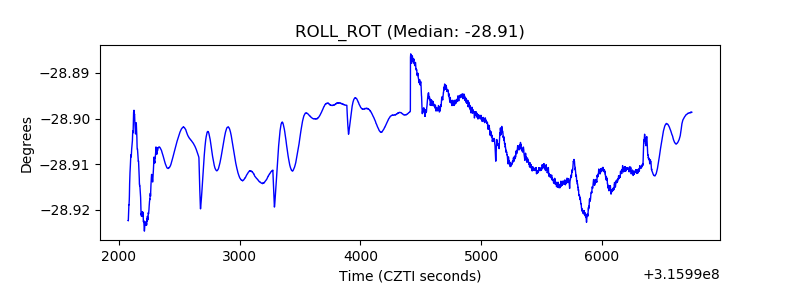 |
| _Roll_DEC | 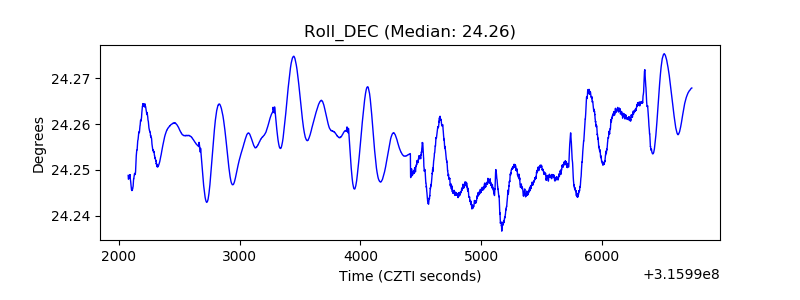 |
| _Roll_RA |  |
| Veto Counter | 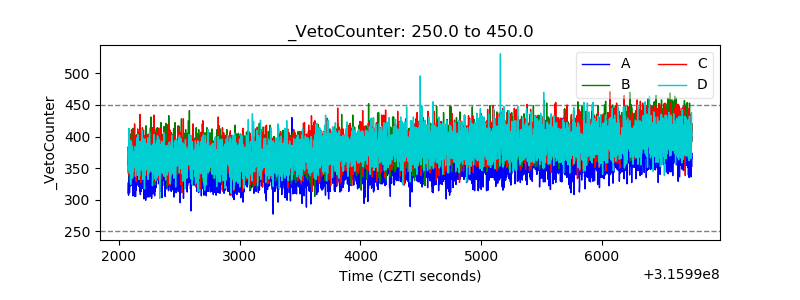 |