| Param | Original file | Final file |
|---|---|---|
| Filename | modeM0/AS1A07_138T03_9000003412cztM0_level2.fits | modeM0/AS1A07_138T03_9000003412cztM0_level2_quad_clean.evt |
| Size (bytes) | 130,893,120 | 122,976,000 |
| Size | 124.8 MB | 117.3 MB |
| Events in quadrant A | 750,918 | 663,083 |
| Events in quadrant B | 770,884 | 734,985 |
| Events in quadrant C | 784,604 | 699,734 |
| Events in quadrant D | 671,632 | 640,460 |
| Mode SS | |||
|---|---|---|---|
| Quadrant | BADHDUFLAG | Total packets | Discarded packets |
| A | 0 | 292 | 0 |
| B | 0 | 292 | 0 |
| C | 0 | 292 | 0 |
| D | 0 | 292 | 0 |
| Mode M9 | |||
|---|---|---|---|
| Quadrant | BADHDUFLAG | Total packets | Discarded packets |
| A | 0 | 18 | 0 |
| B | 0 | 18 | 0 |
| C | 0 | 18 | 0 |
| D | 0 | 18 | 0 |
| Mode M0 | |||
|---|---|---|---|
| Quadrant | BADHDUFLAG | Total packets | Discarded packets |
| A | 0 | 42108 | 0 |
| B | 0 | 29459 | 0 |
| C | 0 | 29280 | 0 |
| D | 0 | 35837 | 0 |
| Quadrant | Total seconds | Saturated seconds | Saturation percentage |
|---|---|---|---|
| A | 14269 | 1624 | 11.381316% |
| B | 14269 | 125 | 0.876025% |
| C | 14269 | 151 | 1.058238% |
| D | 14269 | 543 | 3.805452% |
Noise dominated data is calculated using 1-second bins in cleaned event files. If a bin has >2000 counts, and if more than 50% of those come from <1% of pixels, then it is considered to be noise-dominated and hence unusable.
| Quadrant | # 1 sec bins | Bins with >0 counts | Bins with >2000 counts | High rate bins dominated by noise | Noise dominated (total time) | Noise dominated (detector-on time) | Marked lightcurve |
|---|---|---|---|---|---|---|---|
| A | 15733 | 14262 | 0 | 0 | 0.00% | 0.00% | 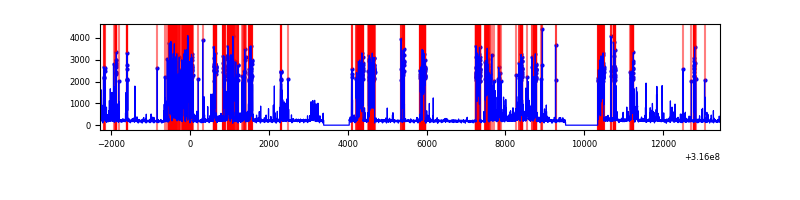 |
| B | 15733 | 14267 | 0 | 0 | 0.00% | 0.00% |  |
| C | 15733 | 14267 | 0 | 0 | 0.00% | 0.00% | 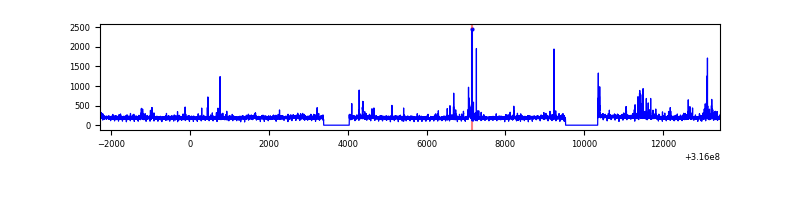 |
| D | 15733 | 14244 | 0 | 0 | 0.00% | 0.00% | 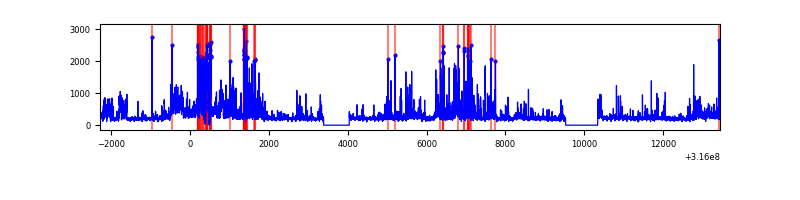 |
Top three noisy pixels from each quadrant. If the there are fewer than three noisy pixels in the level2.evt file, extra rows are filled as -1
| Pixel properties | Quadrant properties | ||||||
|---|---|---|---|---|---|---|---|
| Quadrant | DetID | PixID | Counts | Sigma | Mean | Median | Sigma |
| A | 0 | 29 | 695 | 10.03 | 195 | 184 | 50.9 |
| A | 7 | 110 | 610 | 8.36 | 195 | 184 | 50.9 |
| A | 0 | 30 | 521 | 6.62 | 195 | 184 | 50.9 |
| B | 2 | 9 | 622 | 10.22 | 203 | 194 | 41.9 |
| B | 3 | 17 | 558 | 8.69 | 203 | 194 | 41.9 |
| B | 2 | 8 | 538 | 8.21 | 203 | 194 | 41.9 |
| C | 1 | 80 | 596 | 7.42 | 207 | 193 | 54.3 |
| C | 12 | 241 | 573 | 7.0 | 207 | 193 | 54.3 |
| C | 1 | 81 | 573 | 7.0 | 207 | 193 | 54.3 |
| D | 6 | 231 | 508 | 6.29 | 192 | 175 | 53.0 |
| D | 15 | 46 | 487 | 5.89 | 192 | 175 | 53.0 |
| D | 3 | 14 | 486 | 5.87 | 192 | 175 | 53.0 |
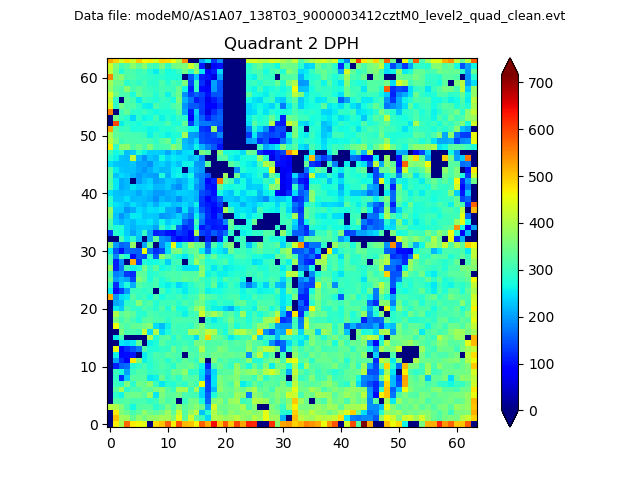
Histogram calculated using DETX and DETY for each event in the final _common_clean file
| Quadrant A |  |
 |
Quadrant B |
|---|---|---|---|
| Quadrant D | 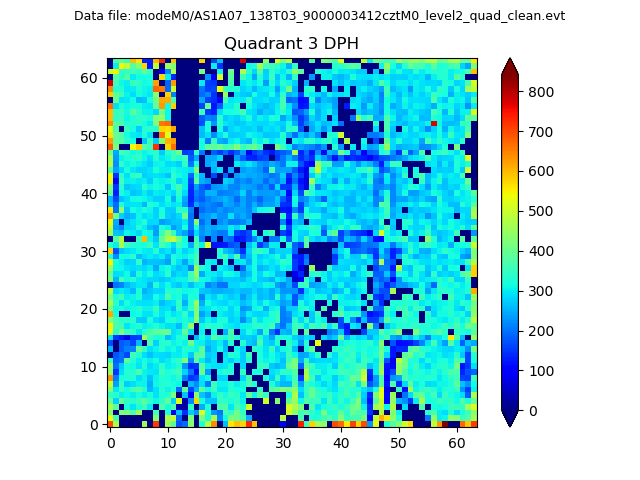 |
 |
Quadrant C |
| Plot type | Count rate plots | Images |
|---|---|---|
| Comparison with Poisson distribution Blue bars denote a histogram of data divided into 1 sec bins. Red curve is a Poisson curve with rate = median count rate of data. |
 |
 |
| Quadrant-wise count rates Data is divided into 100 sec bins |
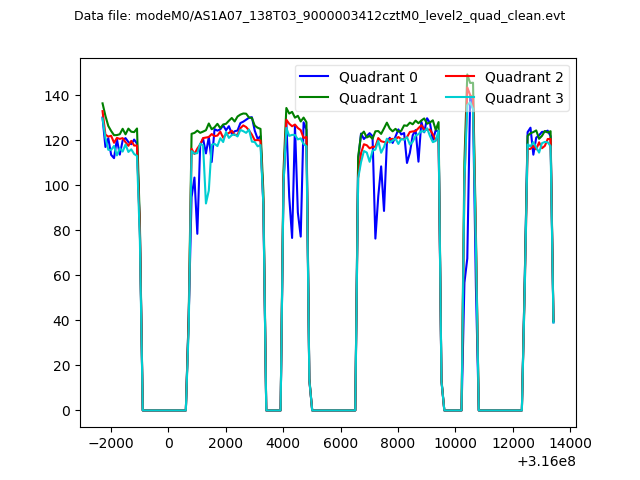 |
|
| Module-wise count rates for Quadrant A Data is divided into 100 sec bins |
 |
 |
| Module-wise count rates for Quadrant B Data is divided into 100 sec bins |
 |
 |
| Module-wise count rates for Quadrant C Data is divided into 100 sec bins |
 |
 |
| Module-wise count rates for Quadrant D Data is divided into 100 sec bins |
 |
 |
| Parameter | Plot |
|---|---|
| CZT HV Monitor | 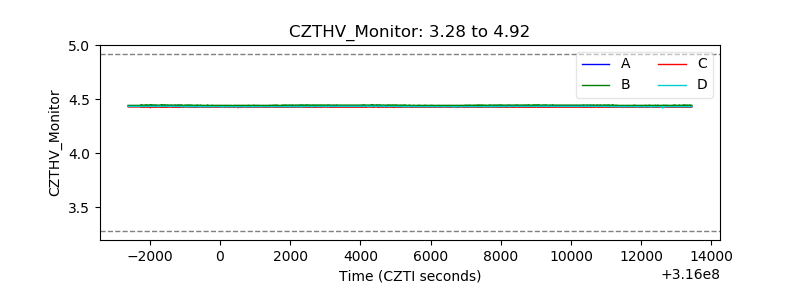 |
| D_VDD | 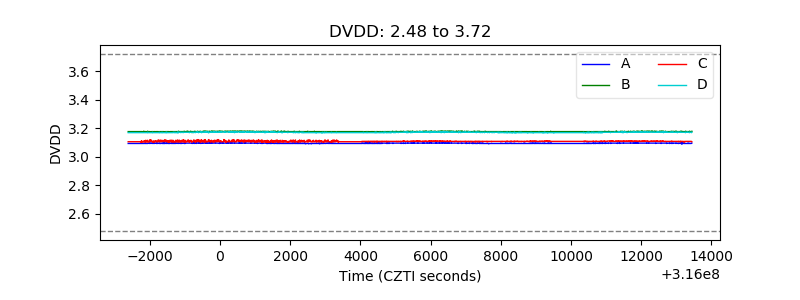 |
| Temperature 1 |  |
| Veto HV Monitor |  |
| Veto LLD |  |
| Alpha Counter | 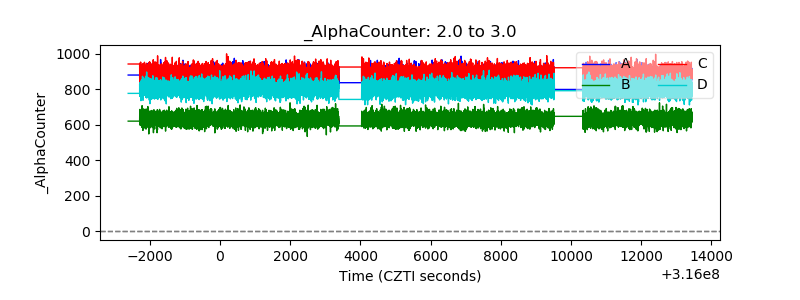 |
| _CPM_Rate |  |
| CZT Counter |  |
| +2.5 Volts monitor |  |
| +5 Volts monitor |  |
| _ROLL_ROT |  |
| _Roll_DEC |  |
| _Roll_RA |  |
| Veto Counter | 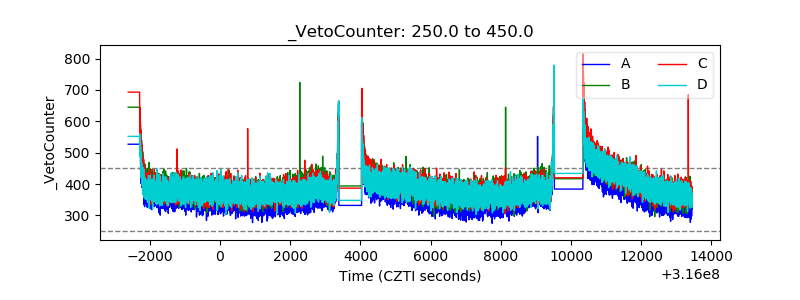 |