| Param | Original file | Final file |
|---|---|---|
| Filename | modeM0/AS1A07_138T03_9000003412_23110cztM0_level2.evt | modeM0/AS1A07_138T03_9000003412_23110cztM0_level2_quad_clean.evt |
| Size (bytes) | 1,035,944,640 | 160,758,720 |
| Size | 988.0 MB | 153.3 MB |
| Events in quadrant A | 10,237,279 | 957,130 |
| Events in quadrant B | 6,132,135 | 1,045,829 |
| Events in quadrant C | 6,052,519 | 1,003,841 |
| Events in quadrant D | 8,088,244 | 978,635 |
| Mode SS | |||
|---|---|---|---|
| Quadrant | BADHDUFLAG | Total packets | Discarded packets |
| A | 0 | 262 | 0 |
| B | 0 | 262 | 0 |
| C | 0 | 262 | 0 |
| D | 0 | 262 | 0 |
| Mode M9 | |||
|---|---|---|---|
| Quadrant | BADHDUFLAG | Total packets | Discarded packets |
| A | 0 | 18 | 0 |
| B | 0 | 18 | 0 |
| C | 0 | 18 | 0 |
| D | 0 | 18 | 0 |
| Mode M0 | |||
|---|---|---|---|
| Quadrant | BADHDUFLAG | Total packets | Discarded packets |
| A | 0 | 38813 | 3 |
| B | 0 | 26419 | 3 |
| C | 0 | 26215 | 3 |
| D | 0 | 32575 | 3 |
| Quadrant | Total seconds | Saturated seconds | Saturation percentage |
|---|---|---|---|
| A | 12769 | 1606 | 12.577336% |
| B | 12769 | 122 | 0.955439% |
| C | 12769 | 143 | 1.119900% |
| D | 12769 | 542 | 4.244655% |
Noise dominated data is calculated using 1-second bins in cleaned event files. If a bin has >2000 counts, and if more than 50% of those come from <1% of pixels, then it is considered to be noise-dominated and hence unusable.
| Quadrant | # 1 sec bins | Bins with >0 counts | Bins with >2000 counts | High rate bins dominated by noise | Noise dominated (total time) | Noise dominated (detector-on time) | Marked lightcurve |
|---|---|---|---|---|---|---|---|
| A | 14234 | 12770 | 1247 | 1247 | 8.76% | 9.77% | 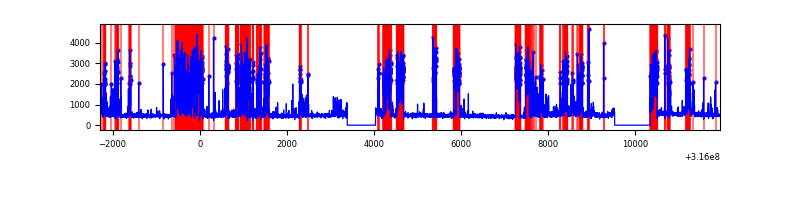 |
| B | 14234 | 12770 | 6 | 6 | 0.04% | 0.05% | 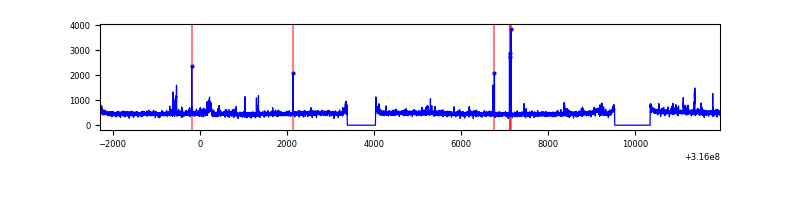 |
| C | 14234 | 12770 | 3 | 3 | 0.02% | 0.02% | 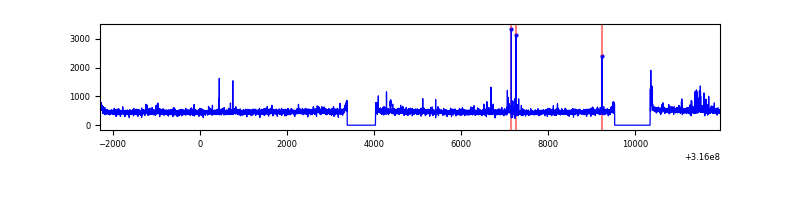 |
| D | 14234 | 12771 | 420 | 420 | 2.95% | 3.29% | 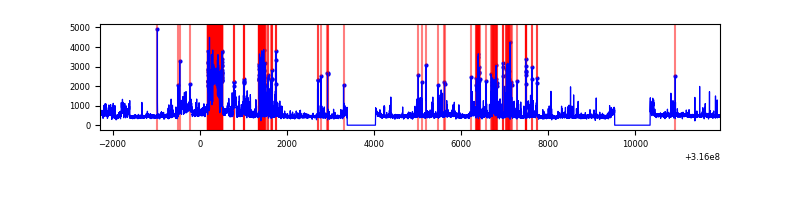 |
Top three noisy pixels from each quadrant. If the there are fewer than three noisy pixels in the level2.evt file, extra rows are filled as -1
| Pixel properties | Quadrant properties | ||||||
|---|---|---|---|---|---|---|---|
| Quadrant | DetID | PixID | Counts | Sigma | Mean | Median | Sigma |
| A | 6 | 16 | 4679648 | 16167.46 | 1439 | 1410 | 289.4 |
| A | 13 | 254 | 17167 | 54.45 | 1439 | 1410 | 289.4 |
| A | 3 | 137 | 12799 | 39.36 | 1439 | 1410 | 289.4 |
| B | 0 | 190 | 116973 | 402.34 | 1508 | 1469 | 287.1 |
| B | 12 | 111 | 35371 | 118.09 | 1508 | 1469 | 287.1 |
| B | 0 | 189 | 35330 | 117.95 | 1508 | 1469 | 287.1 |
| C | 14 | 238 | 228421 | 668.82 | 1449 | 1455 | 339.4 |
| C | 2 | 16 | 51795 | 148.34 | 1449 | 1455 | 339.4 |
| C | 0 | 207 | 51268 | 146.79 | 1449 | 1455 | 339.4 |
| D | 13 | 153 | 1076469 | 3064.19 | 1444 | 1401 | 350.8 |
| D | 1 | 52 | 502734 | 1428.92 | 1444 | 1401 | 350.8 |
| D | 12 | 227 | 399448 | 1134.53 | 1444 | 1401 | 350.8 |
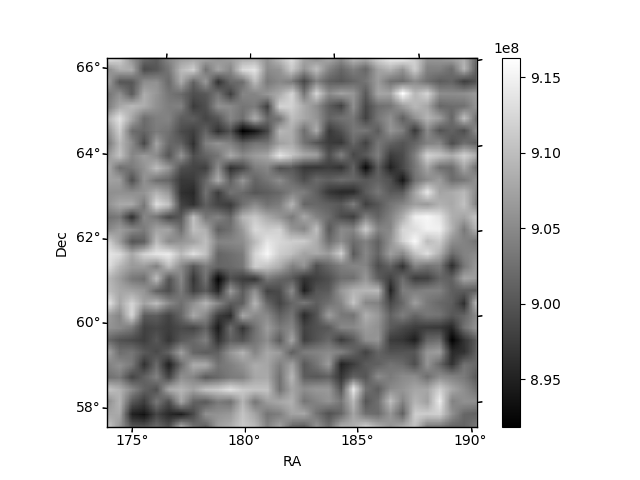
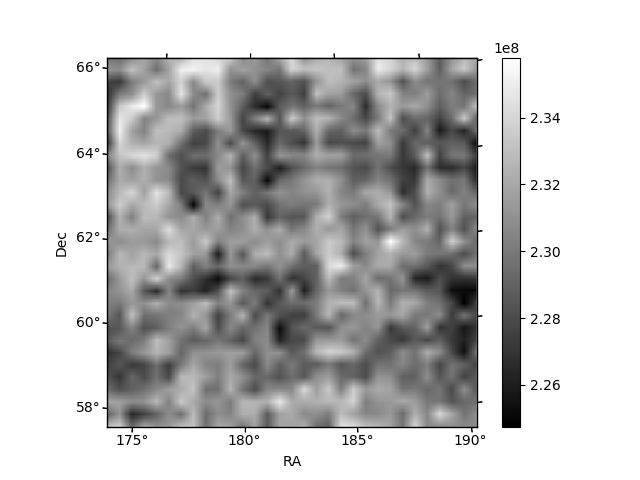
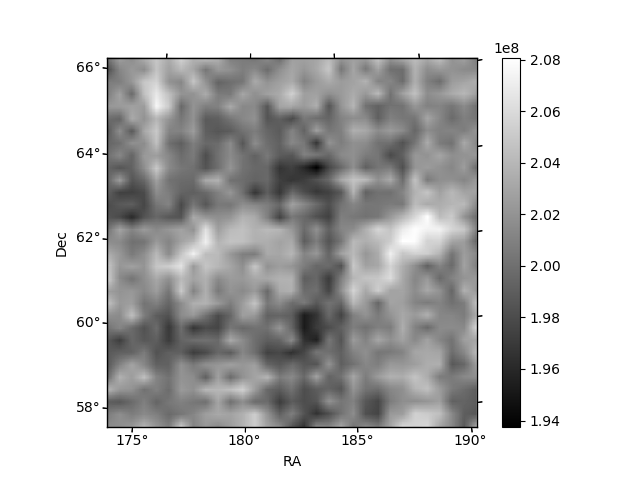
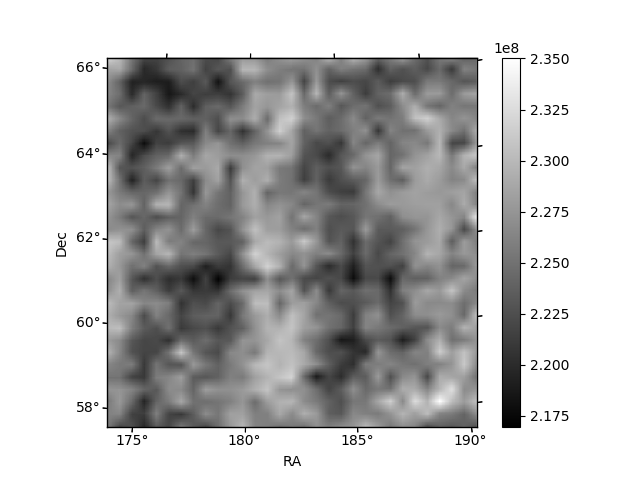
Histogram calculated using DETX and DETY for each event in the final _common_clean file
| Quadrant A | 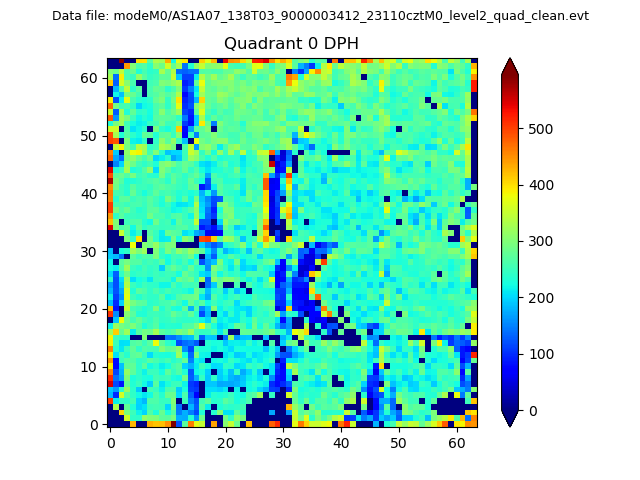 |
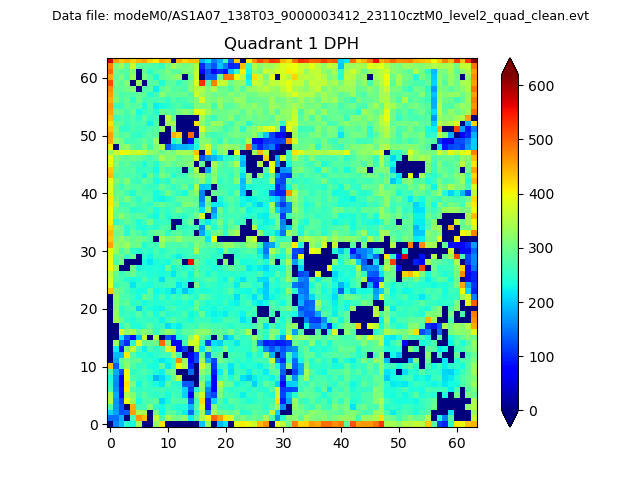 |
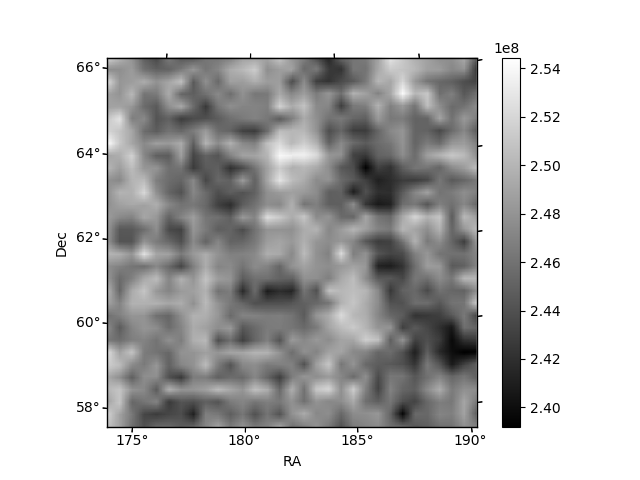
Quadrant B |
|---|---|---|---|
| Quadrant D | 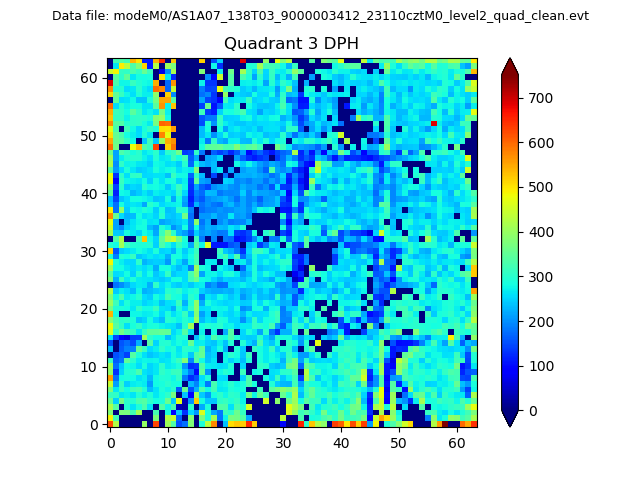 |
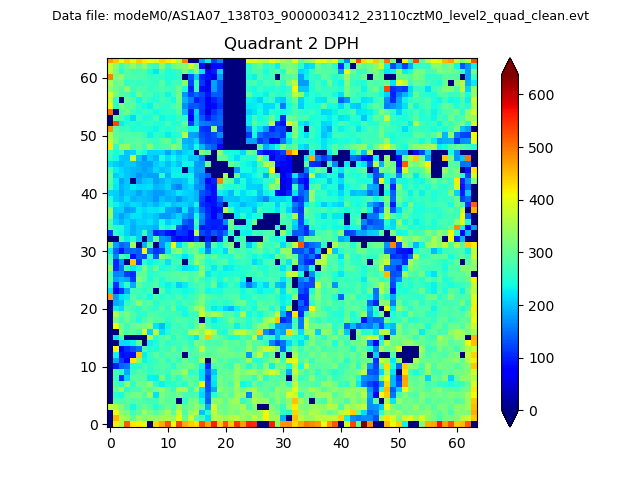 |
Quadrant C |
| Plot type | Count rate plots | Images |
|---|---|---|
| Comparison with Poisson distribution Blue bars denote a histogram of data divided into 1 sec bins. Red curve is a Poisson curve with rate = median count rate of data. |
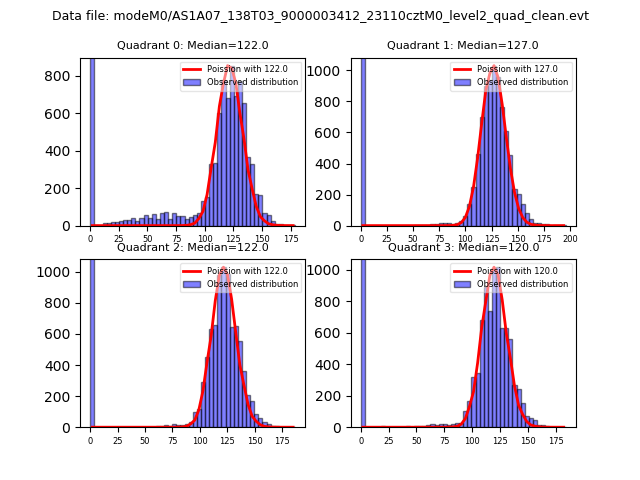 |
 |
| Quadrant-wise count rates Data is divided into 100 sec bins |
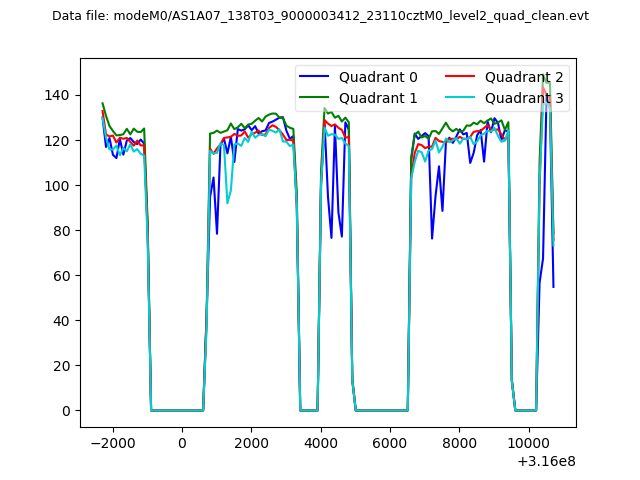 |
|
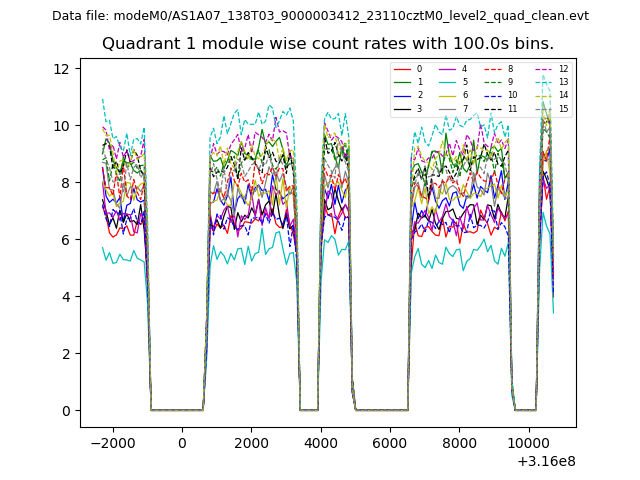
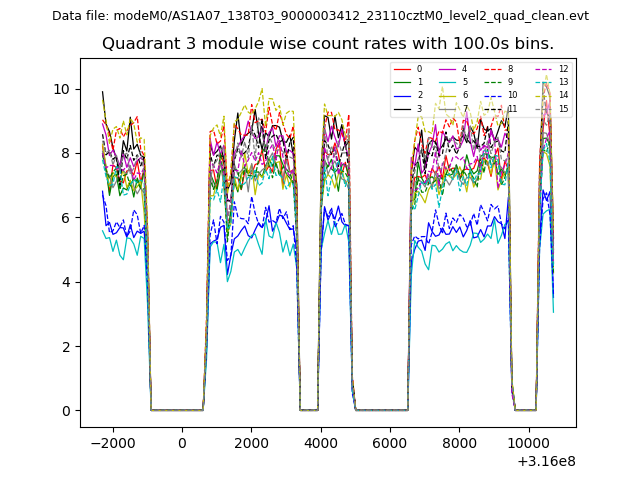
| Module-wise count rates for Quadrant A Data is divided into 100 sec bins |
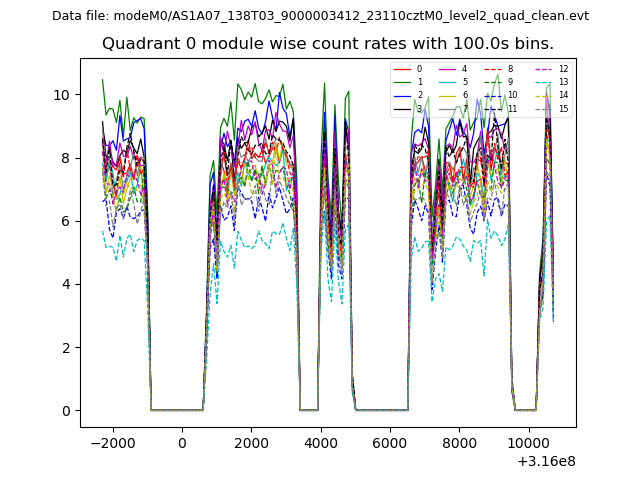 |
 |
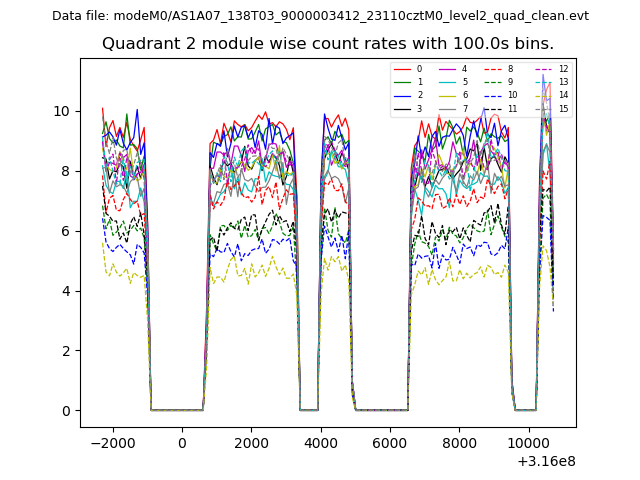
| Module-wise count rates for Quadrant B Data is divided into 100 sec bins |
 |
 |
| Module-wise count rates for Quadrant C Data is divided into 100 sec bins |
 |
 |
| Module-wise count rates for Quadrant D Data is divided into 100 sec bins |
 |
 |
| Parameter | Plot |
|---|---|
| CZT HV Monitor | 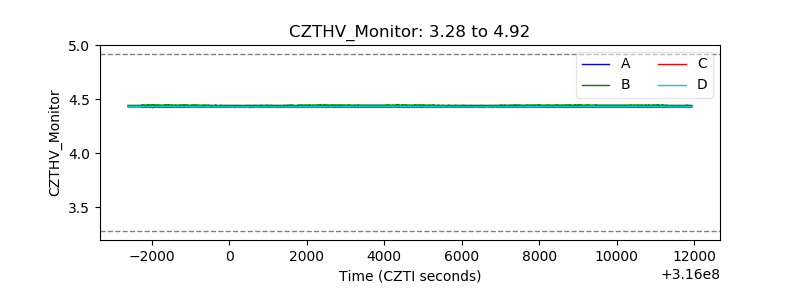 |
| D_VDD | 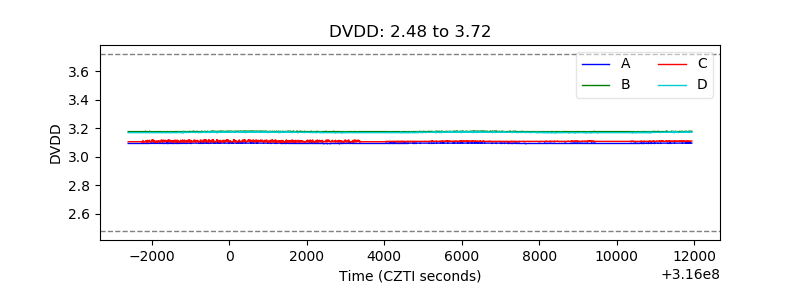 |
| Temperature 1 | 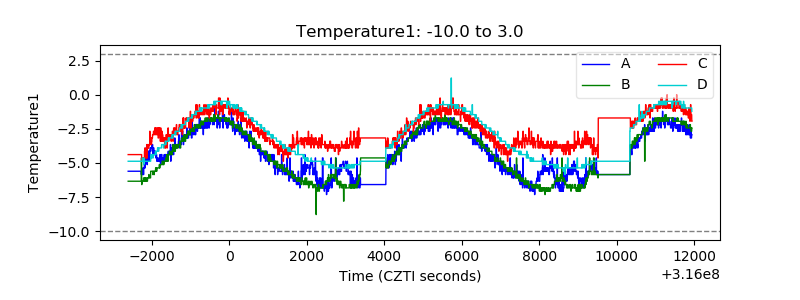 |
| Veto HV Monitor | 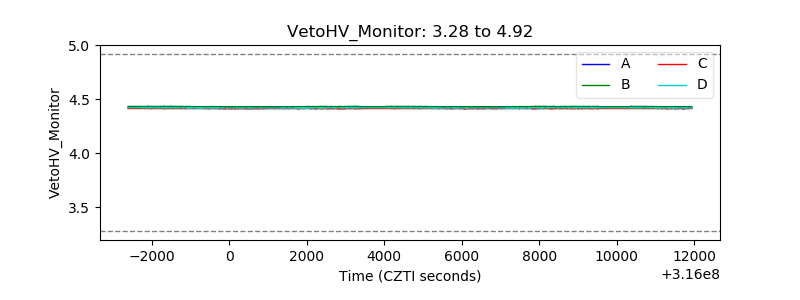 |
| Veto LLD | 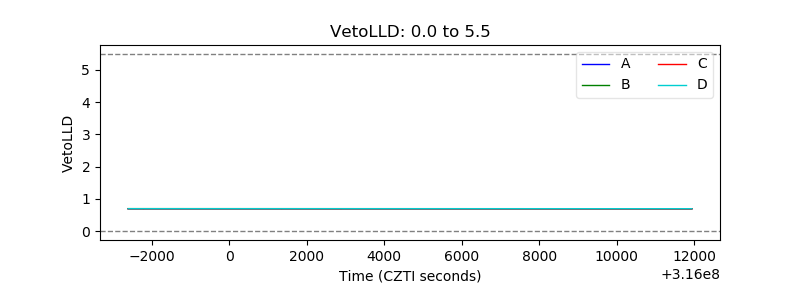 |
| Alpha Counter | 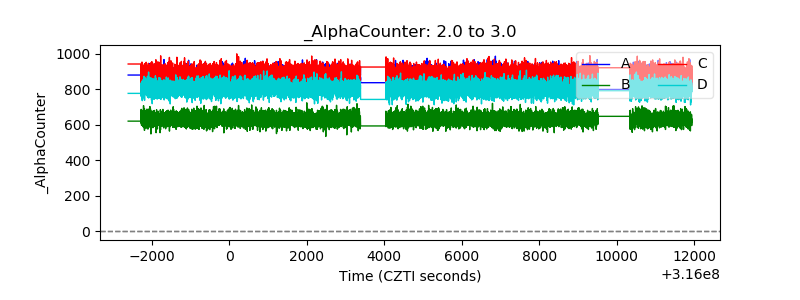 |
| _CPM_Rate | 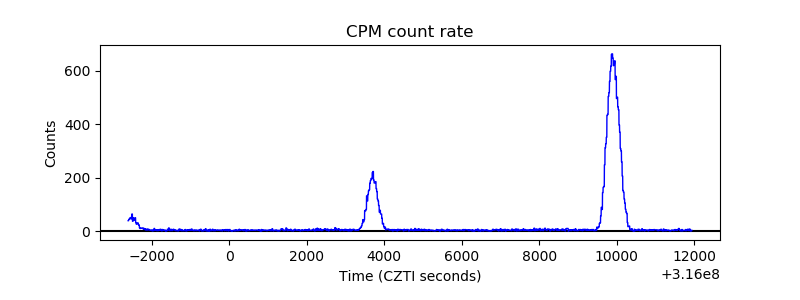 |
| CZT Counter | 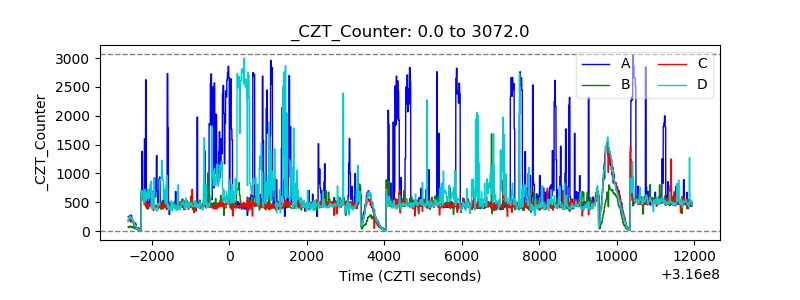 |
| +2.5 Volts monitor |  |
| +5 Volts monitor | 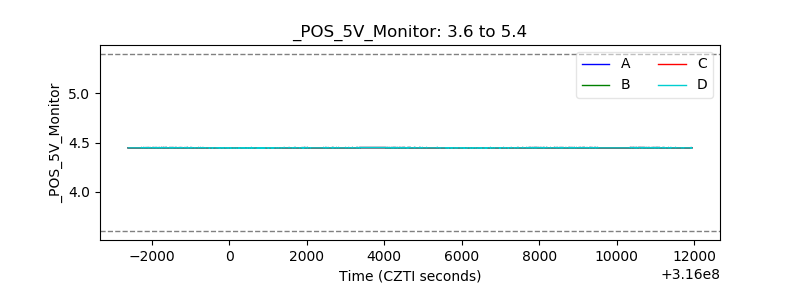 |
| _ROLL_ROT | 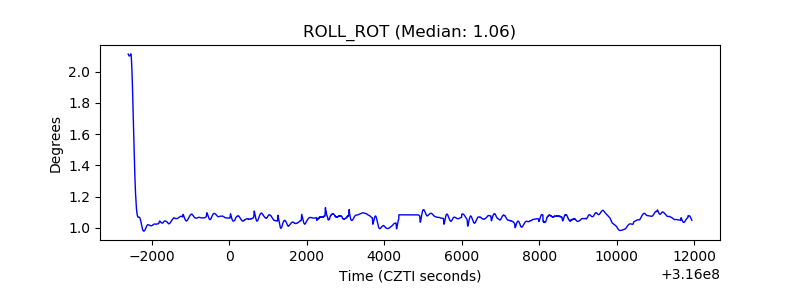 |
| _Roll_DEC | 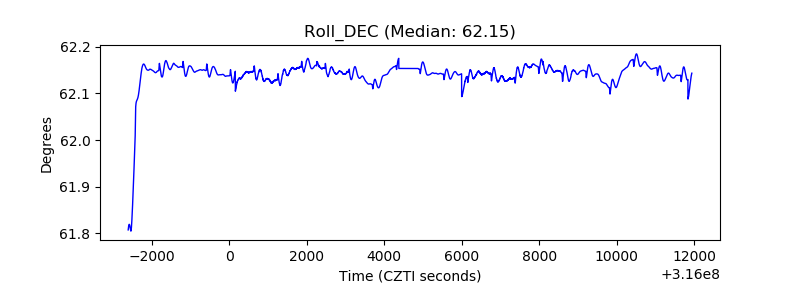 |
| _Roll_RA | 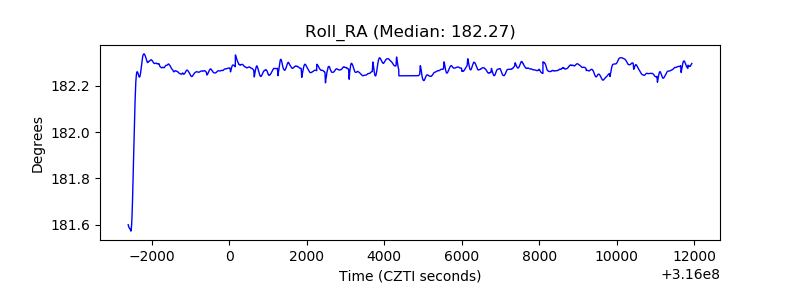 |
| Veto Counter | 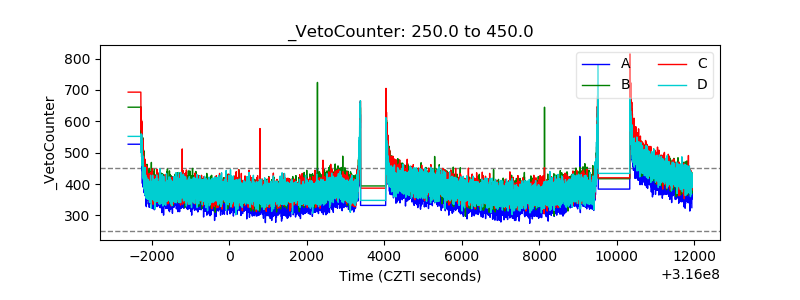 |