| Param | Original file | Final file |
|---|---|---|
| Filename | modeM0/AS1A07_138T03_9000003412_23113cztM0_level2.evt | modeM0/AS1A07_138T03_9000003412_23113cztM0_level2_quad_clean.evt |
| Size (bytes) | 152,251,200 | 20,894,400 |
| Size | 145.2 MB | 19.9 MB |
| Events in quadrant A | 1,210,322 | 119,649 |
| Events in quadrant B | 1,040,516 | 120,379 |
| Events in quadrant C | 1,085,604 | 115,597 |
| Events in quadrant D | 1,120,974 | 115,933 |
| Mode SS | |||
|---|---|---|---|
| Quadrant | BADHDUFLAG | Total packets | Discarded packets |
| A | 0 | 44 | 0 |
| B | 0 | 44 | 0 |
| C | 0 | 44 | 0 |
| D | 0 | 44 | 0 |
| Mode M0 | |||
|---|---|---|---|
| Quadrant | BADHDUFLAG | Total packets | Discarded packets |
| A | 0 | 5104 | 0 |
| B | 0 | 4553 | 0 |
| C | 0 | 4654 | 0 |
| D | 0 | 4762 | 0 |
| Quadrant | Total seconds | Saturated seconds | Saturation percentage |
|---|---|---|---|
| A | 2221 | 44 | 1.981090% |
| B | 2222 | 3 | 0.135014% |
| C | 2222 | 10 | 0.450045% |
| D | 2222 | 4 | 0.180018% |
Noise dominated data is calculated using 1-second bins in cleaned event files. If a bin has >2000 counts, and if more than 50% of those come from <1% of pixels, then it is considered to be noise-dominated and hence unusable.
| Quadrant | # 1 sec bins | Bins with >0 counts | Bins with >2000 counts | High rate bins dominated by noise | Noise dominated (total time) | Noise dominated (detector-on time) | Marked lightcurve |
|---|---|---|---|---|---|---|---|
| A | 2221 | 2221 | 33 | 33 | 1.49% | 1.49% | 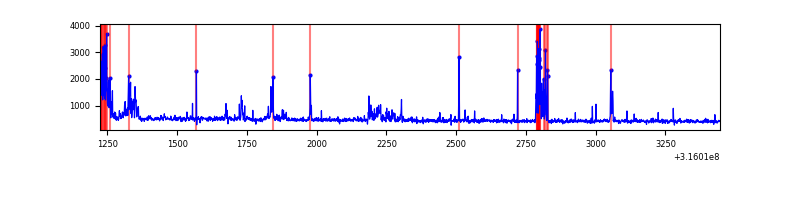 |
| B | 2222 | 2222 | 4 | 4 | 0.18% | 0.18% | 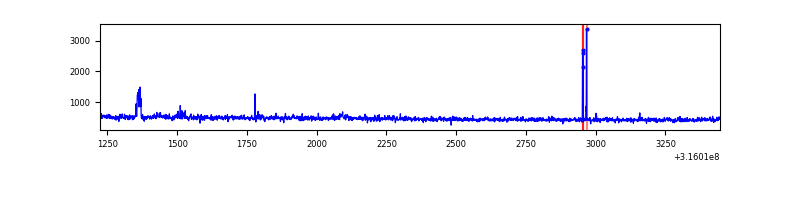 |
| C | 2222 | 2222 | 1 | 1 | 0.05% | 0.05% | 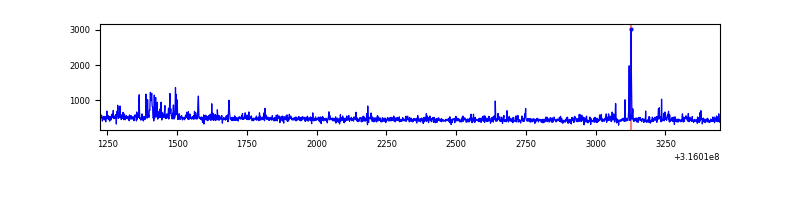 |
| D | 2222 | 2222 | 3 | 3 | 0.14% | 0.14% | 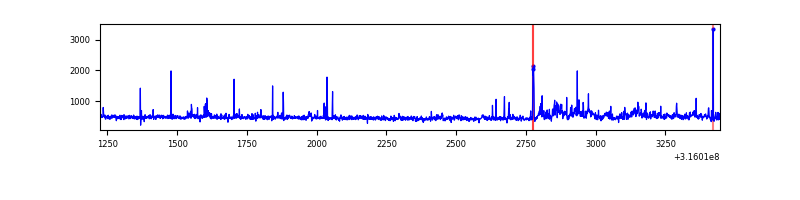 |
Top three noisy pixels from each quadrant. If the there are fewer than three noisy pixels in the level2.evt file, extra rows are filled as -1
| Pixel properties | Quadrant properties | ||||||
|---|---|---|---|---|---|---|---|
| Quadrant | DetID | PixID | Counts | Sigma | Mean | Median | Sigma |
| A | 6 | 16 | 230433 | 4370.99 | 254 | 248 | 52.7 |
| A | 13 | 254 | 3359 | 59.07 | 254 | 248 | 52.7 |
| A | 0 | 226 | 2278 | 38.55 | 254 | 248 | 52.7 |
| B | 0 | 190 | 20863 | 418.38 | 254 | 248 | 49.3 |
| B | 4 | 216 | 12193 | 242.42 | 254 | 248 | 49.3 |
| B | 3 | 209 | 6678 | 130.5 | 254 | 248 | 49.3 |
| C | 2 | 16 | 62752 | 1044.06 | 248 | 249 | 59.9 |
| C | 14 | 238 | 39620 | 657.66 | 248 | 249 | 59.9 |
| C | 0 | 207 | 10669 | 174.06 | 248 | 249 | 59.9 |
| D | 1 | 52 | 86948 | 1387.54 | 253 | 245 | 62.5 |
| D | 13 | 174 | 20079 | 317.41 | 253 | 245 | 62.5 |
| D | 12 | 233 | 11332 | 177.43 | 253 | 245 | 62.5 |
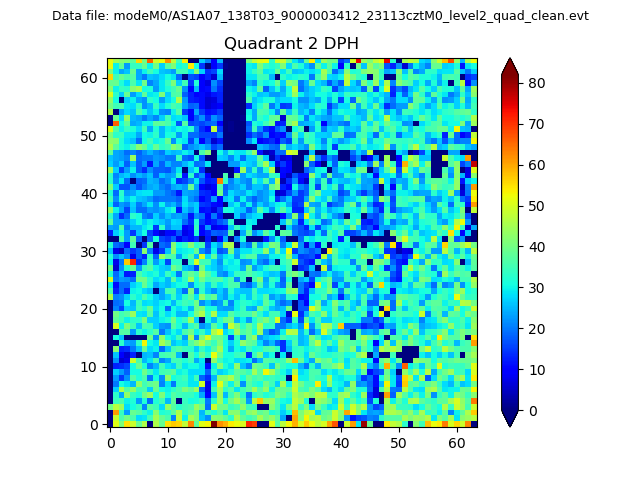
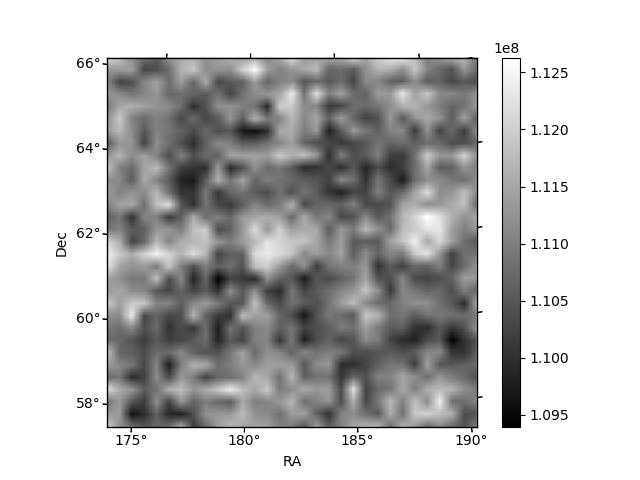
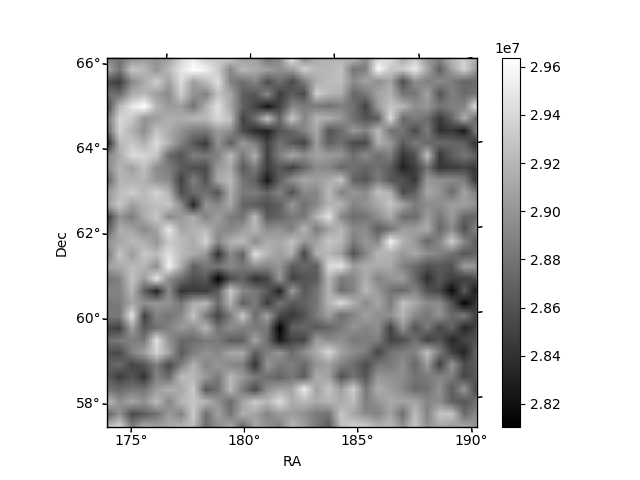
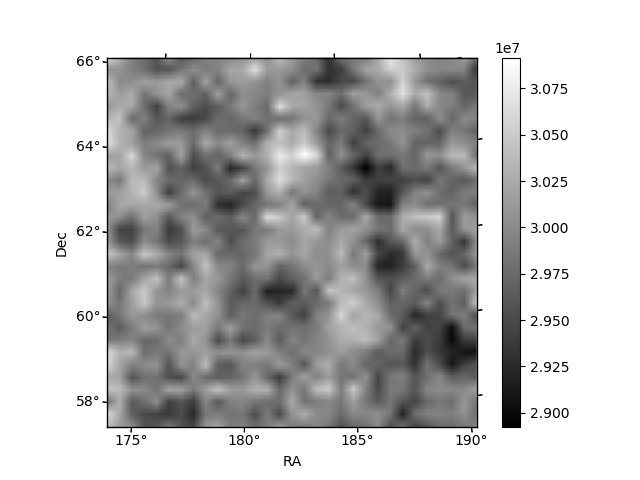
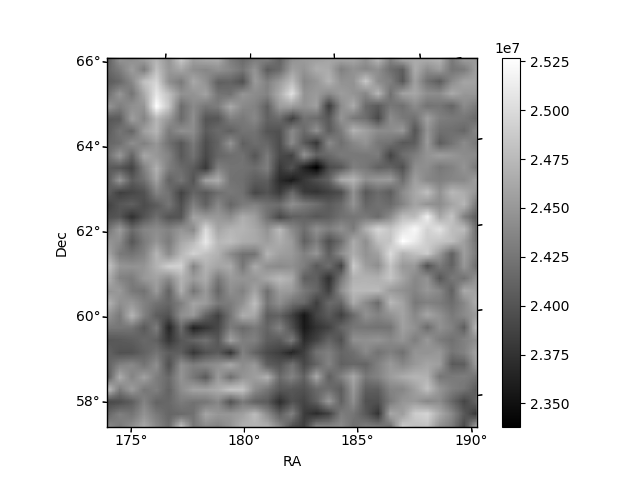
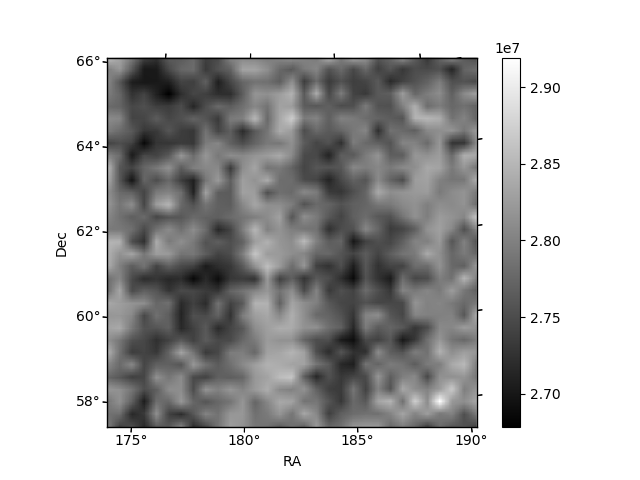
Histogram calculated using DETX and DETY for each event in the final _common_clean file
| Quadrant A | 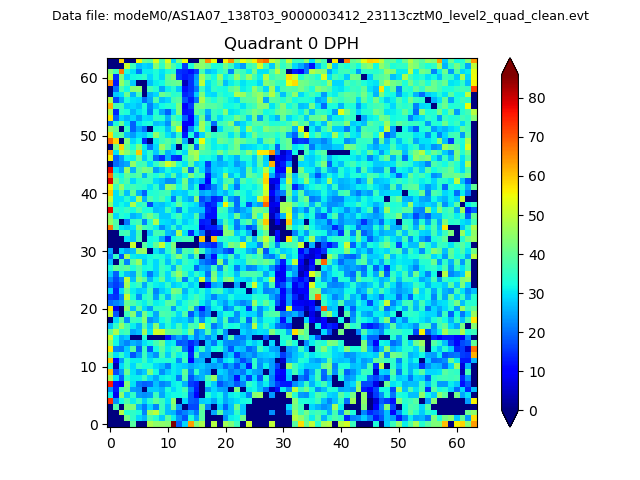 |
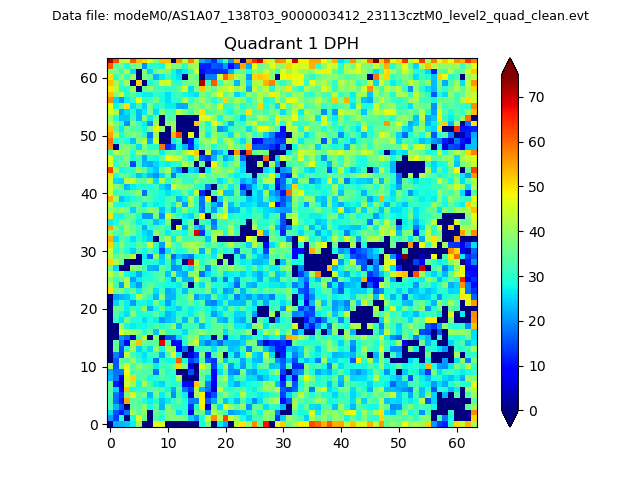 |
Quadrant B |
|---|---|---|---|
| Quadrant D | 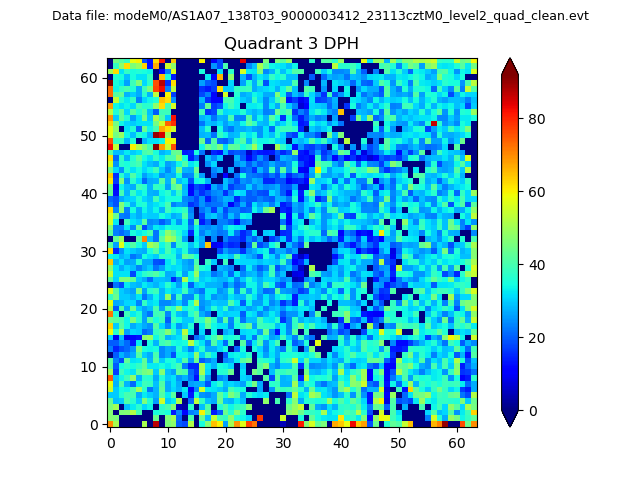 |
 |
Quadrant C |
| Plot type | Count rate plots | Images |
|---|---|---|
| Comparison with Poisson distribution Blue bars denote a histogram of data divided into 1 sec bins. Red curve is a Poisson curve with rate = median count rate of data. |
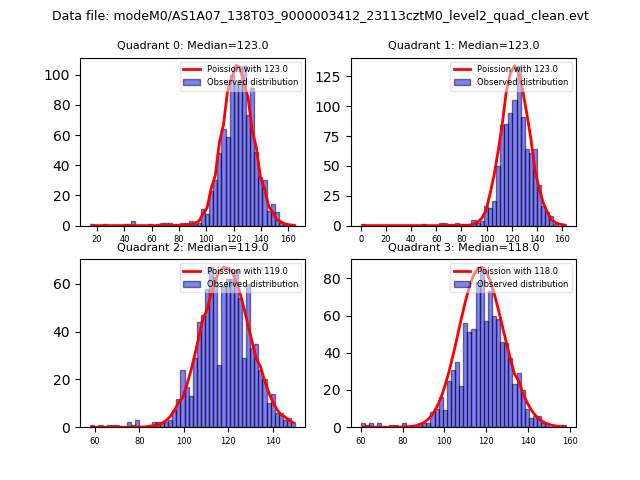 |
 |
| Quadrant-wise count rates Data is divided into 100 sec bins |
 |
|
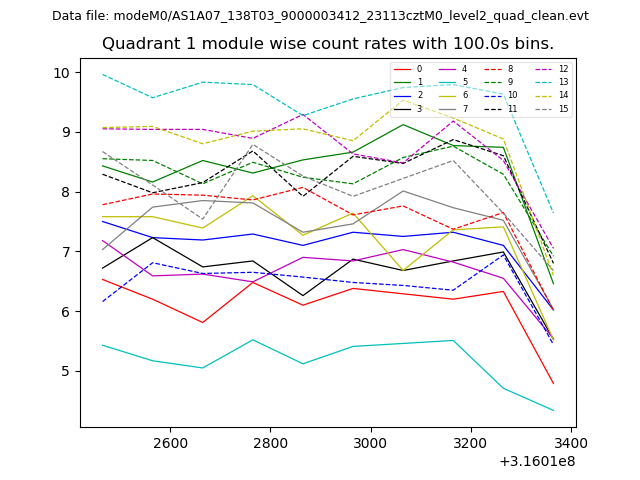
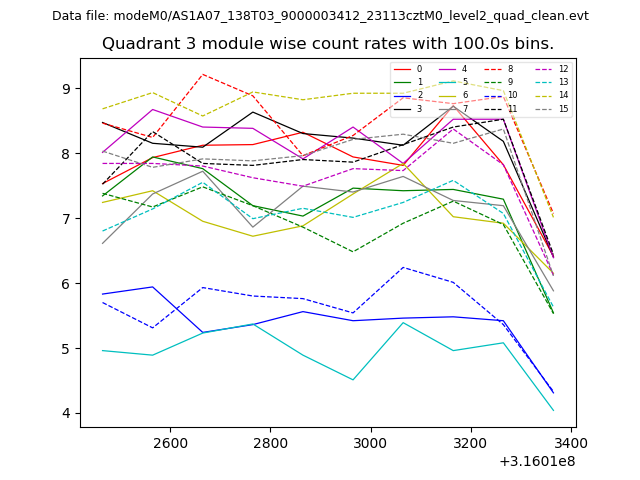
| Module-wise count rates for Quadrant A Data is divided into 100 sec bins |
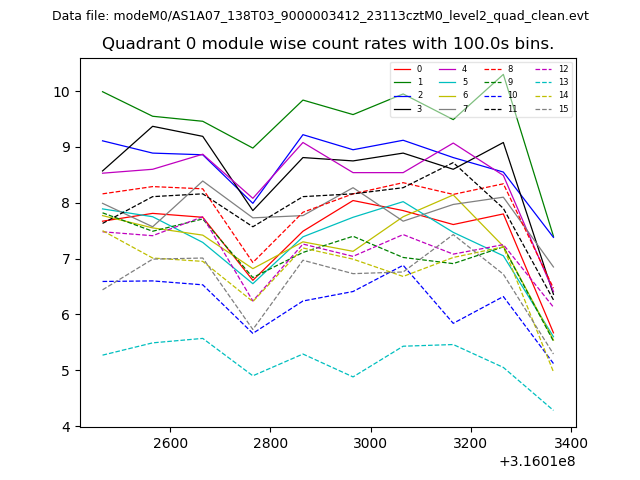 |
 |
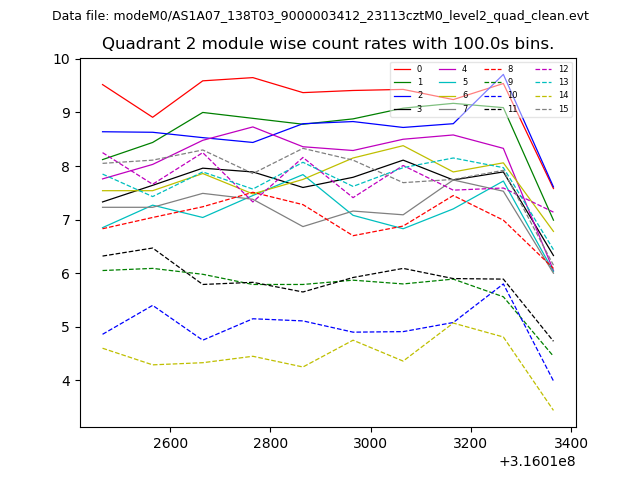
| Module-wise count rates for Quadrant B Data is divided into 100 sec bins |
 |
 |
| Module-wise count rates for Quadrant C Data is divided into 100 sec bins |
 |
 |
| Module-wise count rates for Quadrant D Data is divided into 100 sec bins |
 |
 |
| Parameter | Plot |
|---|---|
| CZT HV Monitor | 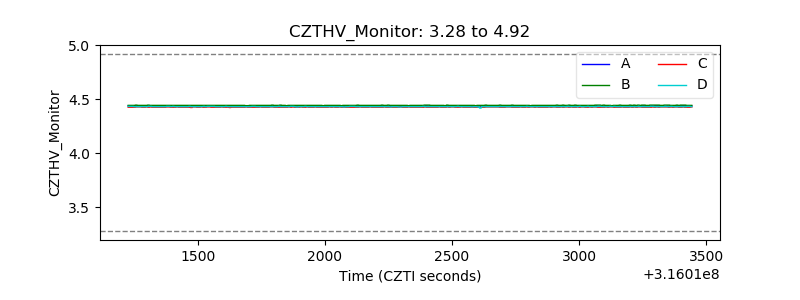 |
| D_VDD | 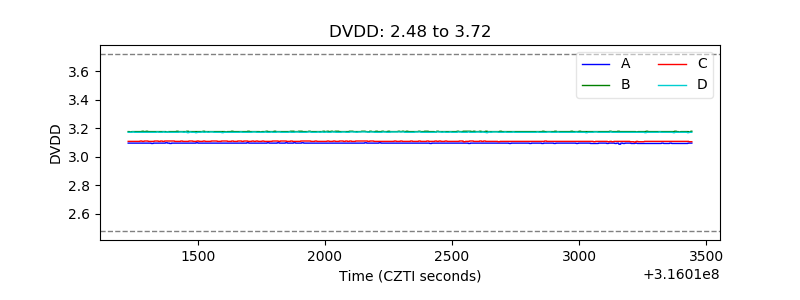 |
| Temperature 1 | 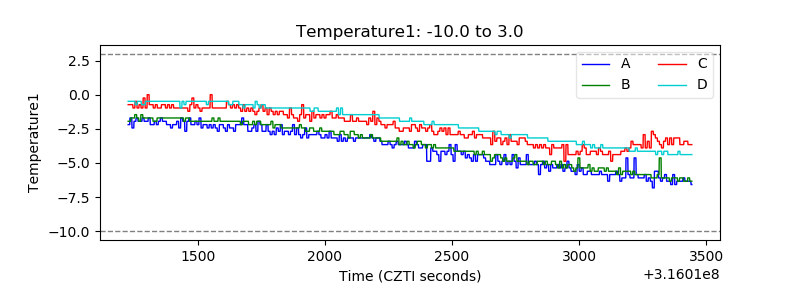 |
| Veto HV Monitor | 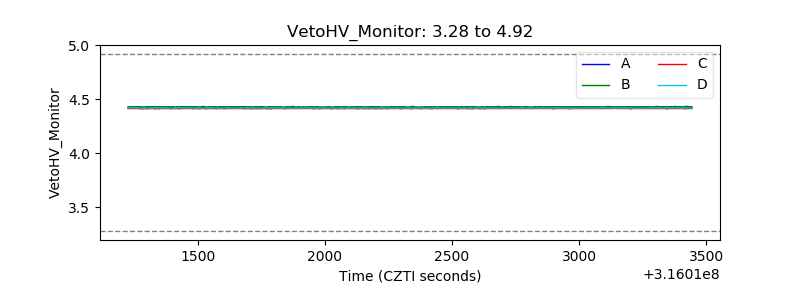 |
| Veto LLD | 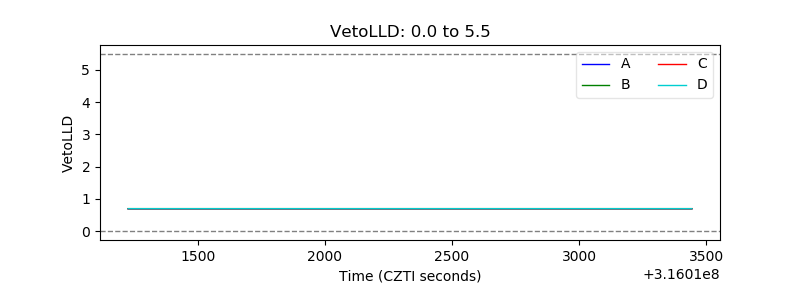 |
| Alpha Counter | 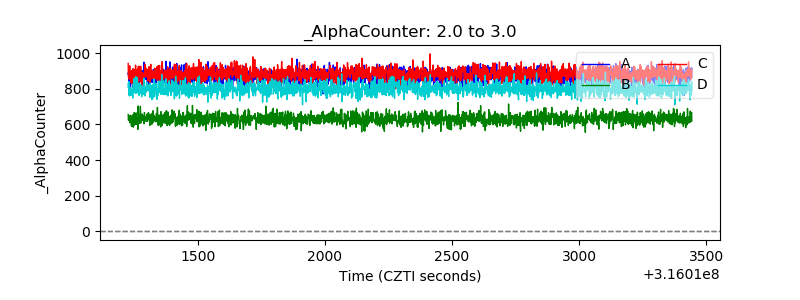 |
| _CPM_Rate | 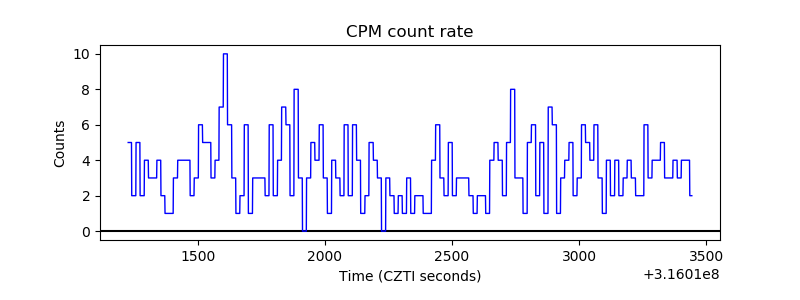 |
| CZT Counter | 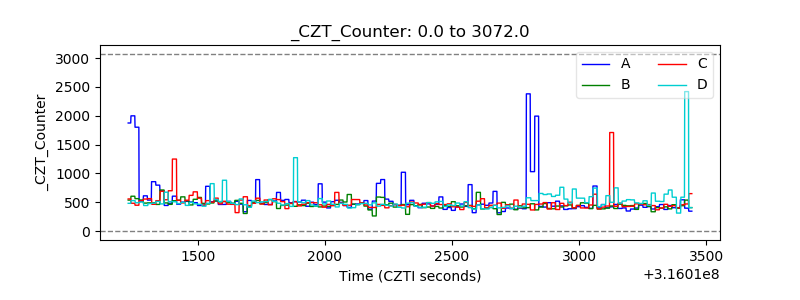 |
| +2.5 Volts monitor | 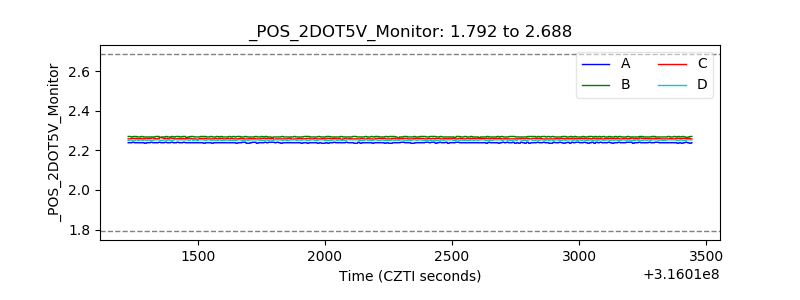 |
| +5 Volts monitor | 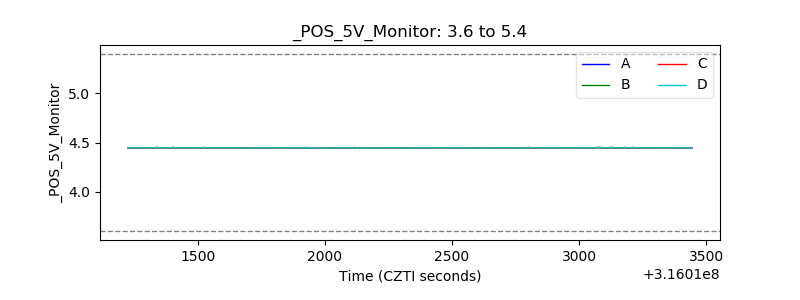 |
| _ROLL_ROT | 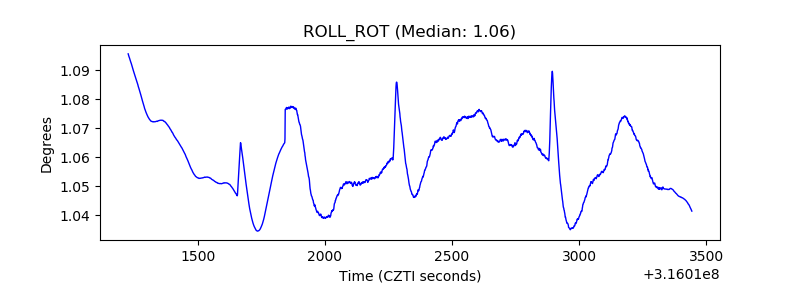 |
| _Roll_DEC | 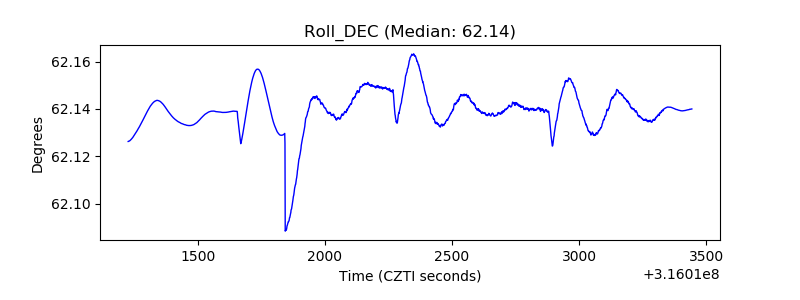 |
| _Roll_RA | 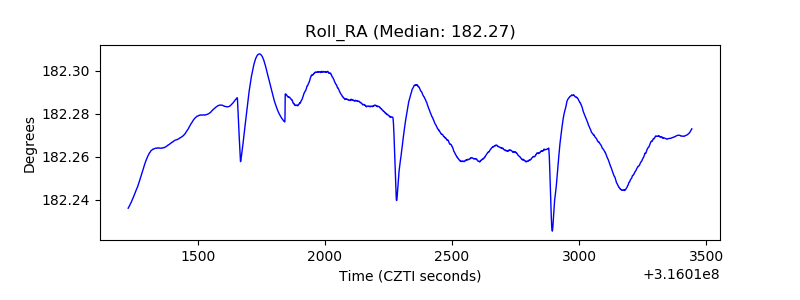 |
| Veto Counter | 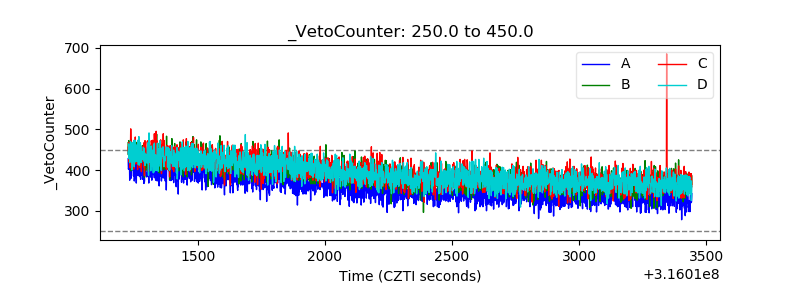 |