| Param | Original file | Final file |
|---|---|---|
| Filename | modeM0/AS1A08_008T01_9000003414_23113cztM0_level2.evt | modeM0/AS1A08_008T01_9000003414_23113cztM0_level2_quad_clean.evt |
| Size (bytes) | 677,413,440 | 144,014,400 |
| Size | 646.0 MB | 137.3 MB |
| Events in quadrant A | 7,626,758 | 921,275 |
| Events in quadrant B | 3,799,946 | 1,033,137 |
| Events in quadrant C | 3,844,031 | 966,927 |
| Events in quadrant D | 4,746,020 | 927,188 |
| Mode M0 | |||
|---|---|---|---|
| Quadrant | BADHDUFLAG | Total packets | Discarded packets |
| A | 0 | 27806 | 2 |
| B | 0 | 16230 | 2 |
| C | 0 | 16128 | 2 |
| D | 0 | 19174 | 2 |
| Mode M9 | |||
|---|---|---|---|
| Quadrant | BADHDUFLAG | Total packets | Discarded packets |
| A | 0 | 21 | 0 |
| B | 0 | 21 | 0 |
| C | 0 | 21 | 0 |
| D | 0 | 21 | 0 |
| Mode SS | |||
|---|---|---|---|
| Quadrant | BADHDUFLAG | Total packets | Discarded packets |
| A | 0 | 152 | 0 |
| B | 0 | 152 | 0 |
| C | 0 | 152 | 0 |
| D | 0 | 152 | 0 |
| Quadrant | Total seconds | Saturated seconds | Saturation percentage |
|---|---|---|---|
| A | 7363 | 1394 | 18.932500% |
| B | 7363 | 94 | 1.276654% |
| C | 7363 | 143 | 1.942143% |
| D | 7363 | 439 | 5.962244% |
Noise dominated data is calculated using 1-second bins in cleaned event files. If a bin has >2000 counts, and if more than 50% of those come from <1% of pixels, then it is considered to be noise-dominated and hence unusable.
| Quadrant | # 1 sec bins | Bins with >0 counts | Bins with >2000 counts | High rate bins dominated by noise | Noise dominated (total time) | Noise dominated (detector-on time) | Marked lightcurve |
|---|---|---|---|---|---|---|---|
| A | 9488 | 7363 | 1065 | 1065 | 11.22% | 14.46% | 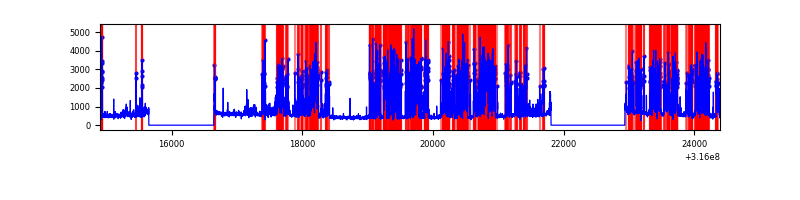 |
| B | 9488 | 7364 | 0 | 0 | 0.00% | 0.00% | 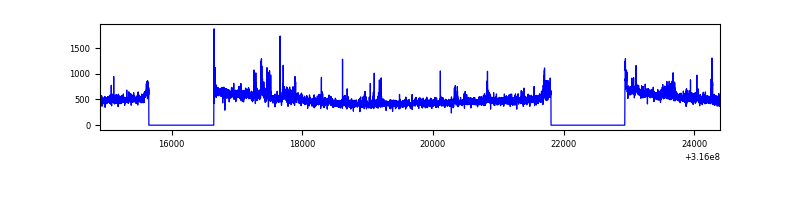 |
| C | 9488 | 7363 | 6 | 6 | 0.06% | 0.08% | 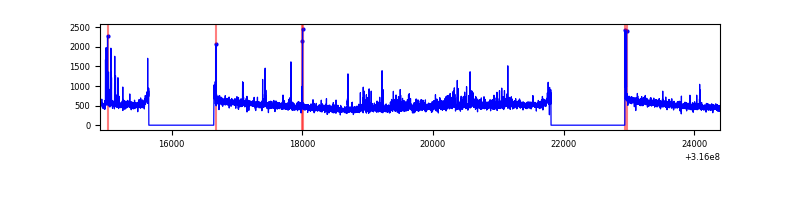 |
| D | 9488 | 7365 | 208 | 208 | 2.19% | 2.82% | 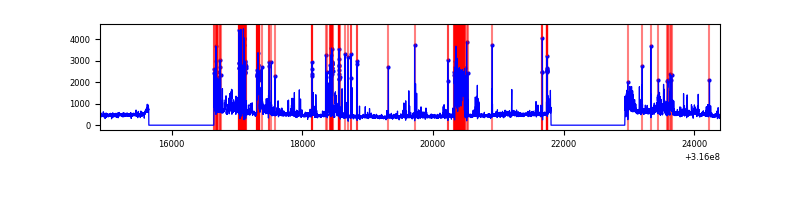 |
Top three noisy pixels from each quadrant. If the there are fewer than three noisy pixels in the level2.evt file, extra rows are filled as -1
| Pixel properties | Quadrant properties | ||||||
|---|---|---|---|---|---|---|---|
| Quadrant | DetID | PixID | Counts | Sigma | Mean | Median | Sigma |
| A | 6 | 16 | 4292610 | 24966.93 | 864 | 848 | 171.9 |
| A | 13 | 254 | 10535 | 56.35 | 864 | 848 | 171.9 |
| A | 0 | 226 | 7538 | 38.92 | 864 | 848 | 171.9 |
| B | 0 | 190 | 80030 | 457.85 | 921 | 900 | 172.8 |
| B | 0 | 189 | 57223 | 325.89 | 921 | 900 | 172.8 |
| B | 12 | 111 | 20406 | 112.86 | 921 | 900 | 172.8 |
| C | 0 | 207 | 202840 | 1000.37 | 875 | 879 | 201.9 |
| C | 14 | 238 | 138810 | 683.21 | 875 | 879 | 201.9 |
| C | 2 | 16 | 62081 | 303.15 | 875 | 879 | 201.9 |
| D | 1 | 52 | 1082833 | 5122.6 | 868 | 843 | 211.2 |
| D | 1 | 239 | 204492 | 964.16 | 868 | 843 | 211.2 |
| D | 12 | 233 | 45431 | 211.1 | 868 | 843 | 211.2 |
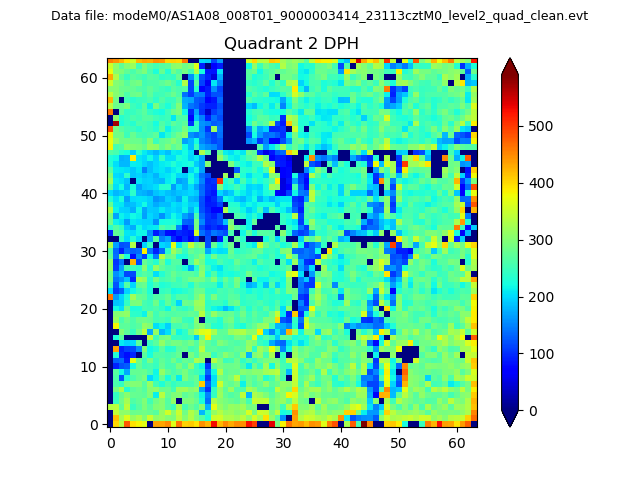
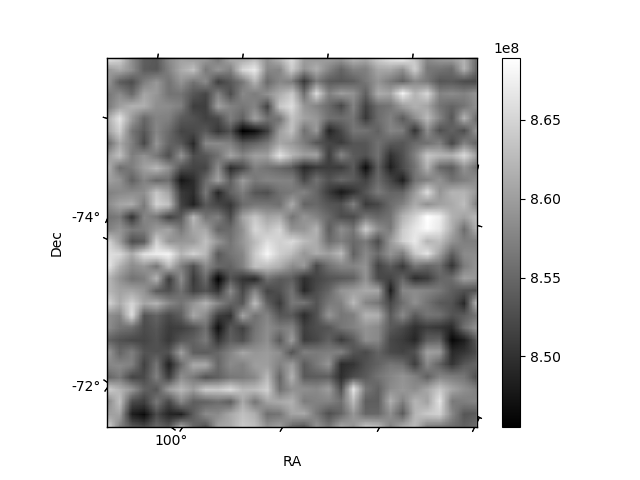
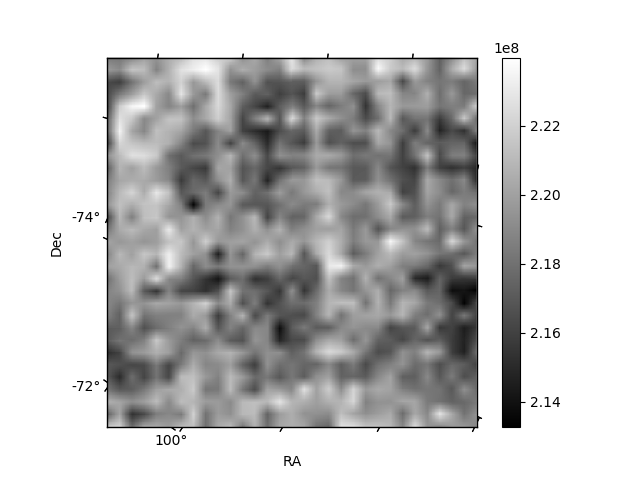
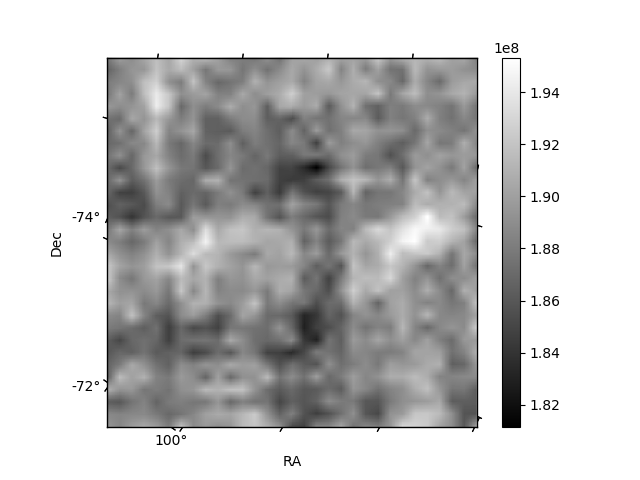
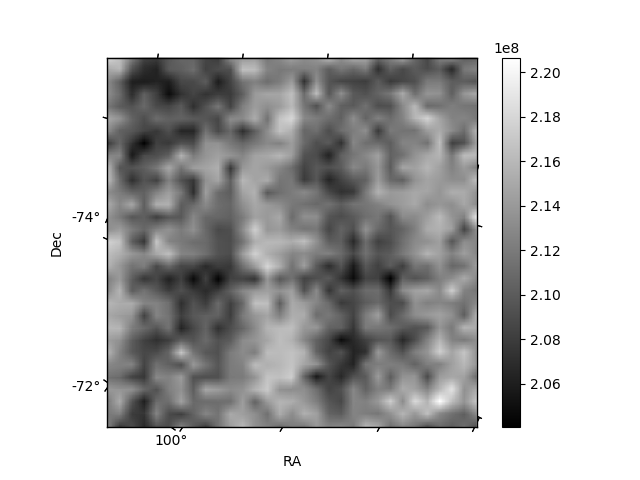
Histogram calculated using DETX and DETY for each event in the final _common_clean file
| Quadrant A | 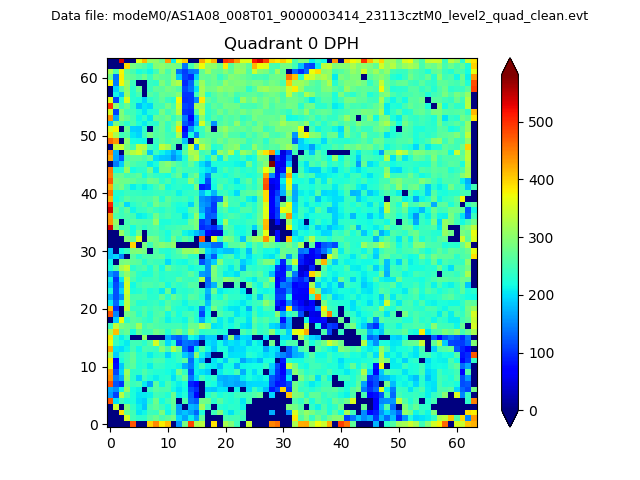 |
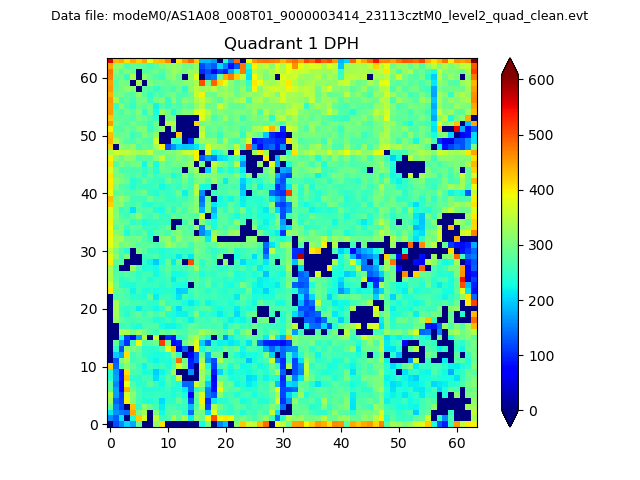 |
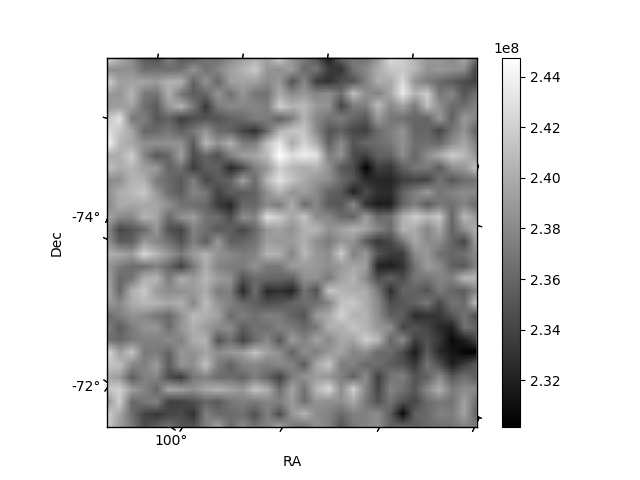
Quadrant B |
|---|---|---|---|
| Quadrant D | 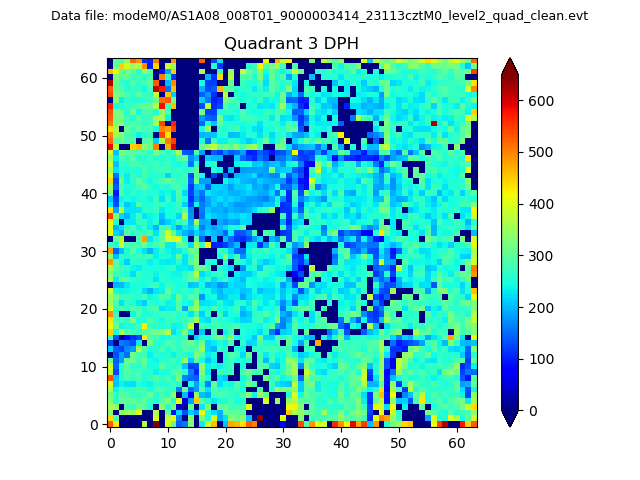 |
 |
Quadrant C |
| Plot type | Count rate plots | Images |
|---|---|---|
| Comparison with Poisson distribution Blue bars denote a histogram of data divided into 1 sec bins. Red curve is a Poisson curve with rate = median count rate of data. |
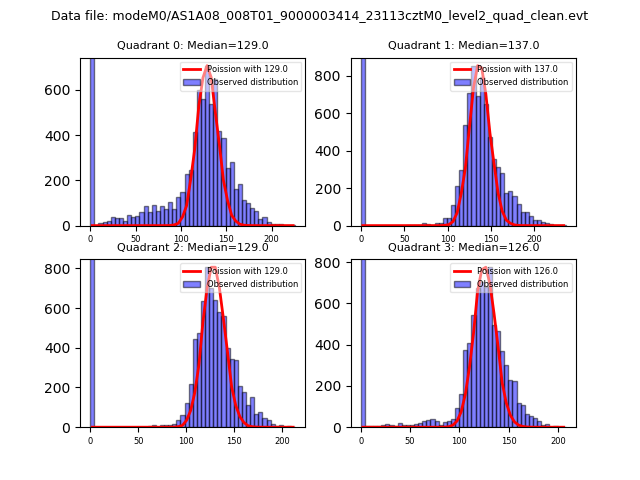 |
 |
| Quadrant-wise count rates Data is divided into 100 sec bins |
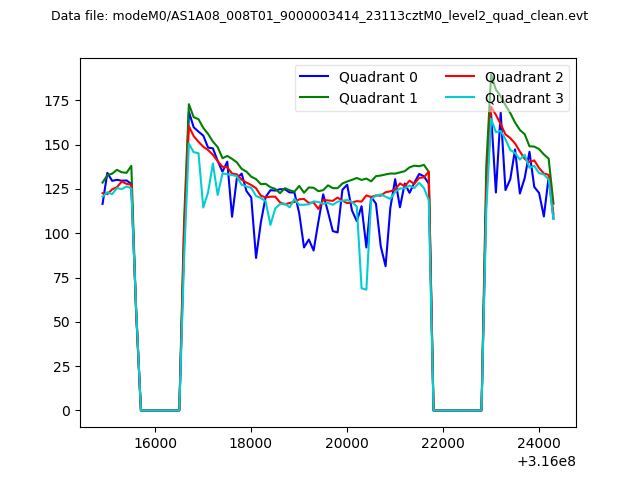 |
|
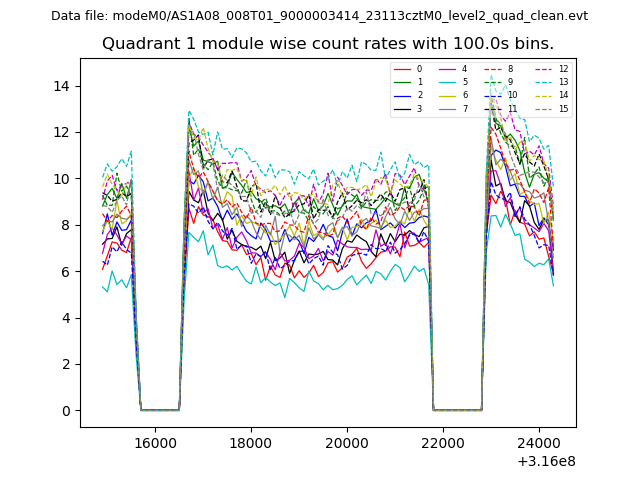
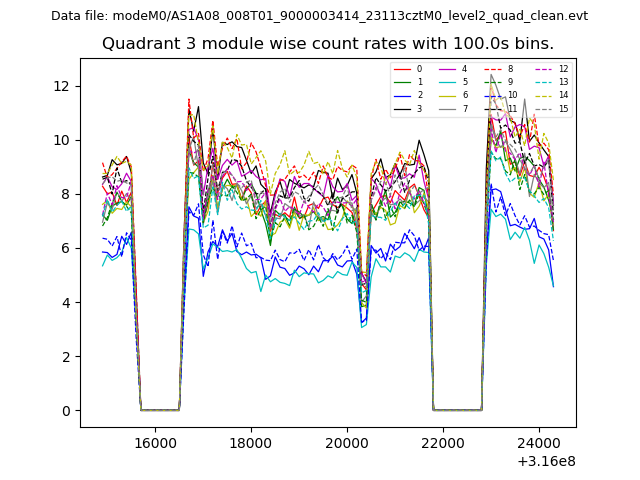
| Module-wise count rates for Quadrant A Data is divided into 100 sec bins |
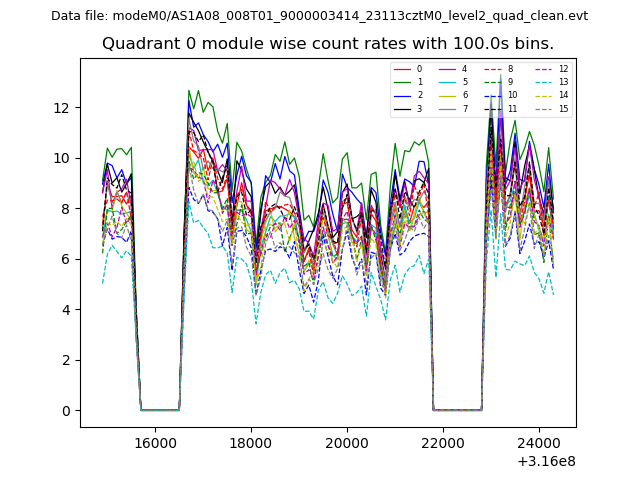 |
 |
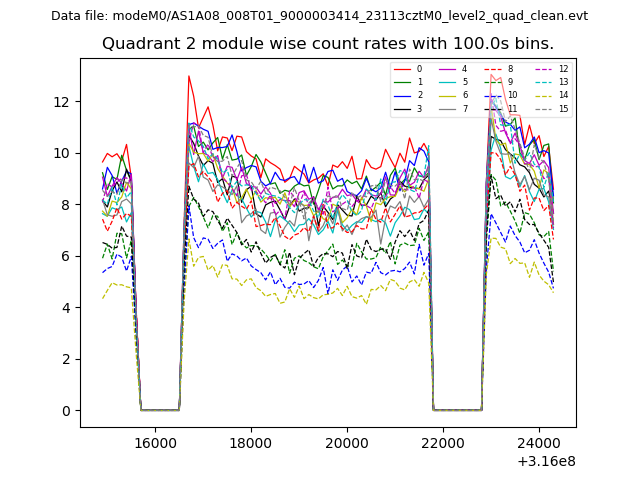
| Module-wise count rates for Quadrant B Data is divided into 100 sec bins |
 |
 |
| Module-wise count rates for Quadrant C Data is divided into 100 sec bins |
 |
 |
| Module-wise count rates for Quadrant D Data is divided into 100 sec bins |
 |
 |
| Parameter | Plot |
|---|---|
| CZT HV Monitor | 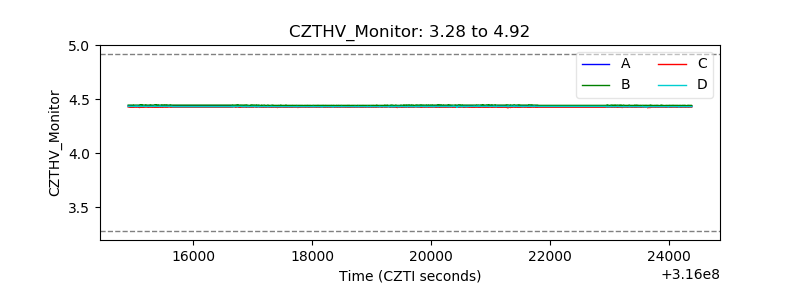 |
| D_VDD | 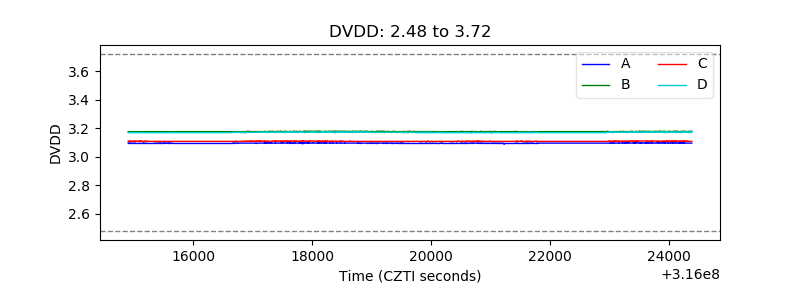 |
| Temperature 1 | 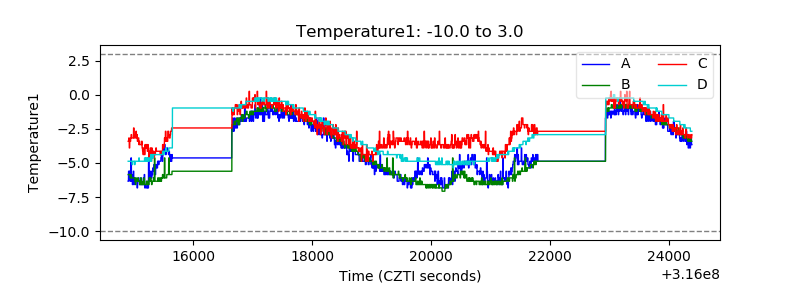 |
| Veto HV Monitor |  |
| Veto LLD | 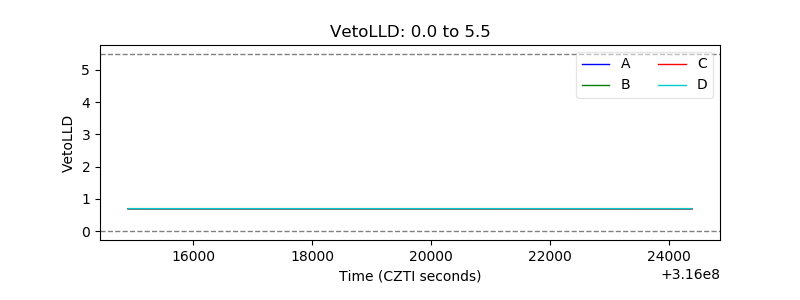 |
| Alpha Counter | 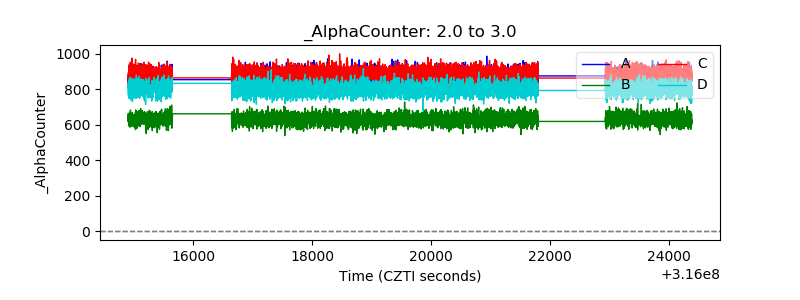 |
| _CPM_Rate | 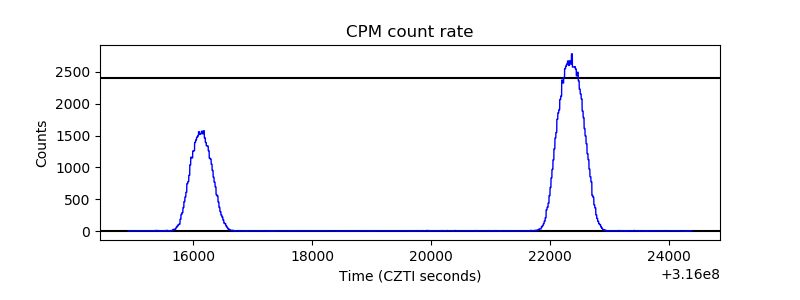 |
| CZT Counter | 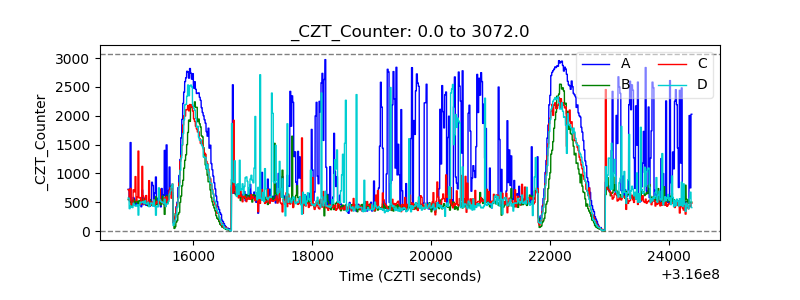 |
| +2.5 Volts monitor |  |
| +5 Volts monitor |  |
| _ROLL_ROT | 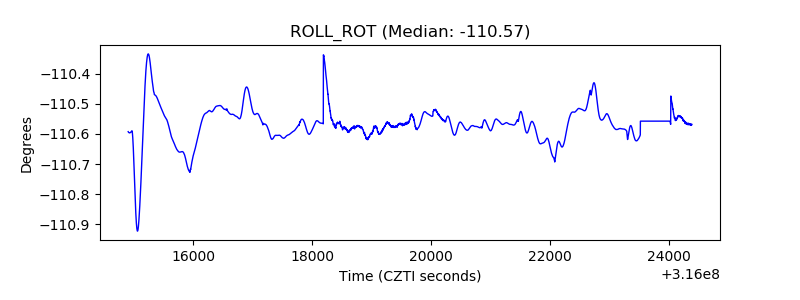 |
| _Roll_DEC | 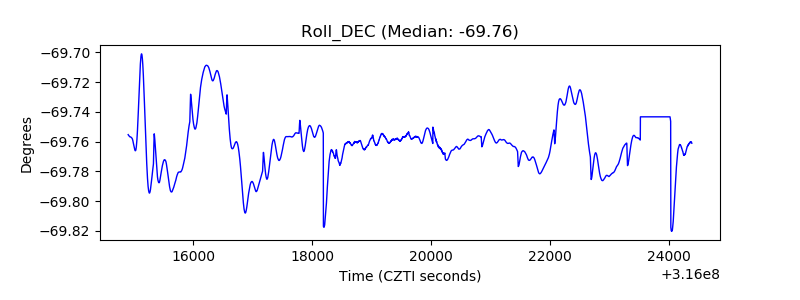 |
| _Roll_RA | 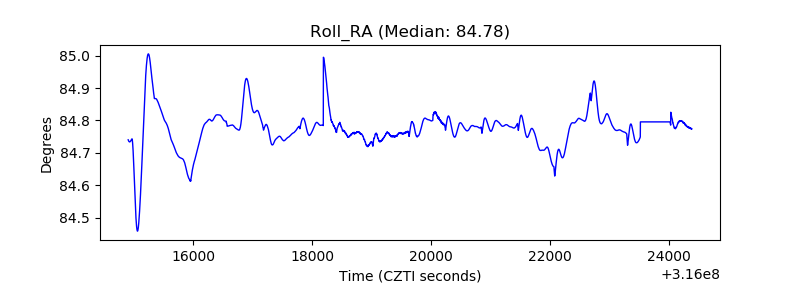 |
| Veto Counter | 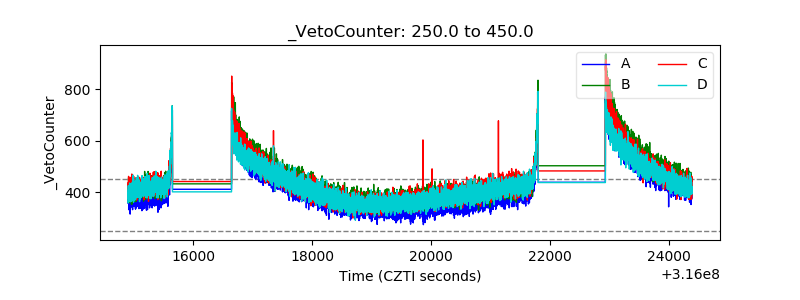 |