| Param | Original file | Final file |
|---|---|---|
| Filename | modeM0/AS1A08_008T01_9000003414_23114cztM0_level2.evt | modeM0/AS1A08_008T01_9000003414_23114cztM0_level2_quad_clean.evt |
| Size (bytes) | 488,269,440 | 120,035,520 |
| Size | 465.7 MB | 114.5 MB |
| Events in quadrant A | 4,850,397 | 802,825 |
| Events in quadrant B | 3,252,656 | 851,202 |
| Events in quadrant C | 2,866,213 | 797,927 |
| Events in quadrant D | 3,418,301 | 772,125 |
| Mode M0 | |||
|---|---|---|---|
| Quadrant | BADHDUFLAG | Total packets | Discarded packets |
| A | 0 | 18361 | 1 |
| B | 0 | 13496 | 1 |
| C | 0 | 12385 | 1 |
| D | 0 | 14230 | 1 |
| Mode M9 | |||
|---|---|---|---|
| Quadrant | BADHDUFLAG | Total packets | Discarded packets |
| A | 0 | 13 | 0 |
| B | 0 | 13 | 0 |
| C | 0 | 13 | 0 |
| D | 0 | 13 | 0 |
| Mode SS | |||
|---|---|---|---|
| Quadrant | BADHDUFLAG | Total packets | Discarded packets |
| A | 0 | 118 | 0 |
| B | 0 | 118 | 0 |
| C | 0 | 118 | 0 |
| D | 0 | 118 | 0 |
| Quadrant | Total seconds | Saturated seconds | Saturation percentage |
|---|---|---|---|
| A | 5891 | 610 | 10.354778% |
| B | 5892 | 168 | 2.851324% |
| C | 5892 | 64 | 1.086219% |
| D | 5892 | 104 | 1.765105% |
Noise dominated data is calculated using 1-second bins in cleaned event files. If a bin has >2000 counts, and if more than 50% of those come from <1% of pixels, then it is considered to be noise-dominated and hence unusable.
| Quadrant | # 1 sec bins | Bins with >0 counts | Bins with >2000 counts | High rate bins dominated by noise | Noise dominated (total time) | Noise dominated (detector-on time) | Marked lightcurve |
|---|---|---|---|---|---|---|---|
| A | 7151 | 5892 | 497 | 497 | 6.95% | 8.44% | 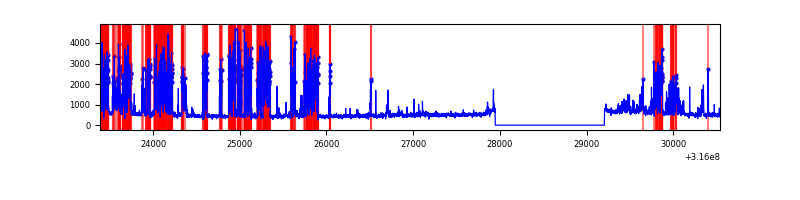 |
| B | 7152 | 5893 | 85 | 85 | 1.19% | 1.44% | 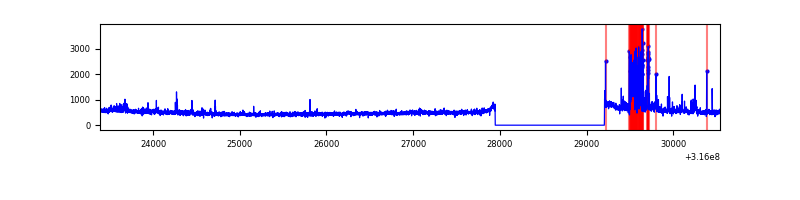 |
| C | 7152 | 5893 | 2 | 2 | 0.03% | 0.03% | 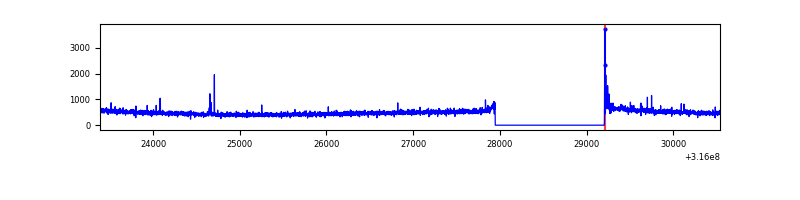 |
| D | 7152 | 5893 | 74 | 74 | 1.03% | 1.26% | 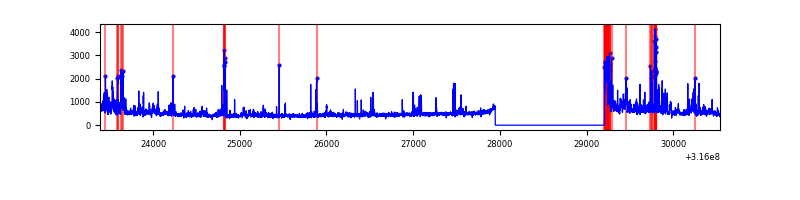 |
Top three noisy pixels from each quadrant. If the there are fewer than three noisy pixels in the level2.evt file, extra rows are filled as -1
| Pixel properties | Quadrant properties | ||||||
|---|---|---|---|---|---|---|---|
| Quadrant | DetID | PixID | Counts | Sigma | Mean | Median | Sigma |
| A | 6 | 16 | 2112394 | 14941.54 | 710 | 697 | 141.3 |
| A | 13 | 254 | 9327 | 61.06 | 710 | 697 | 141.3 |
| A | 0 | 226 | 6274 | 39.46 | 710 | 697 | 141.3 |
| B | 0 | 189 | 265053 | 1929.8 | 730 | 712 | 137.0 |
| B | 0 | 190 | 76901 | 556.21 | 730 | 712 | 137.0 |
| B | 0 | 228 | 27437 | 195.1 | 730 | 712 | 137.0 |
| C | 14 | 238 | 113426 | 708.36 | 689 | 693 | 159.1 |
| C | 0 | 207 | 26013 | 159.1 | 689 | 693 | 159.1 |
| C | 0 | 10 | 18692 | 113.1 | 689 | 693 | 159.1 |
| D | 1 | 239 | 322973 | 1922.47 | 692 | 672 | 167.6 |
| D | 12 | 233 | 256786 | 1527.68 | 692 | 672 | 167.6 |
| D | 1 | 52 | 63191 | 372.92 | 692 | 672 | 167.6 |
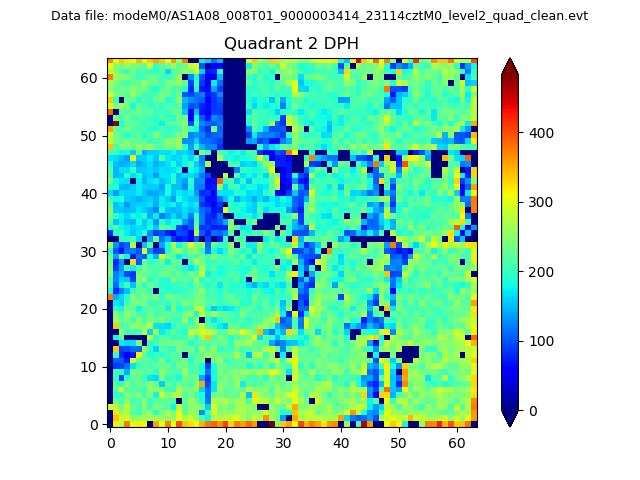
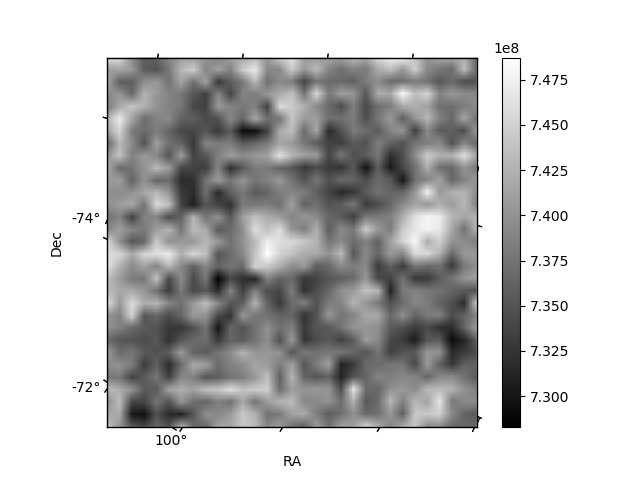
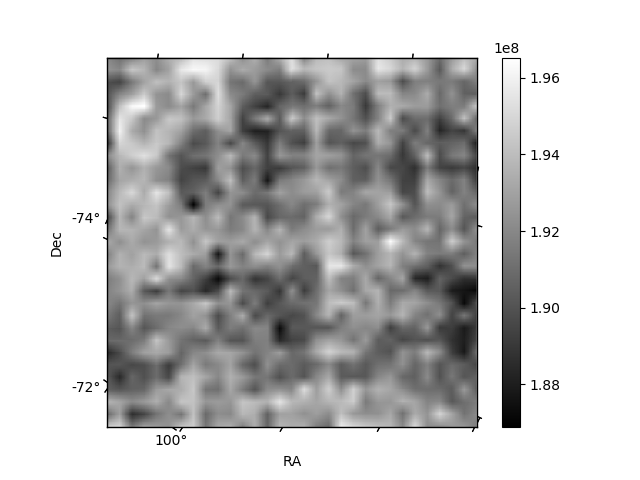
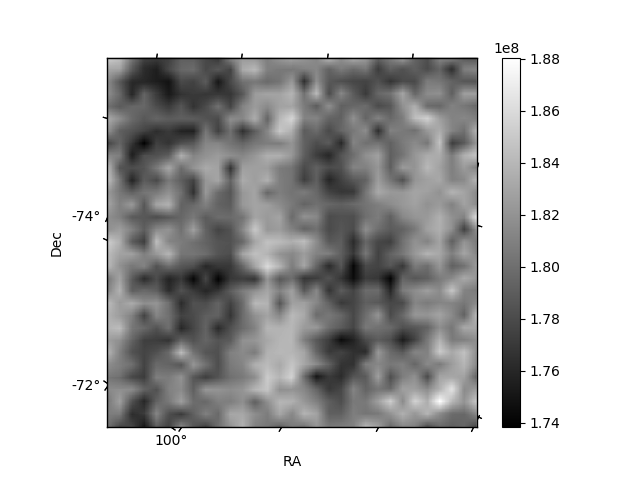
Histogram calculated using DETX and DETY for each event in the final _common_clean file
| Quadrant A | 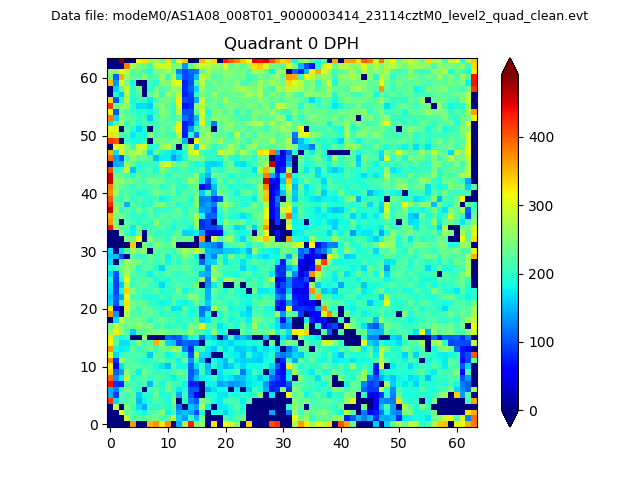 |
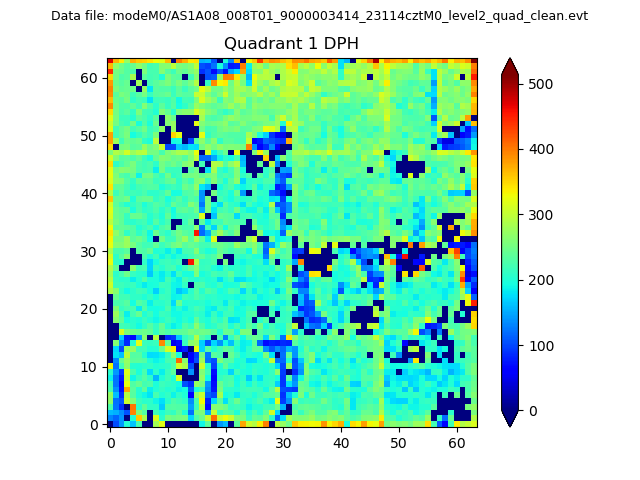 |
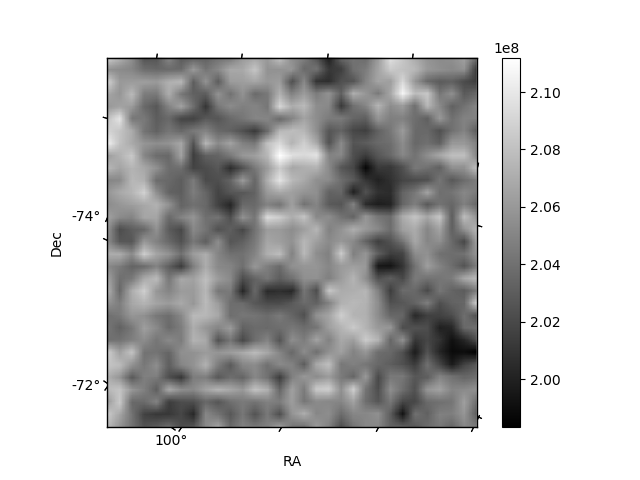
Quadrant B |
|---|---|---|---|
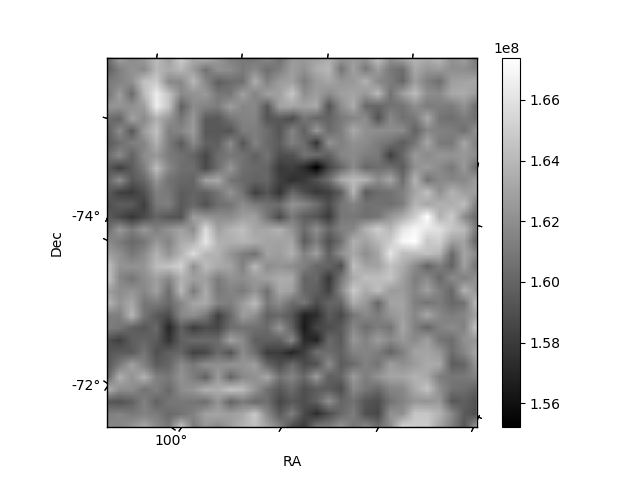
| Quadrant D | 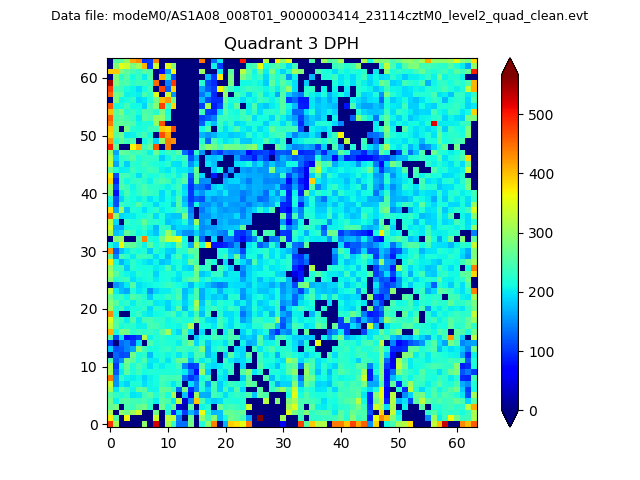 |
 |
Quadrant C |
| Plot type | Count rate plots | Images |
|---|---|---|
| Comparison with Poisson distribution Blue bars denote a histogram of data divided into 1 sec bins. Red curve is a Poisson curve with rate = median count rate of data. |
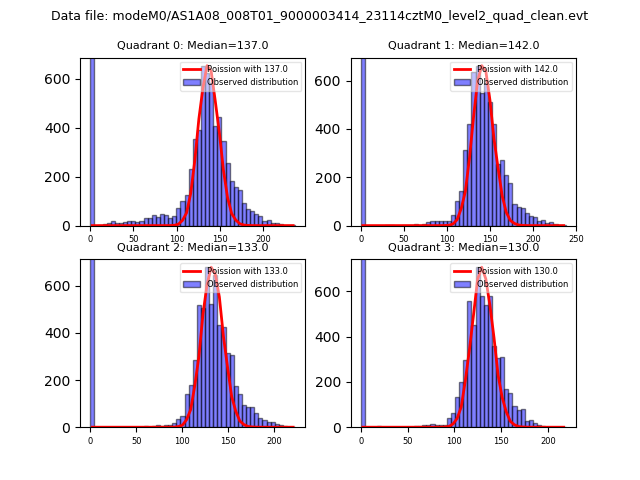 |
 |
| Quadrant-wise count rates Data is divided into 100 sec bins |
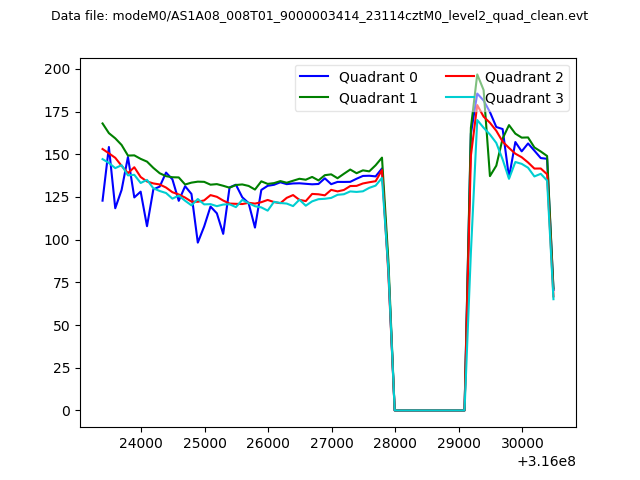 |
|
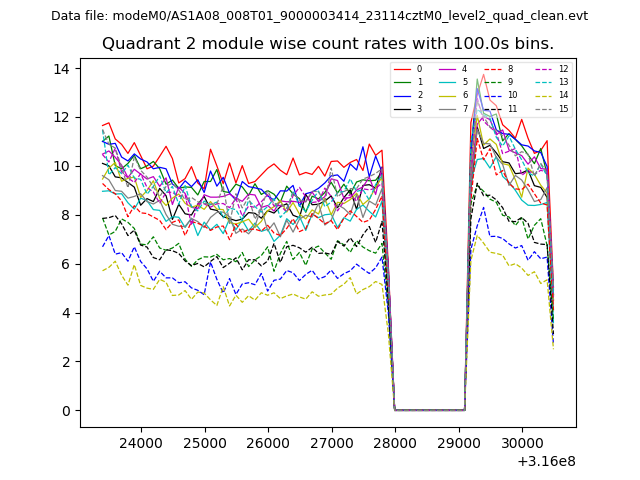
| Module-wise count rates for Quadrant A Data is divided into 100 sec bins |
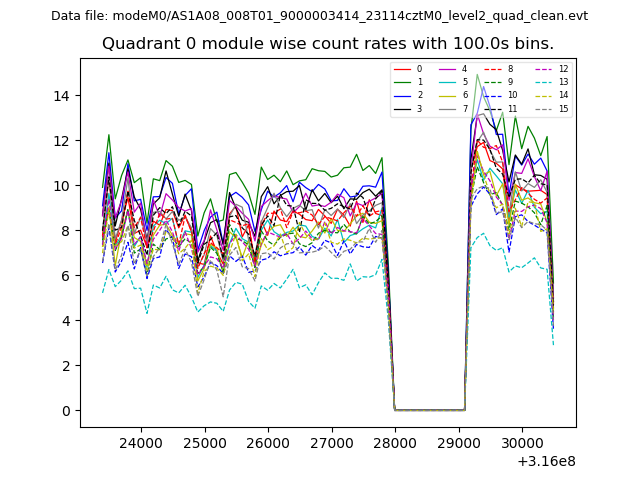 |
 |
| Module-wise count rates for Quadrant B Data is divided into 100 sec bins |
 |
 |
| Module-wise count rates for Quadrant C Data is divided into 100 sec bins |
 |
 |
| Module-wise count rates for Quadrant D Data is divided into 100 sec bins |
 |
 |
| Parameter | Plot |
|---|---|
| CZT HV Monitor | 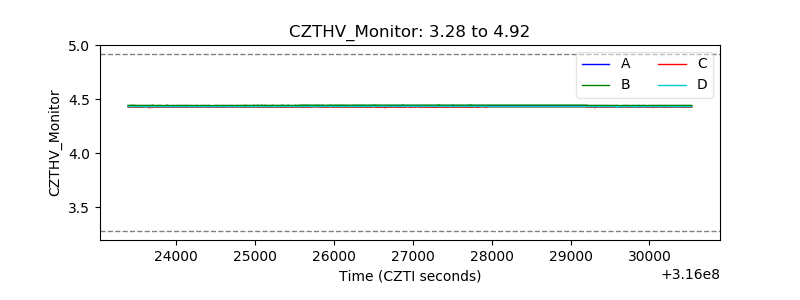 |
| D_VDD | 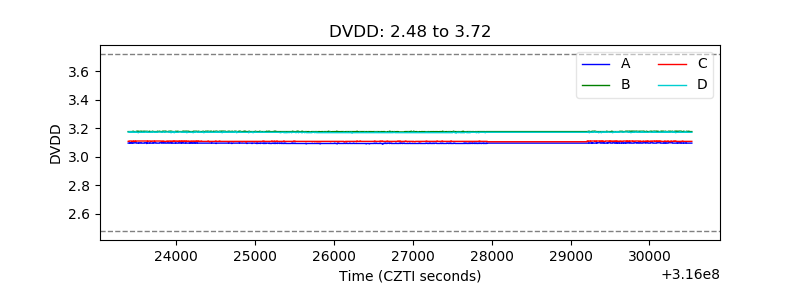 |
| Temperature 1 | 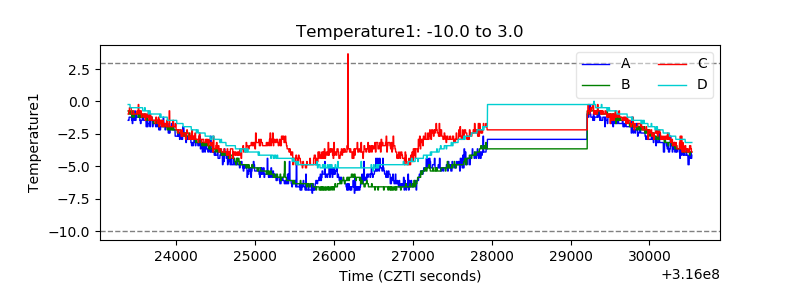 |
| Veto HV Monitor | 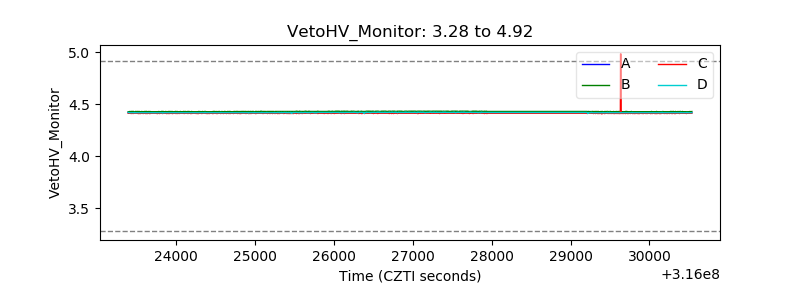 |
| Veto LLD |  |
| Alpha Counter | 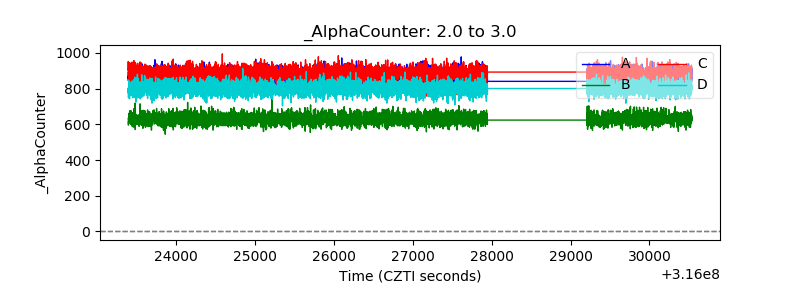 |
| _CPM_Rate | 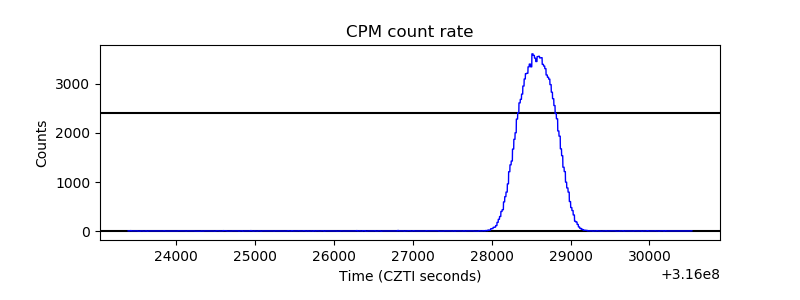 |
| CZT Counter | 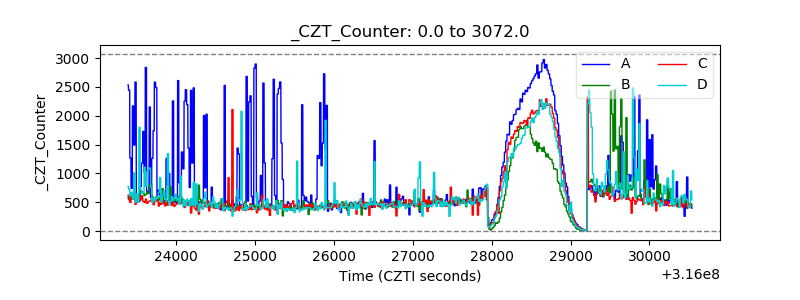 |
| +2.5 Volts monitor |  |
| +5 Volts monitor |  |
| _ROLL_ROT | 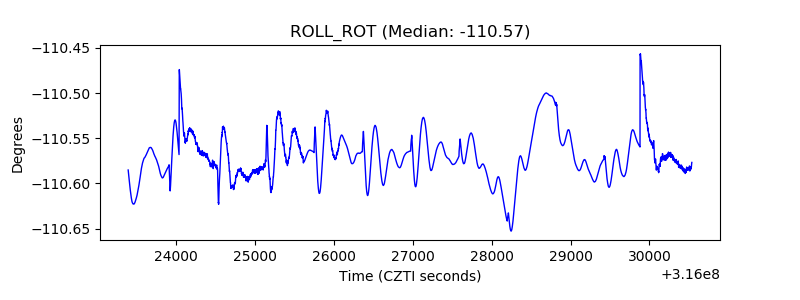 |
| _Roll_DEC | 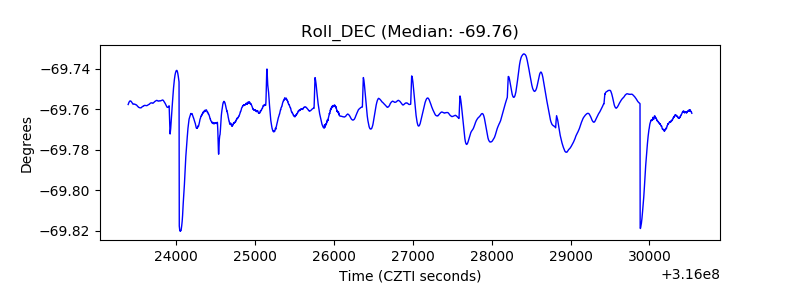 |
| _Roll_RA | 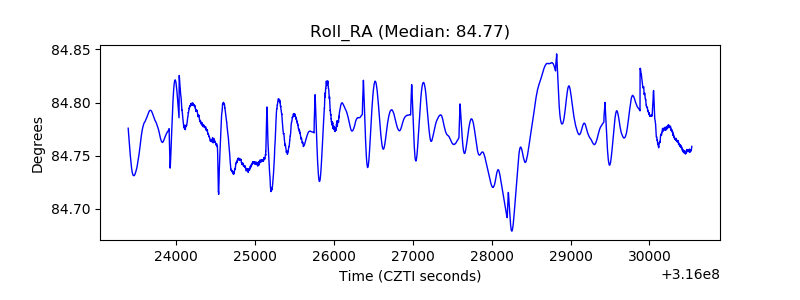 |
| Veto Counter |  |