| Param | Original file | Final file |
|---|---|---|
| Filename | modeM0/AS1A08_008T01_9000003414_23116cztM0_level2.evt | modeM0/AS1A08_008T01_9000003414_23116cztM0_level2_quad_clean.evt |
| Size (bytes) | 544,596,480 | 128,730,240 |
| Size | 519.4 MB | 122.8 MB |
| Events in quadrant A | 5,378,992 | 828,779 |
| Events in quadrant B | 3,223,931 | 941,829 |
| Events in quadrant C | 3,106,458 | 877,984 |
| Events in quadrant D | 4,368,956 | 822,825 |
| Mode M0 | |||
|---|---|---|---|
| Quadrant | BADHDUFLAG | Total packets | Discarded packets |
| A | 0 | 19958 | 2 |
| B | 0 | 13489 | 2 |
| C | 0 | 13079 | 2 |
| D | 0 | 17131 | 2 |
| Mode M9 | |||
|---|---|---|---|
| Quadrant | BADHDUFLAG | Total packets | Discarded packets |
| A | 0 | 15 | 0 |
| B | 0 | 16 | 0 |
| C | 0 | 16 | 0 |
| D | 0 | 16 | 0 |
| Mode SS | |||
|---|---|---|---|
| Quadrant | BADHDUFLAG | Total packets | Discarded packets |
| A | 0 | 124 | 0 |
| B | 0 | 124 | 0 |
| C | 0 | 124 | 0 |
| D | 0 | 124 | 0 |
| Quadrant | Total seconds | Saturated seconds | Saturation percentage |
|---|---|---|---|
| A | 6119 | 924 | 15.100507% |
| B | 6119 | 49 | 0.800784% |
| C | 6119 | 59 | 0.964210% |
| D | 6119 | 325 | 5.311325% |
Noise dominated data is calculated using 1-second bins in cleaned event files. If a bin has >2000 counts, and if more than 50% of those come from <1% of pixels, then it is considered to be noise-dominated and hence unusable.
| Quadrant | # 1 sec bins | Bins with >0 counts | Bins with >2000 counts | High rate bins dominated by noise | Noise dominated (total time) | Noise dominated (detector-on time) | Marked lightcurve |
|---|---|---|---|---|---|---|---|
| A | 7519 | 6120 | 756 | 756 | 10.05% | 12.35% | 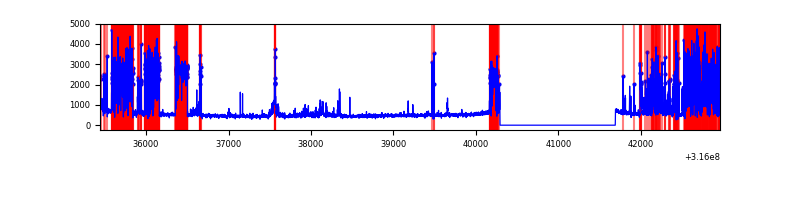 |
| B | 7519 | 6120 | 2 | 2 | 0.03% | 0.03% | 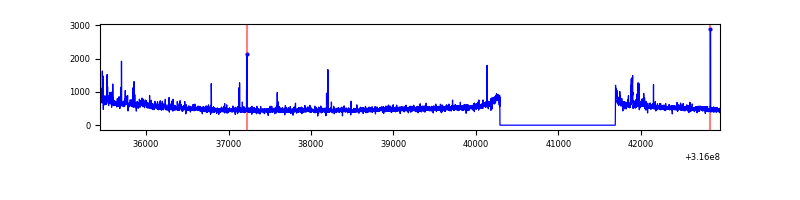 |
| C | 7519 | 6120 | 3 | 3 | 0.04% | 0.05% | 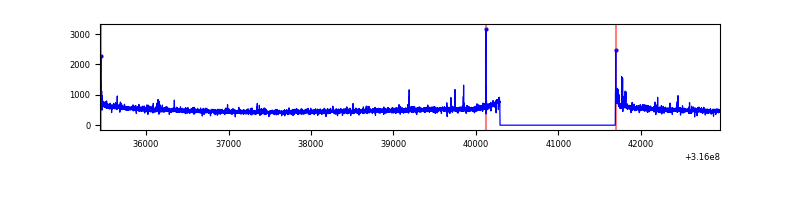 |
| D | 7519 | 6120 | 256 | 256 | 3.40% | 4.18% | 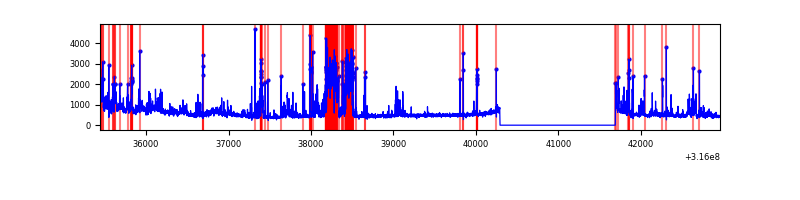 |
Top three noisy pixels from each quadrant. If the there are fewer than three noisy pixels in the level2.evt file, extra rows are filled as -1
| Pixel properties | Quadrant properties | ||||||
|---|---|---|---|---|---|---|---|
| Quadrant | DetID | PixID | Counts | Sigma | Mean | Median | Sigma |
| A | 6 | 16 | 2596172 | 17930.68 | 722 | 709 | 144.7 |
| A | 13 | 254 | 10124 | 65.04 | 722 | 709 | 144.7 |
| A | 0 | 226 | 6311 | 38.7 | 722 | 709 | 144.7 |
| B | 0 | 190 | 47338 | 320.83 | 789 | 771 | 145.1 |
| B | 0 | 189 | 24809 | 165.61 | 789 | 771 | 145.1 |
| B | 0 | 245 | 23844 | 158.96 | 789 | 771 | 145.1 |
| C | 14 | 238 | 121424 | 705.08 | 745 | 751 | 171.1 |
| C | 0 | 207 | 26048 | 147.81 | 745 | 751 | 171.1 |
| C | 0 | 10 | 25826 | 146.51 | 745 | 751 | 171.1 |
| D | 12 | 233 | 1063984 | 6002.0 | 731 | 710 | 177.2 |
| D | 1 | 239 | 226433 | 1274.17 | 731 | 710 | 177.2 |
| D | 1 | 52 | 129572 | 727.4 | 731 | 710 | 177.2 |
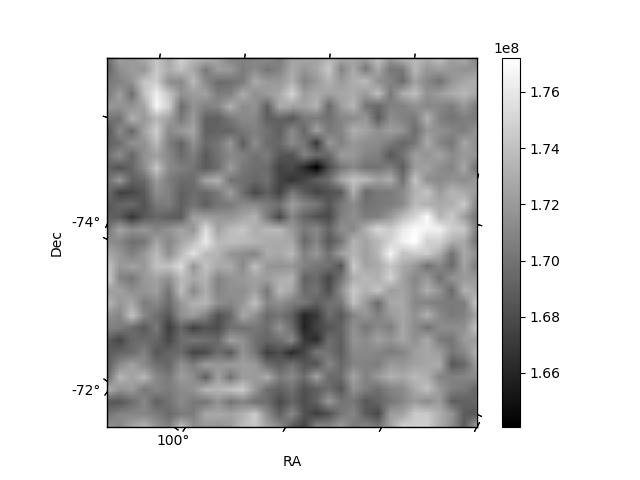
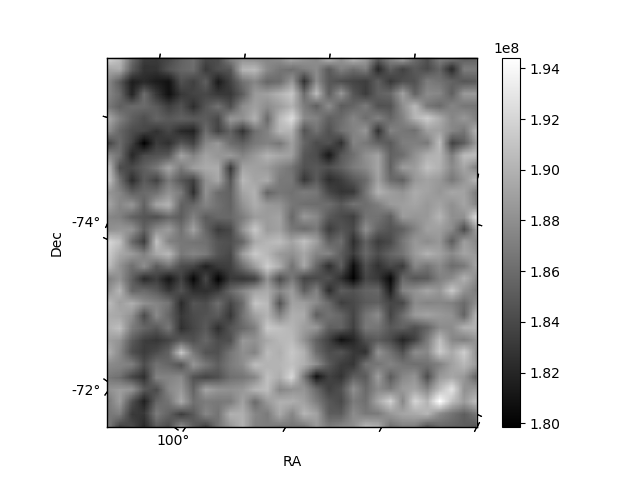
Histogram calculated using DETX and DETY for each event in the final _common_clean file
| Quadrant A | 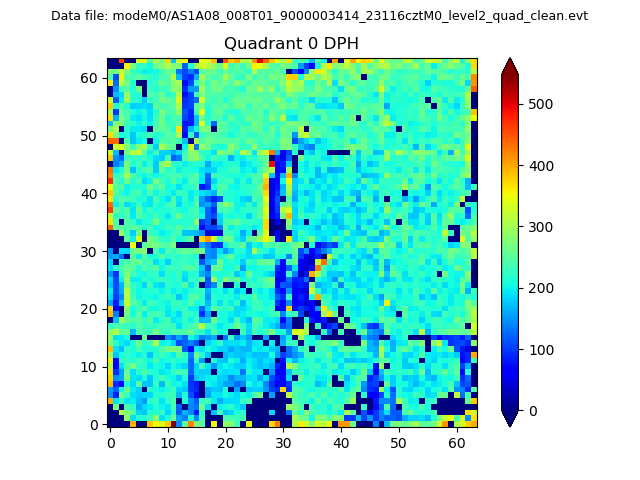 |
 |
Quadrant B |
|---|---|---|---|
| Quadrant D |  |
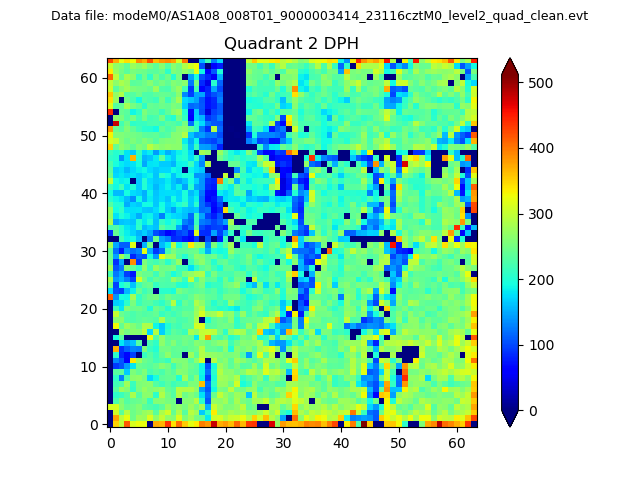 |
Quadrant C |
| Plot type | Count rate plots | Images |
|---|---|---|
| Comparison with Poisson distribution Blue bars denote a histogram of data divided into 1 sec bins. Red curve is a Poisson curve with rate = median count rate of data. |
 |
 |
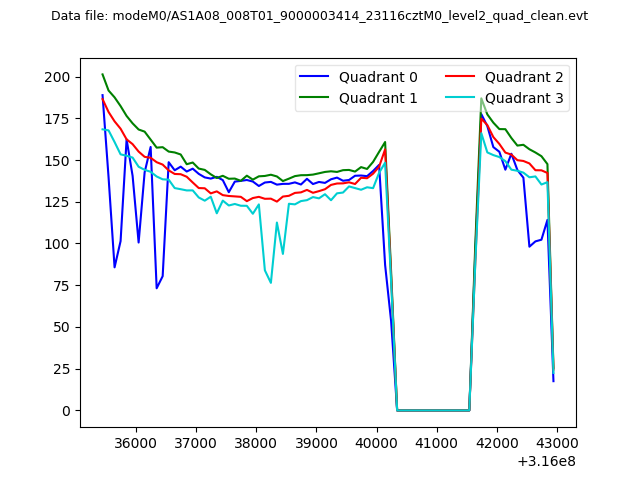
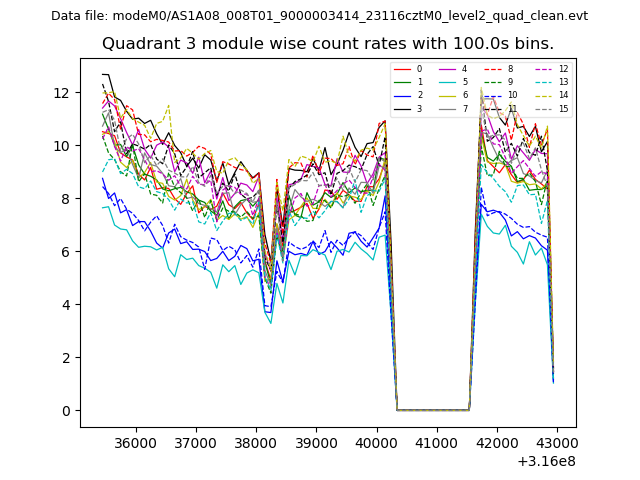
| Quadrant-wise count rates Data is divided into 100 sec bins |
 |
|
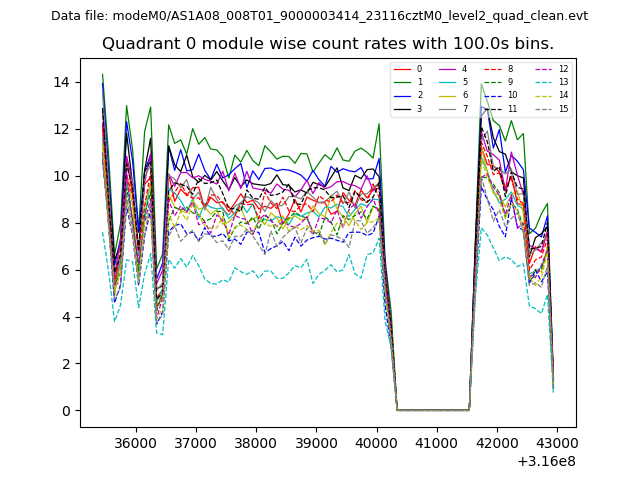
| Module-wise count rates for Quadrant A Data is divided into 100 sec bins |
 |
 |
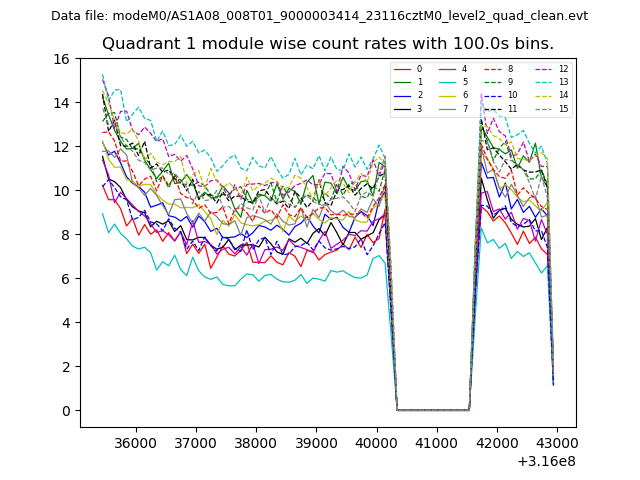
| Module-wise count rates for Quadrant B Data is divided into 100 sec bins |
 |
 |
| Module-wise count rates for Quadrant C Data is divided into 100 sec bins |
 |
 |
| Module-wise count rates for Quadrant D Data is divided into 100 sec bins |
 |
 |
| Parameter | Plot |
|---|---|
| CZT HV Monitor |  |
| D_VDD | 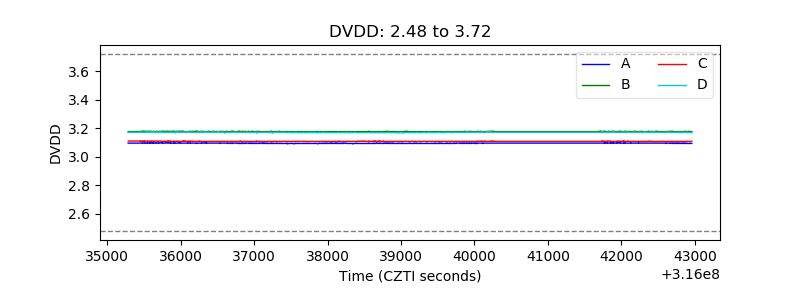 |
| Temperature 1 | 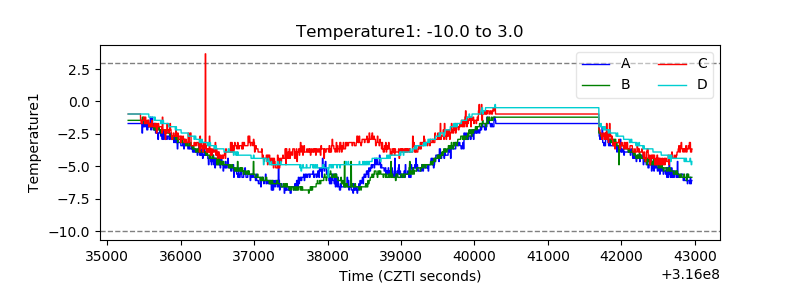 |
| Veto HV Monitor | 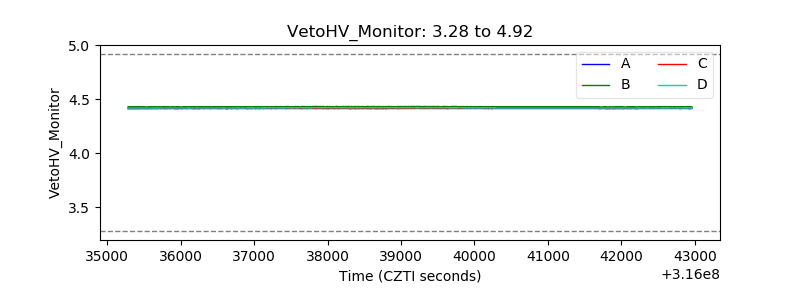 |
| Veto LLD | 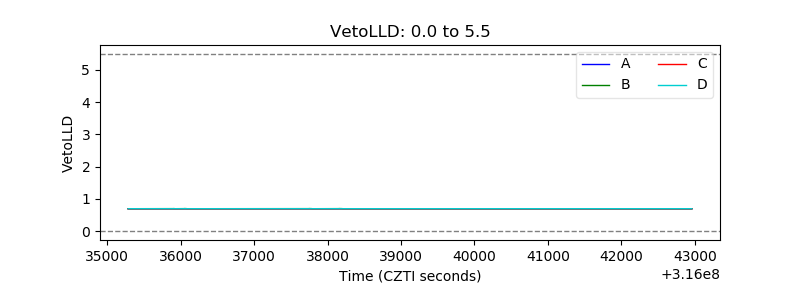 |
| Alpha Counter | 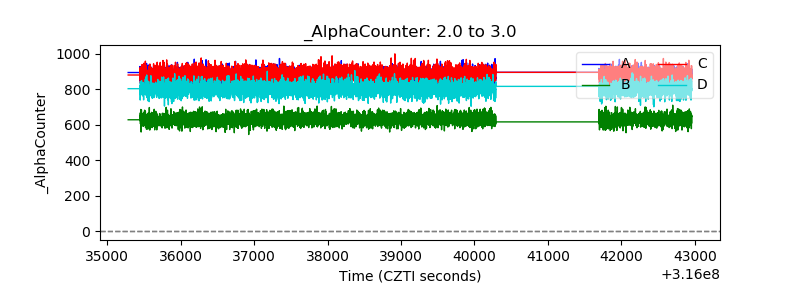 |
| _CPM_Rate | 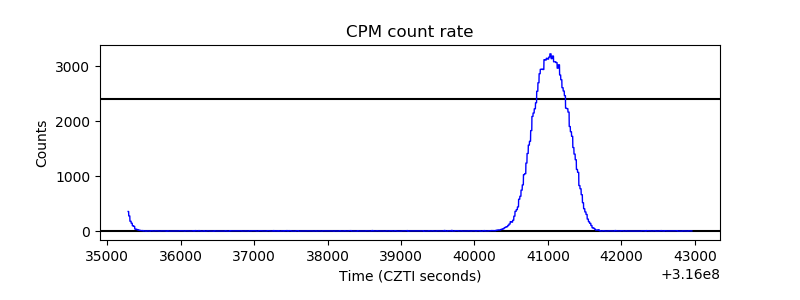 |
| CZT Counter | 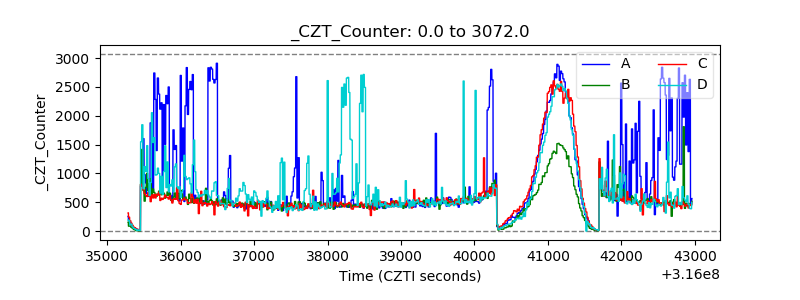 |
| +2.5 Volts monitor |  |
| +5 Volts monitor |  |
| _ROLL_ROT | 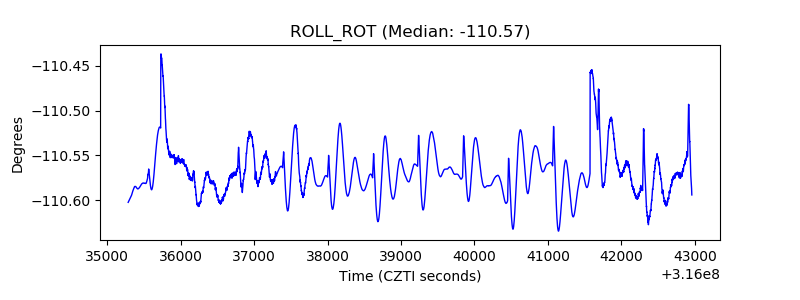 |
| _Roll_DEC | 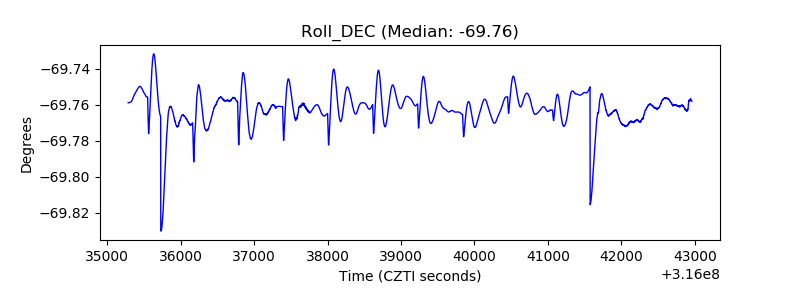 |
| _Roll_RA | 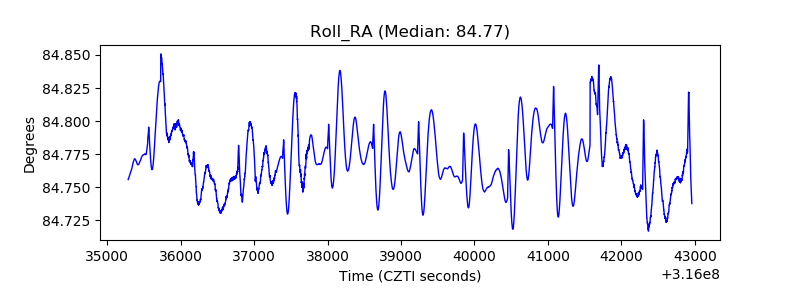 |
| Veto Counter | 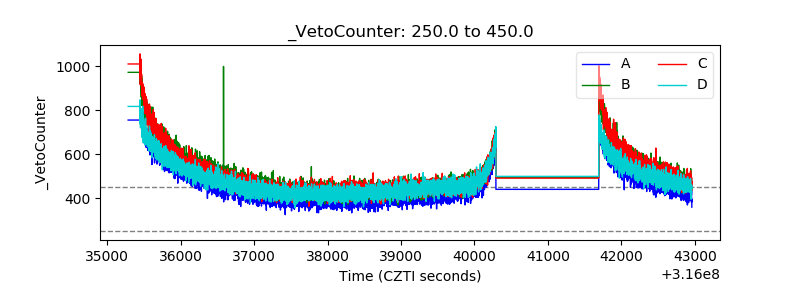 |