| Param | Original file | Final file |
|---|---|---|
| Filename | modeM0/AS1A08_008T01_9000003414_23117cztM0_level2.evt | modeM0/AS1A08_008T01_9000003414_23117cztM0_level2_quad_clean.evt |
| Size (bytes) | 583,819,200 | 126,915,840 |
| Size | 556.8 MB | 121.0 MB |
| Events in quadrant A | 7,416,565 | 787,139 |
| Events in quadrant B | 3,157,601 | 925,291 |
| Events in quadrant C | 3,324,296 | 865,363 |
| Events in quadrant D | 3,360,919 | 831,292 |
| Mode M0 | |||
|---|---|---|---|
| Quadrant | BADHDUFLAG | Total packets | Discarded packets |
| A | 0 | 26185 | 2 |
| B | 0 | 13310 | 2 |
| C | 0 | 13737 | 2 |
| D | 0 | 14244 | 3 |
| Mode M9 | |||
|---|---|---|---|
| Quadrant | BADHDUFLAG | Total packets | Discarded packets |
| A | 0 | 19 | 0 |
| B | 0 | 20 | 0 |
| C | 0 | 20 | 0 |
| D | 0 | 20 | 0 |
| Mode SS | |||
|---|---|---|---|
| Quadrant | BADHDUFLAG | Total packets | Discarded packets |
| A | 0 | 126 | 0 |
| B | 0 | 126 | 0 |
| C | 0 | 126 | 0 |
| D | 0 | 126 | 0 |
| Quadrant | Total seconds | Saturated seconds | Saturation percentage |
|---|---|---|---|
| A | 6225 | 1496 | 24.032129% |
| B | 6225 | 50 | 0.803213% |
| C | 6225 | 100 | 1.606426% |
| D | 6224 | 85 | 1.365681% |
Noise dominated data is calculated using 1-second bins in cleaned event files. If a bin has >2000 counts, and if more than 50% of those come from <1% of pixels, then it is considered to be noise-dominated and hence unusable.
| Quadrant | # 1 sec bins | Bins with >0 counts | Bins with >2000 counts | High rate bins dominated by noise | Noise dominated (total time) | Noise dominated (detector-on time) | Marked lightcurve |
|---|---|---|---|---|---|---|---|
| A | 7585 | 6226 | 1199 | 1199 | 15.81% | 19.26% | 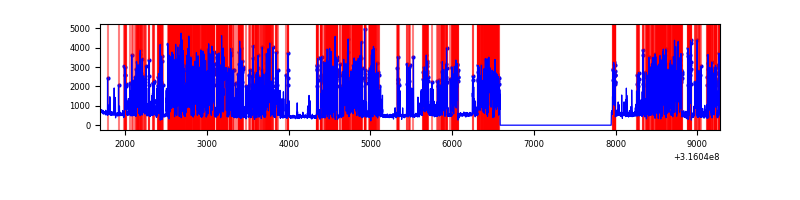 |
| B | 7585 | 6226 | 3 | 3 | 0.04% | 0.05% | 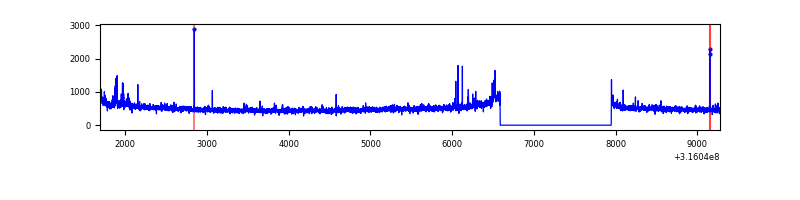 |
| C | 7585 | 6226 | 12 | 12 | 0.16% | 0.19% | 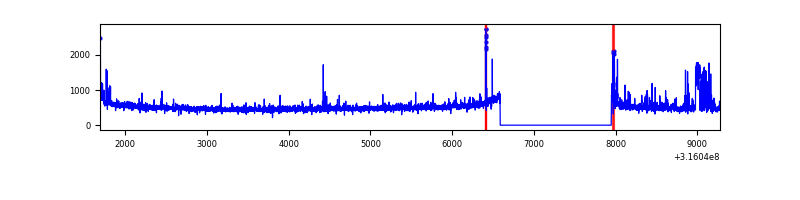 |
| D | 7584 | 6225 | 50 | 50 | 0.66% | 0.80% | 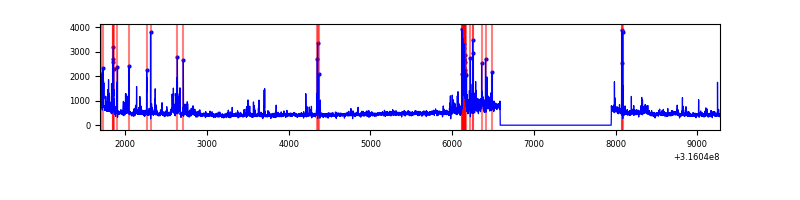 |
Top three noisy pixels from each quadrant. If the there are fewer than three noisy pixels in the level2.evt file, extra rows are filled as -1
| Pixel properties | Quadrant properties | ||||||
|---|---|---|---|---|---|---|---|
| Quadrant | DetID | PixID | Counts | Sigma | Mean | Median | Sigma |
| A | 6 | 16 | 4701957 | 33508.8 | 704 | 691 | 140.3 |
| A | 13 | 254 | 10419 | 69.34 | 704 | 691 | 140.3 |
| A | 0 | 226 | 5966 | 37.6 | 704 | 691 | 140.3 |
| B | 0 | 190 | 40175 | 273.09 | 782 | 763 | 144.3 |
| B | 0 | 189 | 16806 | 111.16 | 782 | 763 | 144.3 |
| B | 12 | 111 | 16593 | 109.69 | 782 | 763 | 144.3 |
| C | 9 | 15 | 159405 | 919.39 | 746 | 753 | 172.6 |
| C | 14 | 238 | 119803 | 689.89 | 746 | 753 | 172.6 |
| C | 2 | 16 | 60568 | 346.63 | 746 | 753 | 172.6 |
| D | 12 | 233 | 200500 | 1122.87 | 740 | 721 | 177.9 |
| D | 1 | 52 | 195629 | 1095.49 | 740 | 721 | 177.9 |
| D | 13 | 153 | 39617 | 218.62 | 740 | 721 | 177.9 |
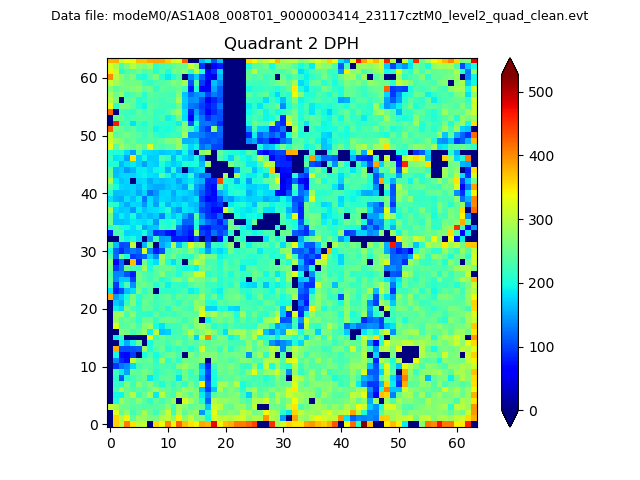
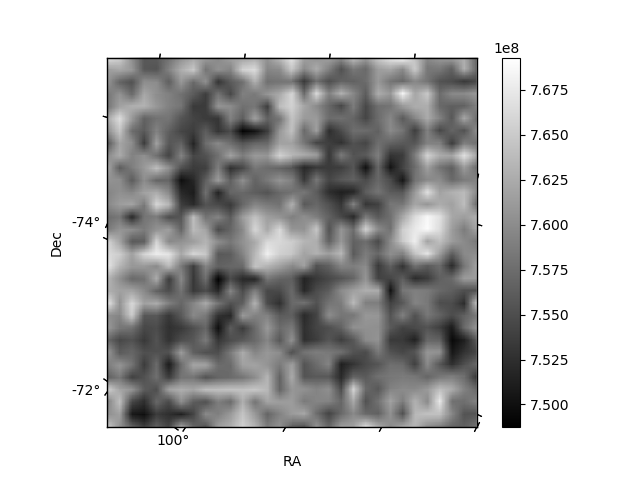
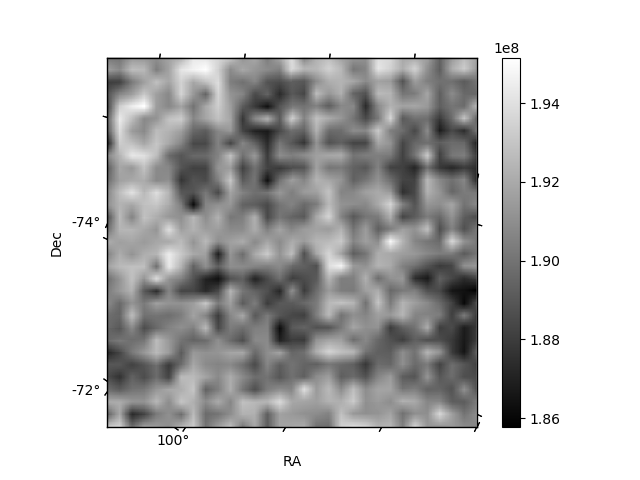
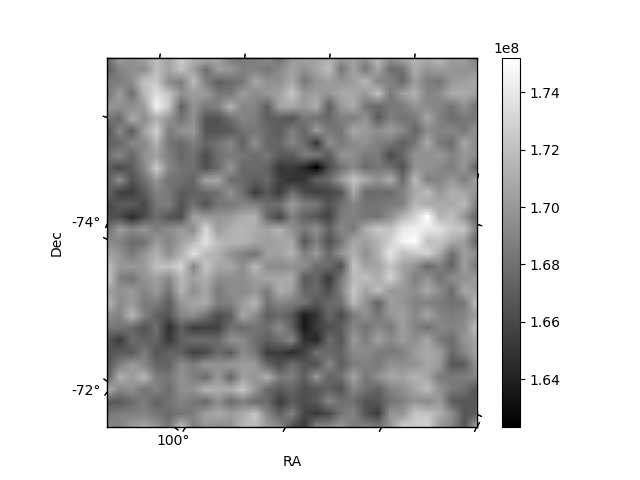
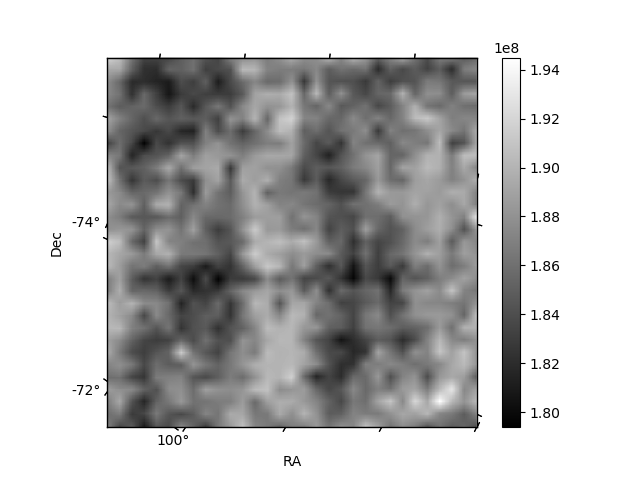
Histogram calculated using DETX and DETY for each event in the final _common_clean file
| Quadrant A | 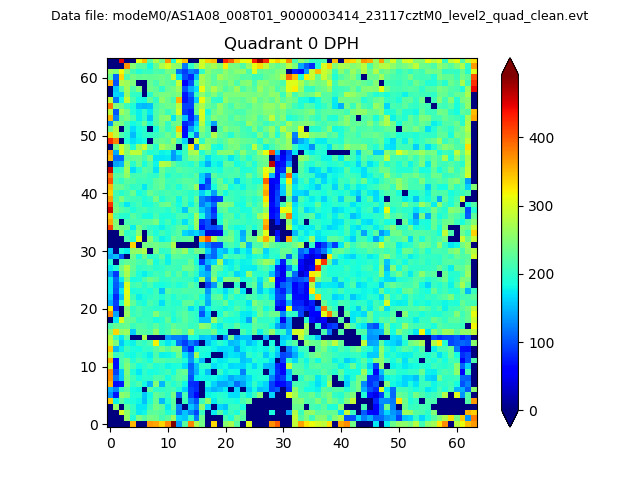 |
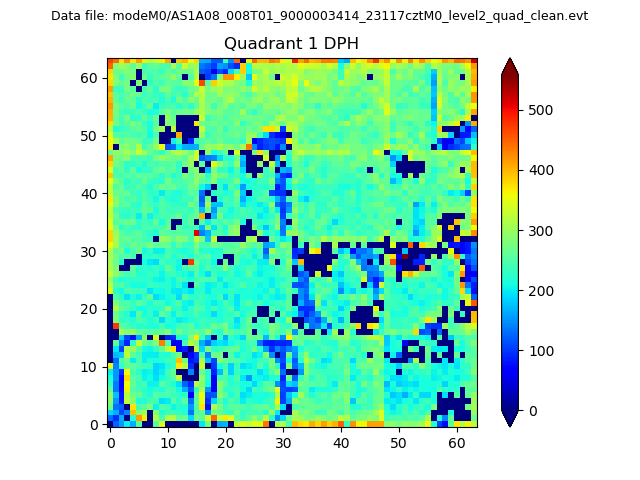 |
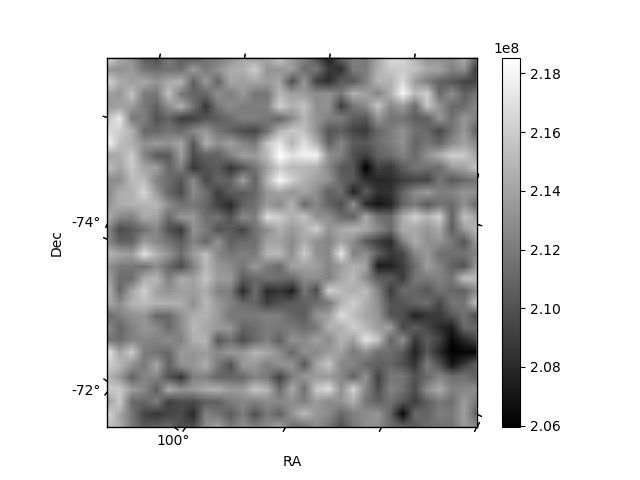
Quadrant B |
|---|---|---|---|
| Quadrant D | 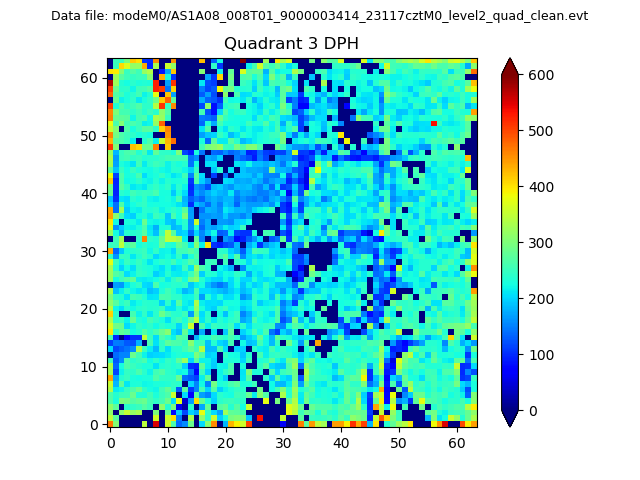 |
 |
Quadrant C |
| Plot type | Count rate plots | Images |
|---|---|---|
| Comparison with Poisson distribution Blue bars denote a histogram of data divided into 1 sec bins. Red curve is a Poisson curve with rate = median count rate of data. |
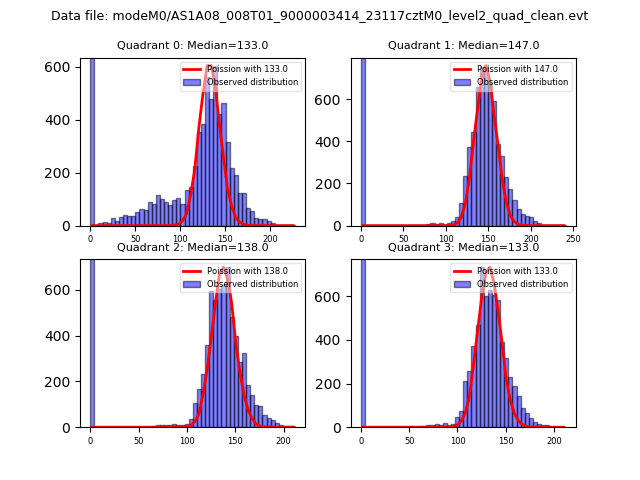 |
 |
| Quadrant-wise count rates Data is divided into 100 sec bins |
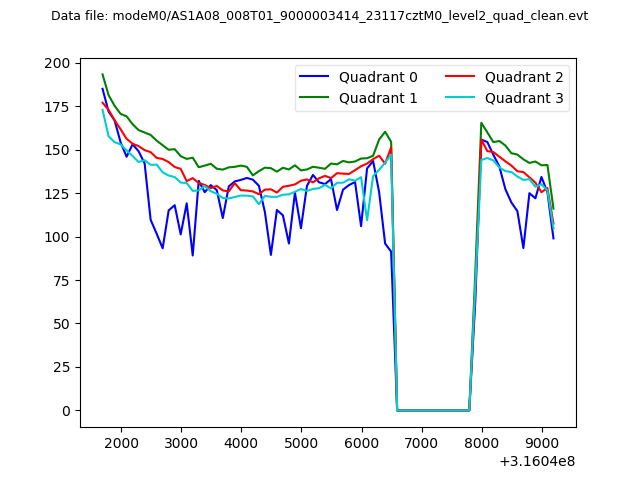 |
|
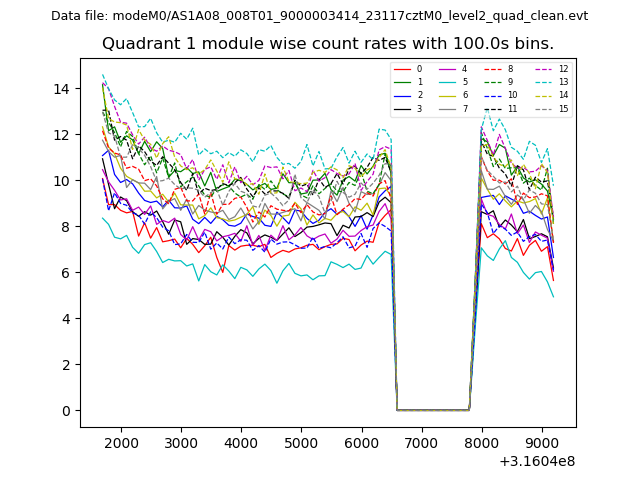
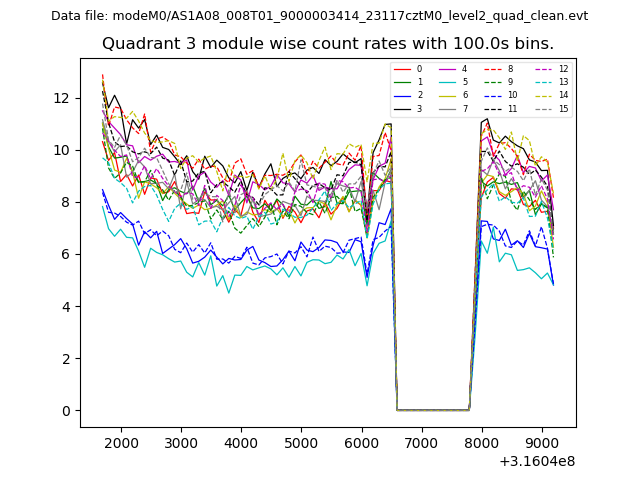
| Module-wise count rates for Quadrant A Data is divided into 100 sec bins |
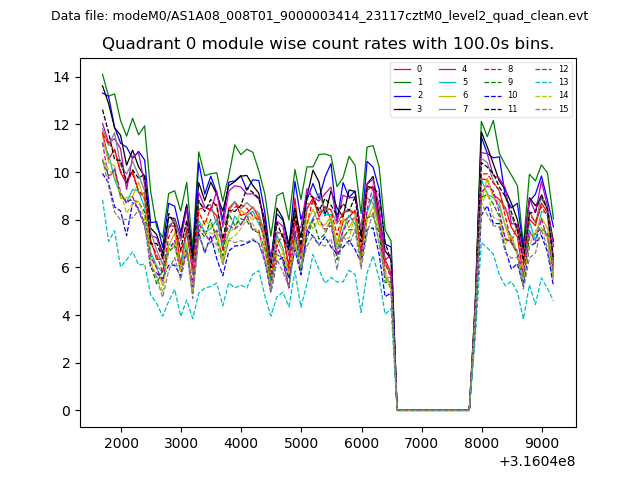 |
 |
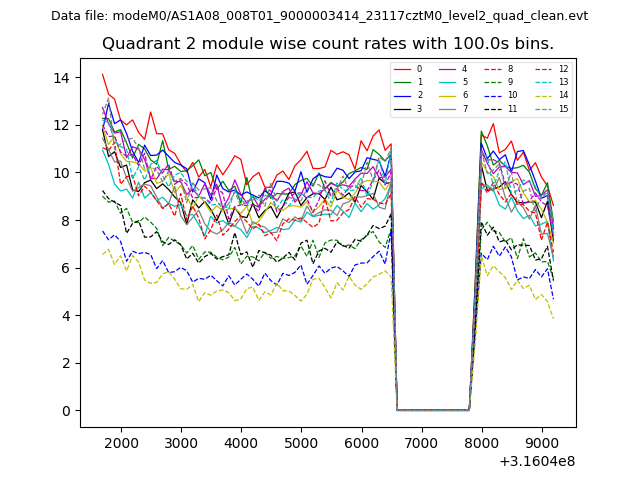
| Module-wise count rates for Quadrant B Data is divided into 100 sec bins |
 |
 |
| Module-wise count rates for Quadrant C Data is divided into 100 sec bins |
 |
 |
| Module-wise count rates for Quadrant D Data is divided into 100 sec bins |
 |
 |
| Parameter | Plot |
|---|---|
| CZT HV Monitor | 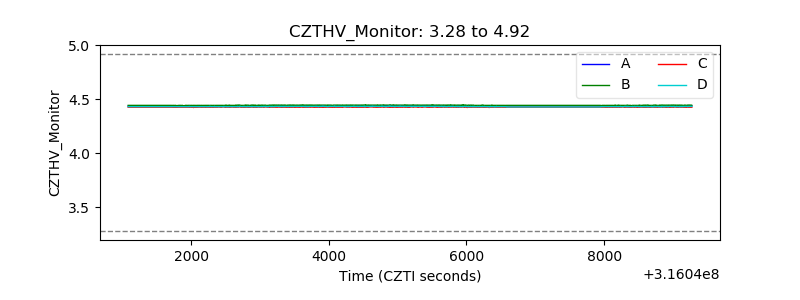 |
| D_VDD | 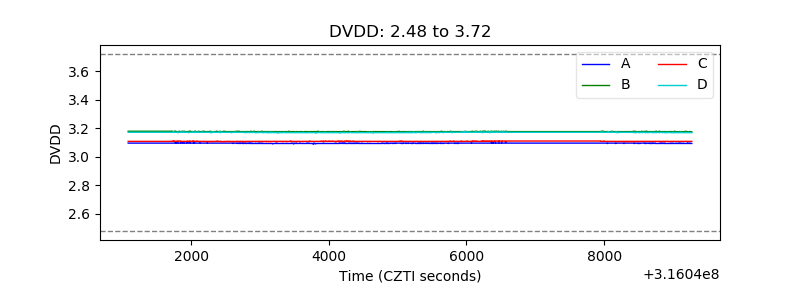 |
| Temperature 1 | 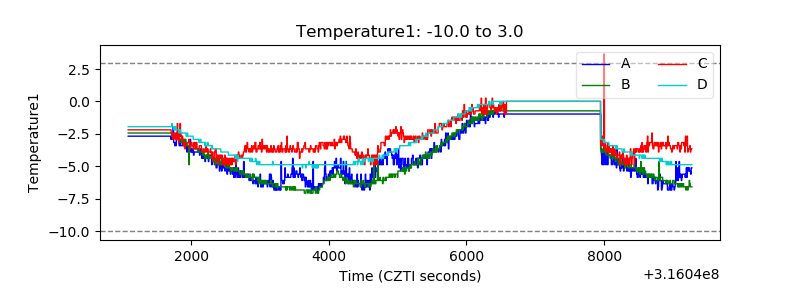 |
| Veto HV Monitor | 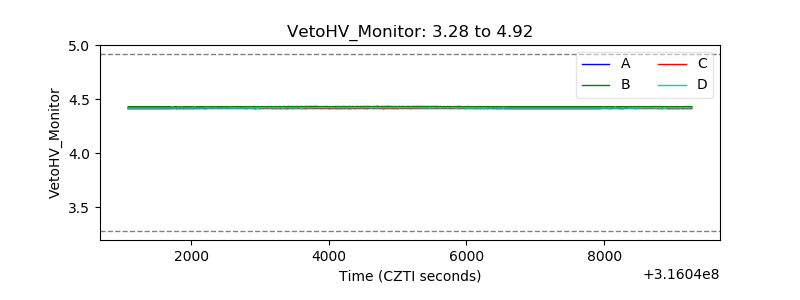 |
| Veto LLD | 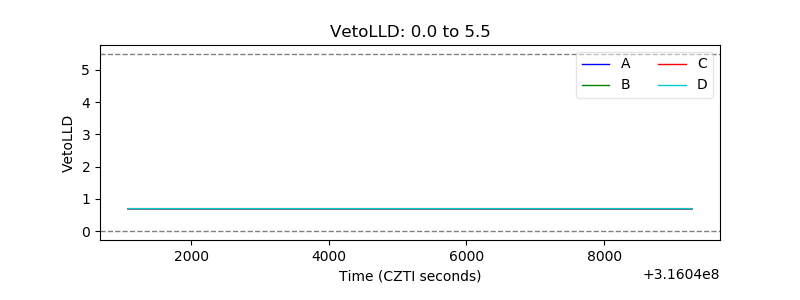 |
| Alpha Counter | 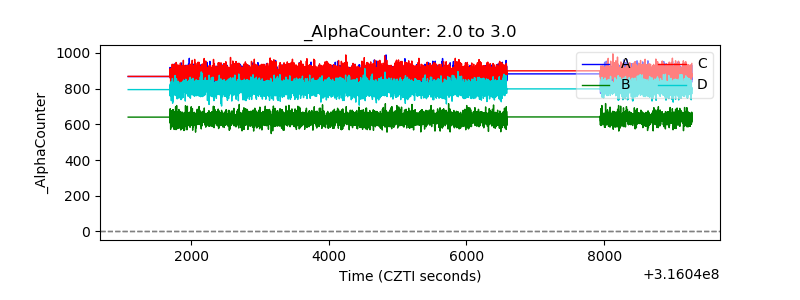 |
| _CPM_Rate | 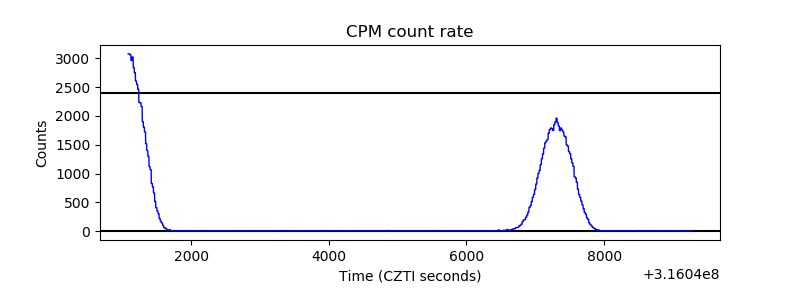 |
| CZT Counter | 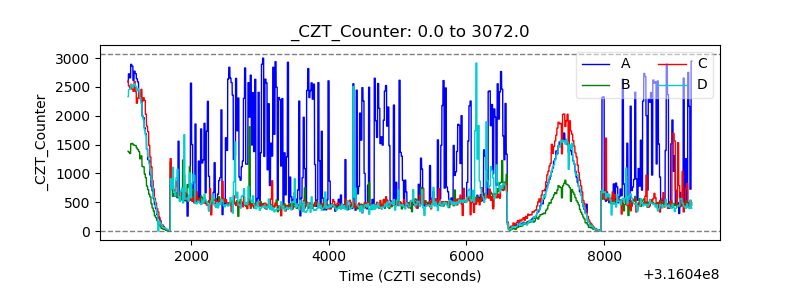 |
| +2.5 Volts monitor |  |
| +5 Volts monitor |  |
| _ROLL_ROT | 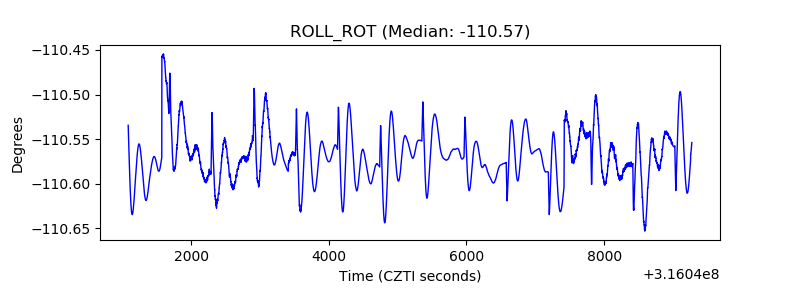 |
| _Roll_DEC | 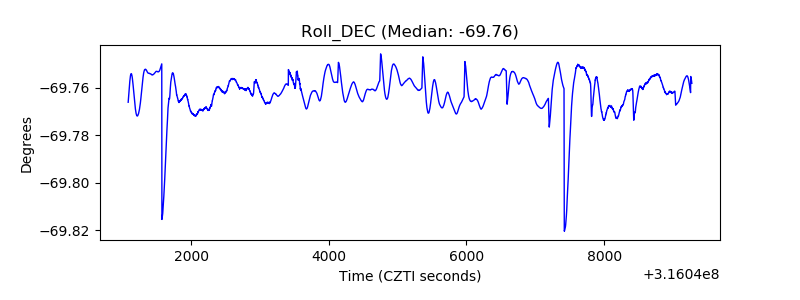 |
| _Roll_RA | 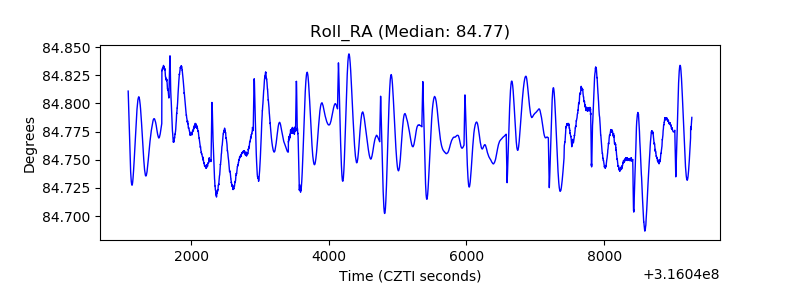 |
| Veto Counter | 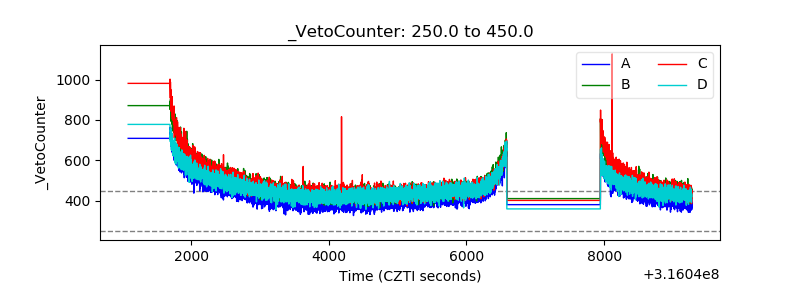 |