| Param | Original file | Final file |
|---|---|---|
| Filename | modeM0/AS1A08_008T01_9000003414_23119cztM0_level2.evt | modeM0/AS1A08_008T01_9000003414_23119cztM0_level2_quad_clean.evt |
| Size (bytes) | 714,795,840 | 130,484,160 |
| Size | 681.7 MB | 124.4 MB |
| Events in quadrant A | 8,577,926 | 773,081 |
| Events in quadrant B | 3,469,339 | 951,439 |
| Events in quadrant C | 3,887,359 | 888,638 |
| Events in quadrant D | 5,227,154 | 837,904 |
| Mode M0 | |||
|---|---|---|---|
| Quadrant | BADHDUFLAG | Total packets | Discarded packets |
| A | 0 | 30399 | 2 |
| B | 0 | 14998 | 2 |
| C | 0 | 16175 | 2 |
| D | 0 | 20440 | 2 |
| Mode M9 | |||
|---|---|---|---|
| Quadrant | BADHDUFLAG | Total packets | Discarded packets |
| A | 0 | 16 | 0 |
| B | 0 | 17 | 0 |
| C | 0 | 17 | 0 |
| D | 0 | 17 | 0 |
| Mode SS | |||
|---|---|---|---|
| Quadrant | BADHDUFLAG | Total packets | Discarded packets |
| A | 0 | 146 | 0 |
| B | 0 | 146 | 0 |
| C | 0 | 146 | 0 |
| D | 0 | 146 | 0 |
| Quadrant | Total seconds | Saturated seconds | Saturation percentage |
|---|---|---|---|
| A | 7178 | 1993 | 27.765394% |
| B | 7178 | 86 | 1.198105% |
| C | 7178 | 180 | 2.507662% |
| D | 7178 | 537 | 7.481193% |
Noise dominated data is calculated using 1-second bins in cleaned event files. If a bin has >2000 counts, and if more than 50% of those come from <1% of pixels, then it is considered to be noise-dominated and hence unusable.
| Quadrant | # 1 sec bins | Bins with >0 counts | Bins with >2000 counts | High rate bins dominated by noise | Noise dominated (total time) | Noise dominated (detector-on time) | Marked lightcurve |
|---|---|---|---|---|---|---|---|
| A | 7888 | 7178 | 1716 | 1716 | 21.75% | 23.91% | 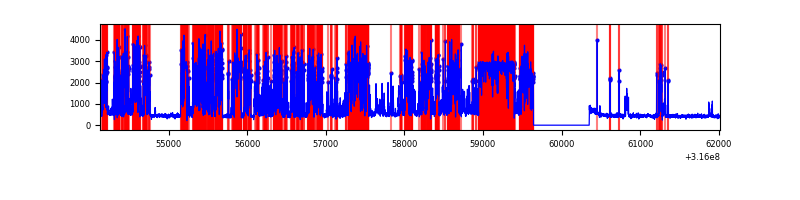 |
| B | 7888 | 7179 | 7 | 7 | 0.09% | 0.10% | 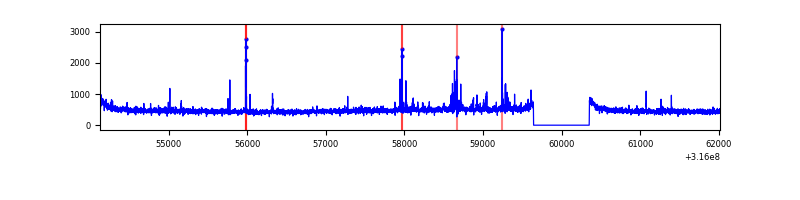 |
| C | 7888 | 7179 | 58 | 58 | 0.74% | 0.81% | 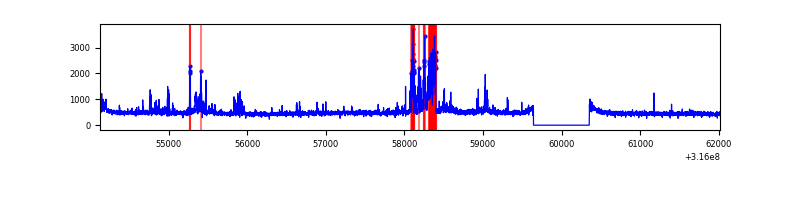 |
| D | 7888 | 7179 | 434 | 434 | 5.50% | 6.05% | 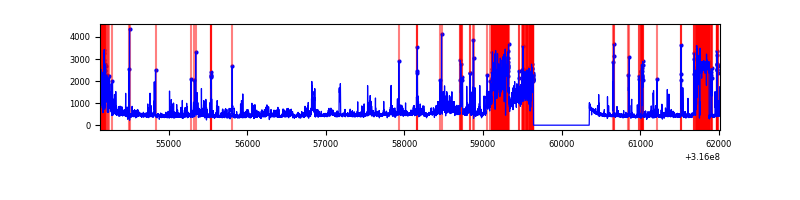 |
Top three noisy pixels from each quadrant. If the there are fewer than three noisy pixels in the level2.evt file, extra rows are filled as -1
| Pixel properties | Quadrant properties | ||||||
|---|---|---|---|---|---|---|---|
| Quadrant | DetID | PixID | Counts | Sigma | Mean | Median | Sigma |
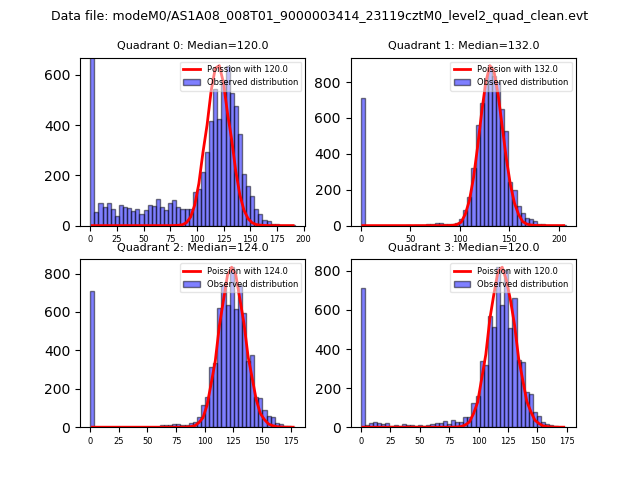
| A | 6 | 16 | 5770377 | 39329.02 | 728 | 712 | 146.7 |
| A | 13 | 254 | 9795 | 61.91 | 728 | 712 | 146.7 |
| A | 3 | 137 | 6237 | 37.66 | 728 | 712 | 146.7 |
| B | 0 | 190 | 60148 | 372.34 | 850 | 829 | 159.3 |
| B | 0 | 245 | 28282 | 172.32 | 850 | 829 | 159.3 |
| B | 0 | 189 | 21840 | 131.88 | 850 | 829 | 159.3 |
| C | 0 | 207 | 326319 | 1733.75 | 811 | 816 | 187.7 |
| C | 2 | 16 | 134470 | 711.89 | 811 | 816 | 187.7 |
| C | 14 | 238 | 129786 | 686.94 | 811 | 816 | 187.7 |
| D | 12 | 233 | 661477 | 3467.64 | 791 | 768 | 190.5 |
| D | 1 | 52 | 622212 | 3261.56 | 791 | 768 | 190.5 |
| D | 13 | 153 | 564714 | 2959.79 | 791 | 768 | 190.5 |
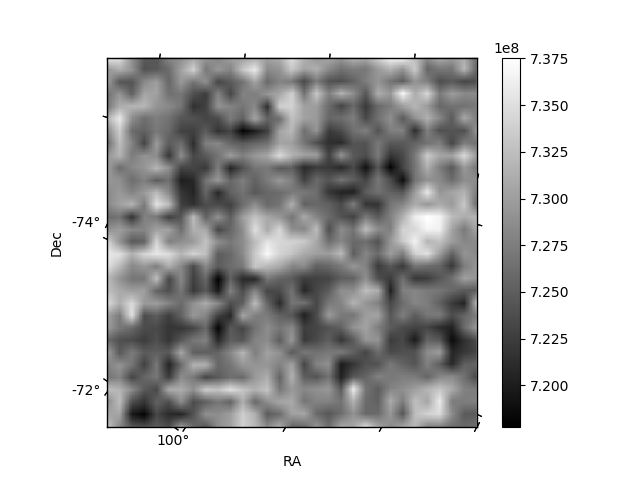
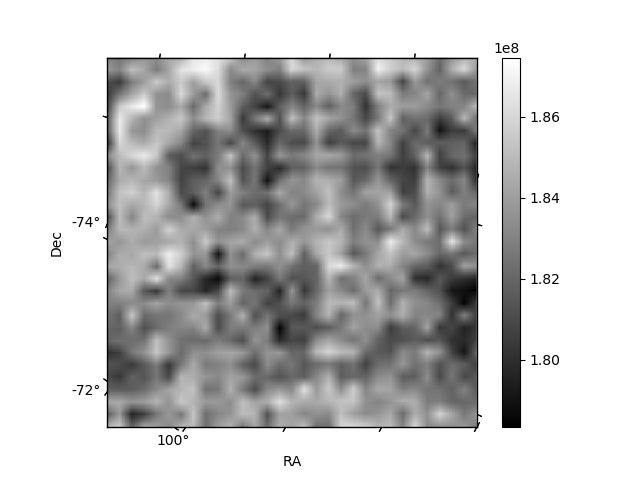
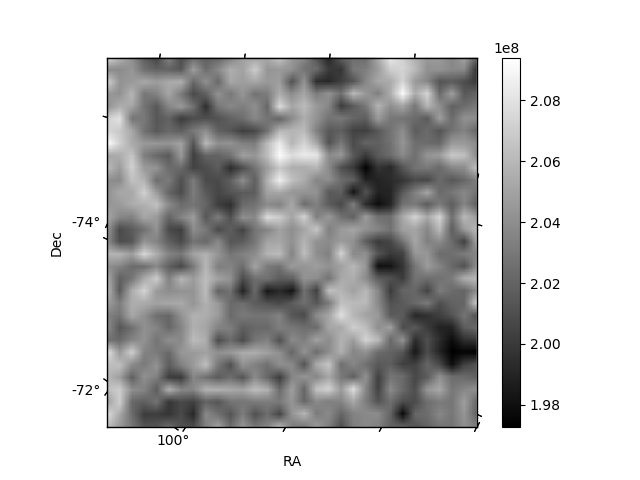
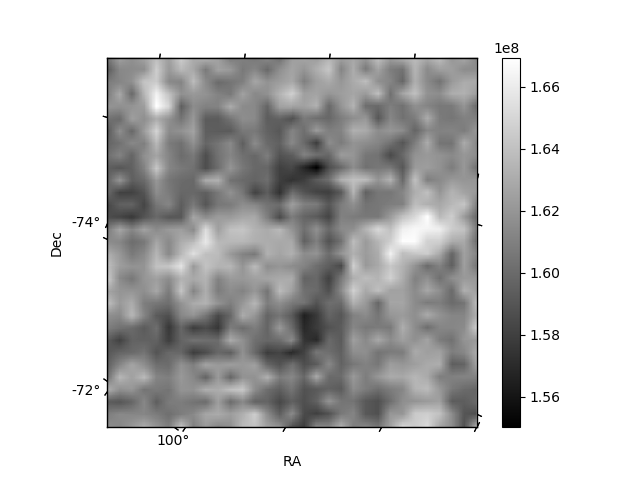
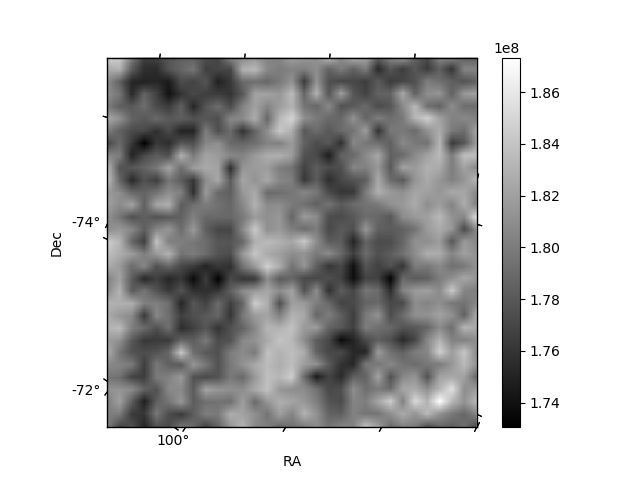
Histogram calculated using DETX and DETY for each event in the final _common_clean file
| Quadrant A | 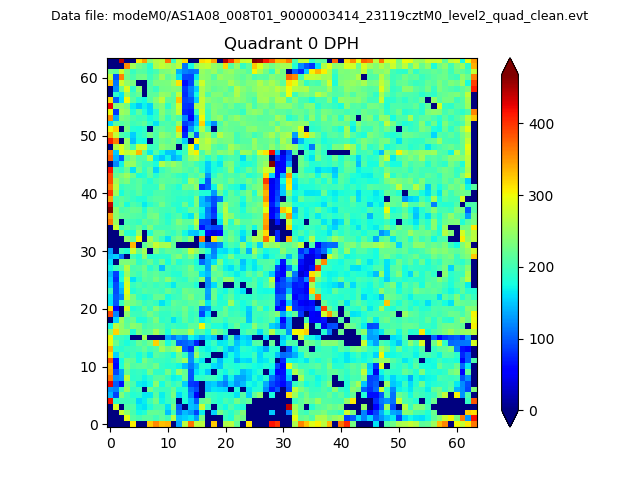 |
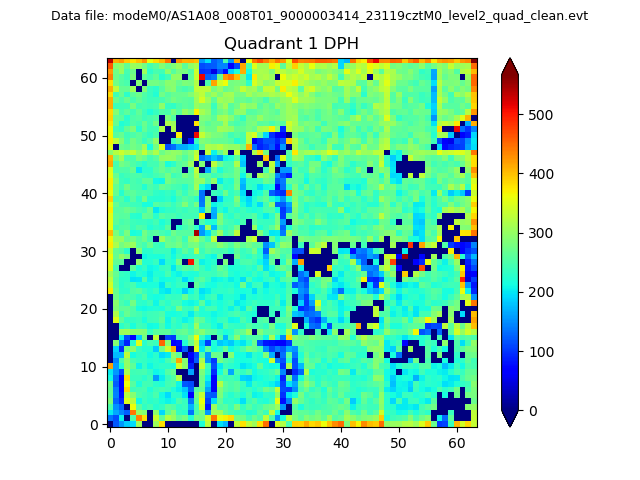 |
Quadrant B |
|---|---|---|---|
| Quadrant D | 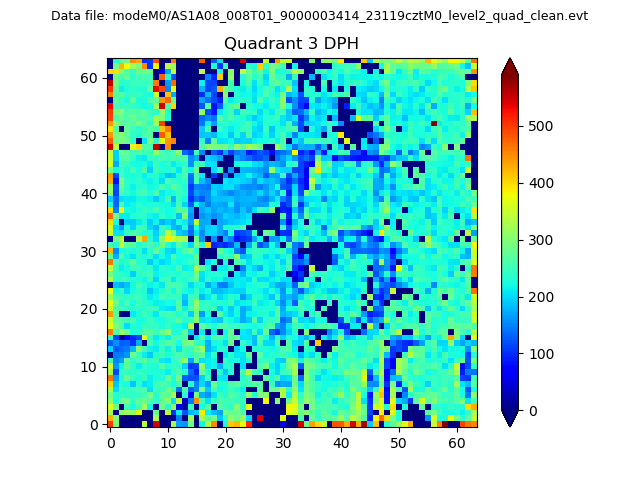 |
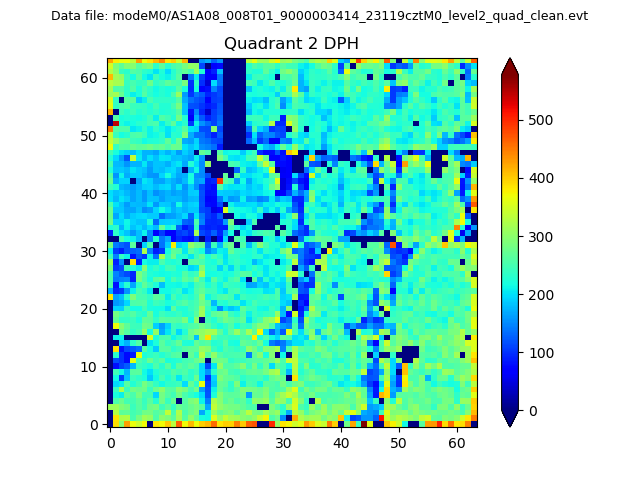 |
Quadrant C |
| Plot type | Count rate plots | Images |
|---|---|---|
| Comparison with Poisson distribution Blue bars denote a histogram of data divided into 1 sec bins. Red curve is a Poisson curve with rate = median count rate of data. |
 |
 |
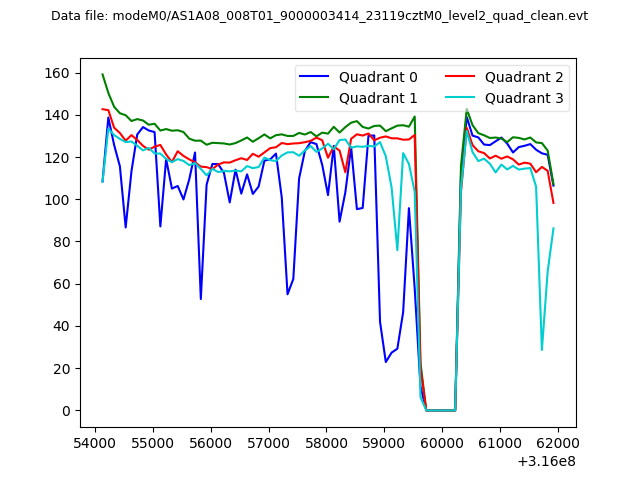
| Quadrant-wise count rates Data is divided into 100 sec bins |
 |
|
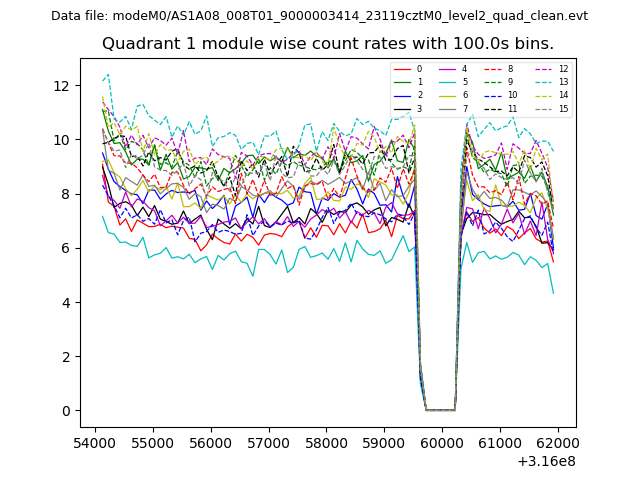
| Module-wise count rates for Quadrant A Data is divided into 100 sec bins |
 |
 |
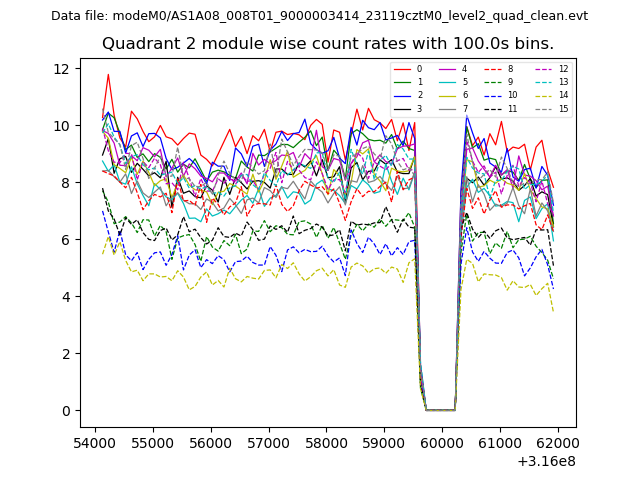
| Module-wise count rates for Quadrant B Data is divided into 100 sec bins |
 |
 |
| Module-wise count rates for Quadrant C Data is divided into 100 sec bins |
 |
 |
| Module-wise count rates for Quadrant D Data is divided into 100 sec bins |
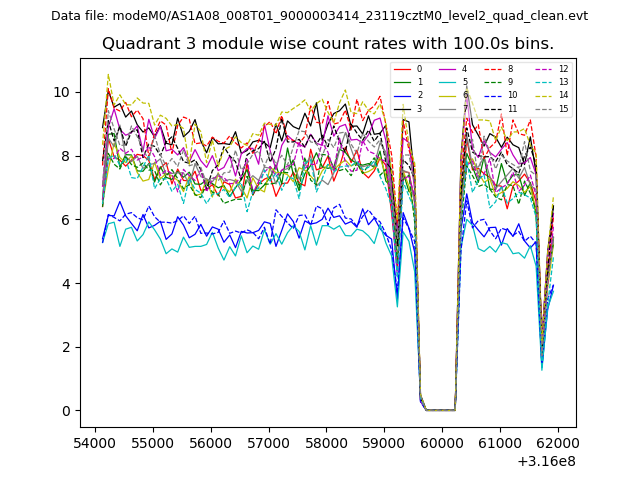 |
 |
| Parameter | Plot |
|---|---|
| CZT HV Monitor | 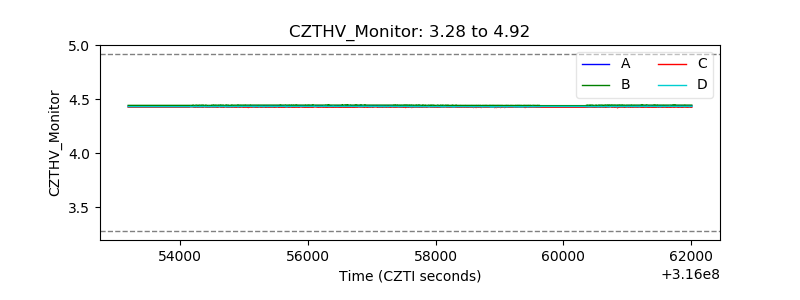 |
| D_VDD | 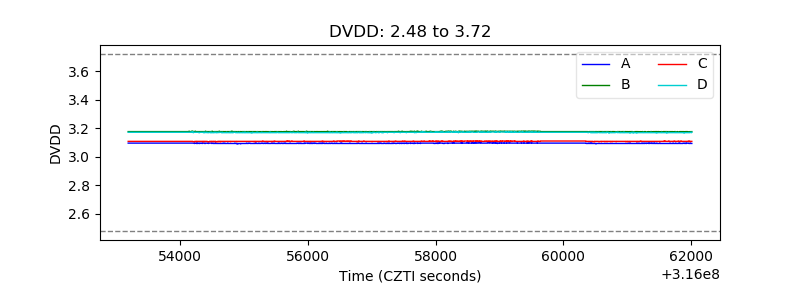 |
| Temperature 1 | 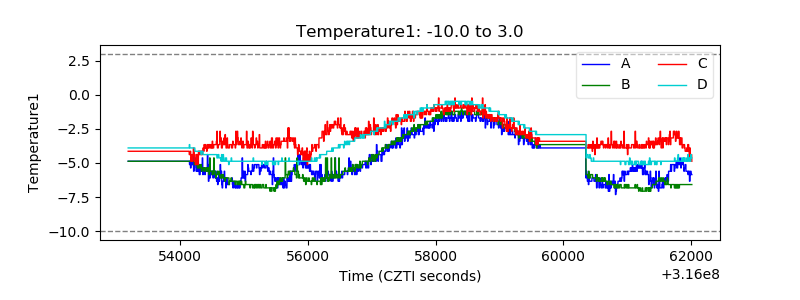 |
| Veto HV Monitor | 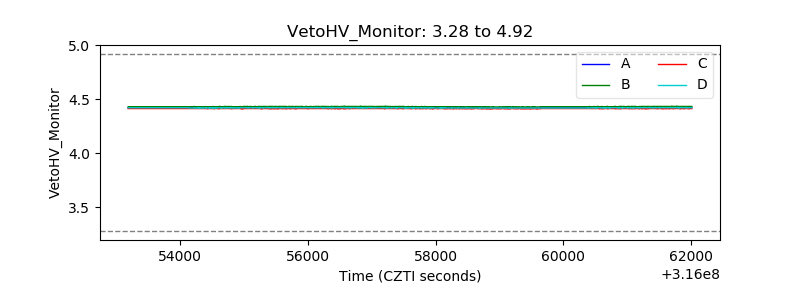 |
| Veto LLD |  |
| Alpha Counter | 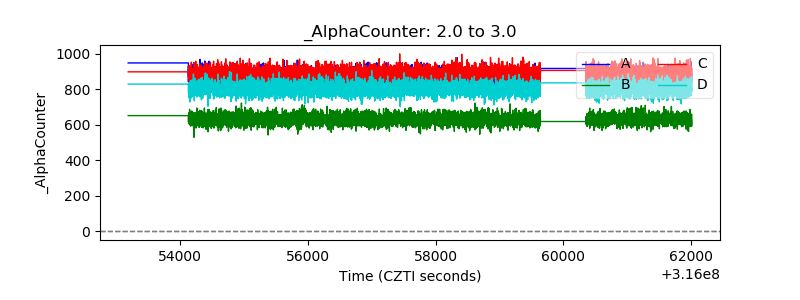 |
| _CPM_Rate | 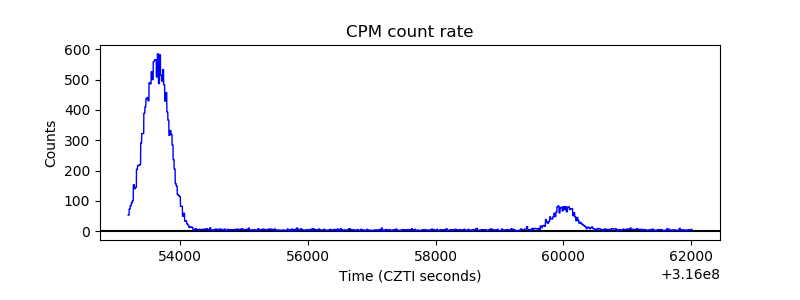 |
| CZT Counter | 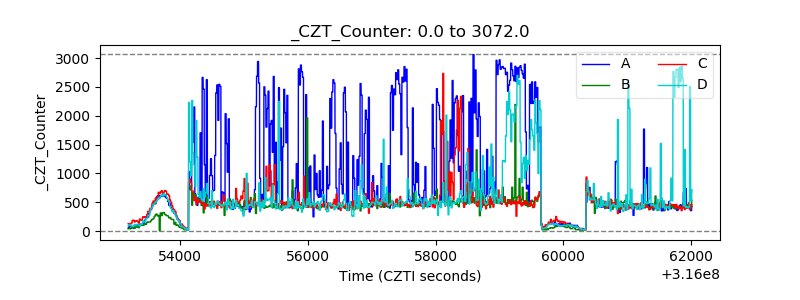 |
| +2.5 Volts monitor |  |
| +5 Volts monitor |  |
| _ROLL_ROT | 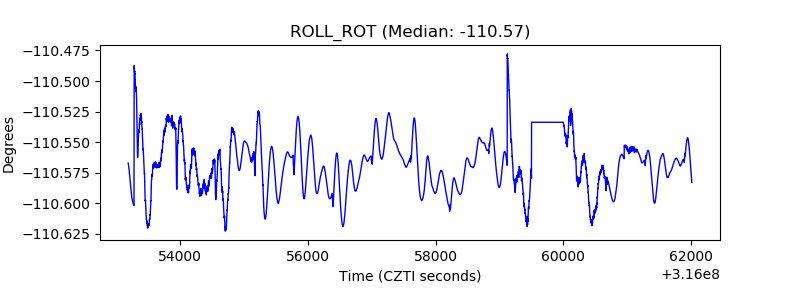 |
| _Roll_DEC | 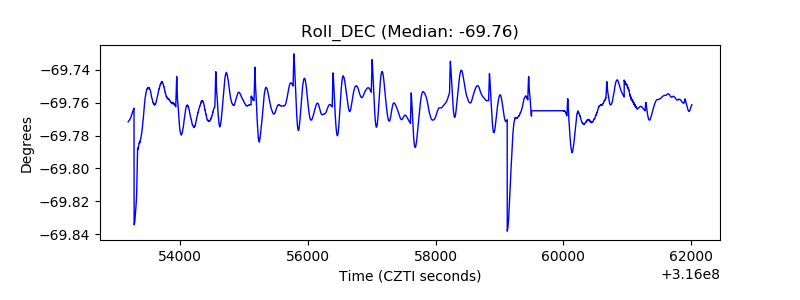 |
| _Roll_RA | 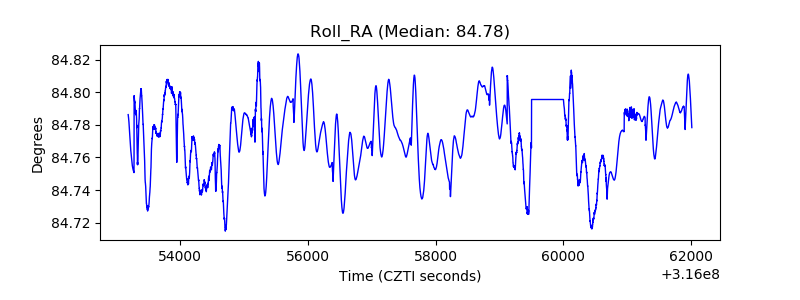 |
| Veto Counter |  |