| Param | Original file | Final file |
|---|---|---|
| Filename | modeM0/AS1A08_008T01_9000003414_23120cztM0_level2.evt | modeM0/AS1A08_008T01_9000003414_23120cztM0_level2_quad_clean.evt |
| Size (bytes) | 543,052,800 | 140,123,520 |
| Size | 517.9 MB | 133.6 MB |
| Events in quadrant A | 3,851,477 | 950,243 |
| Events in quadrant B | 3,840,809 | 972,262 |
| Events in quadrant C | 3,617,796 | 915,714 |
| Events in quadrant D | 4,621,235 | 877,972 |
| Mode M0 | |||
|---|---|---|---|
| Quadrant | BADHDUFLAG | Total packets | Discarded packets |
| A | 0 | 16672 | 2 |
| B | 0 | 16441 | 2 |
| C | 0 | 15830 | 2 |
| D | 0 | 19028 | 2 |
| Mode M9 | |||
|---|---|---|---|
| Quadrant | BADHDUFLAG | Total packets | Discarded packets |
| A | 0 | 4 | 0 |
| B | 0 | 5 | 0 |
| C | 0 | 5 | 0 |
| D | 0 | 5 | 0 |
| Mode SS | |||
|---|---|---|---|
| Quadrant | BADHDUFLAG | Total packets | Discarded packets |
| A | 0 | 154 | 0 |
| B | 0 | 154 | 0 |
| C | 0 | 154 | 0 |
| D | 0 | 154 | 0 |
| Quadrant | Total seconds | Saturated seconds | Saturation percentage |
|---|---|---|---|
| A | 7583 | 234 | 3.085850% |
| B | 7583 | 286 | 3.771594% |
| C | 7583 | 227 | 2.993538% |
| D | 7583 | 427 | 5.631017% |
Noise dominated data is calculated using 1-second bins in cleaned event files. If a bin has >2000 counts, and if more than 50% of those come from <1% of pixels, then it is considered to be noise-dominated and hence unusable.
| Quadrant | # 1 sec bins | Bins with >0 counts | Bins with >2000 counts | High rate bins dominated by noise | Noise dominated (total time) | Noise dominated (detector-on time) | Marked lightcurve |
|---|---|---|---|---|---|---|---|
| A | 7783 | 7584 | 52 | 52 | 0.67% | 0.69% | 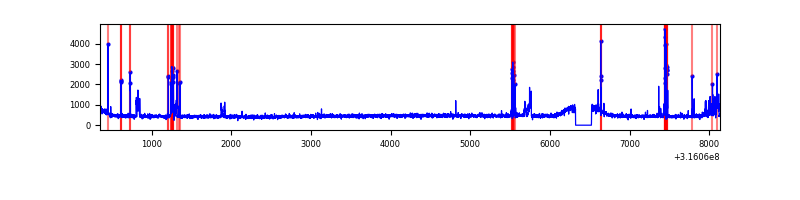 |
| B | 7783 | 7583 | 51 | 51 | 0.66% | 0.67% | 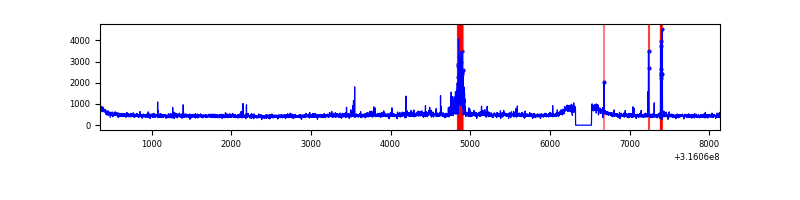 |
| C | 7783 | 7583 | 1 | 1 | 0.01% | 0.01% | 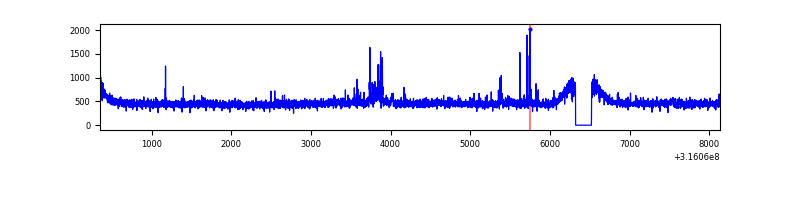 |
| D | 7783 | 7584 | 283 | 283 | 3.64% | 3.73% | 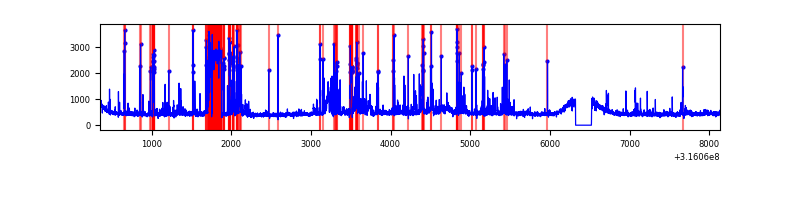 |
Top three noisy pixels from each quadrant. If the there are fewer than three noisy pixels in the level2.evt file, extra rows are filled as -1
| Pixel properties | Quadrant properties | ||||||
|---|---|---|---|---|---|---|---|
| Quadrant | DetID | PixID | Counts | Sigma | Mean | Median | Sigma |
| A | 6 | 16 | 390821 | 2150.71 | 896 | 875 | 181.3 |
| A | 13 | 254 | 11771 | 60.1 | 896 | 875 | 181.3 |
| A | 3 | 137 | 7973 | 39.15 | 896 | 875 | 181.3 |
| B | 0 | 190 | 117190 | 671.47 | 901 | 876 | 173.2 |
| B | 0 | 228 | 104125 | 596.05 | 901 | 876 | 173.2 |
| B | 0 | 189 | 64083 | 364.89 | 901 | 876 | 173.2 |
| C | 14 | 238 | 140345 | 692.21 | 865 | 867 | 201.5 |
| C | 2 | 16 | 66471 | 325.58 | 865 | 867 | 201.5 |
| C | 0 | 207 | 16960 | 79.87 | 865 | 867 | 201.5 |
| D | 13 | 153 | 665440 | 3200.76 | 860 | 833 | 207.6 |
| D | 12 | 233 | 259721 | 1246.81 | 860 | 833 | 207.6 |
| D | 7 | 38 | 255279 | 1225.42 | 860 | 833 | 207.6 |
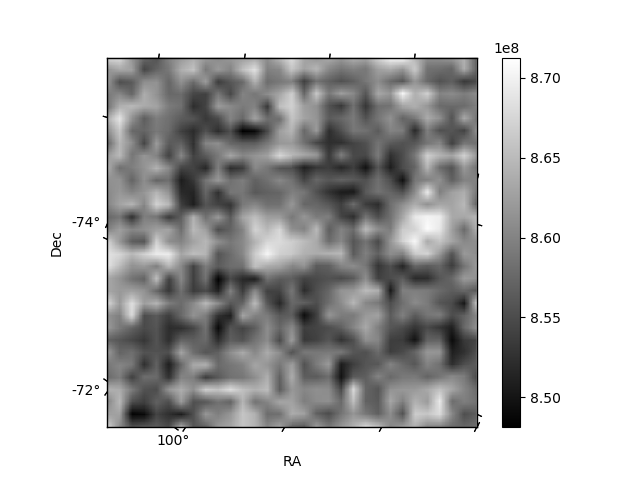
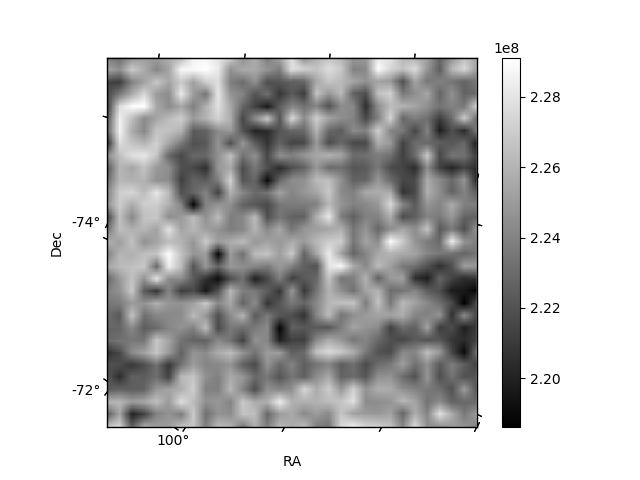
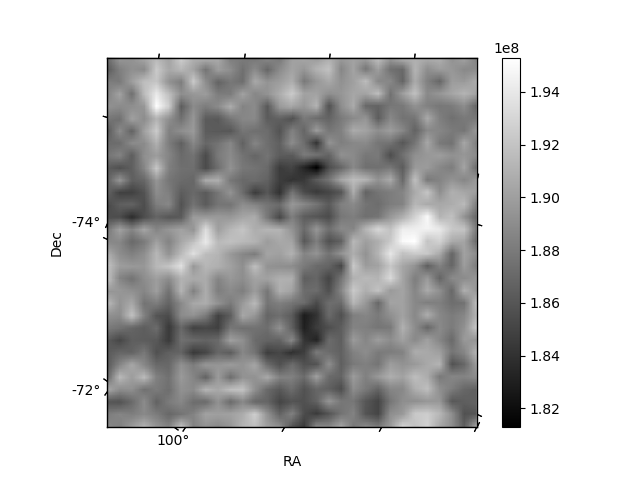
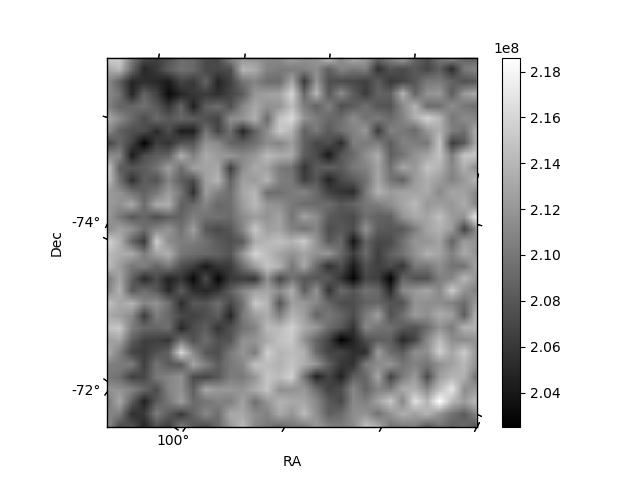
Histogram calculated using DETX and DETY for each event in the final _common_clean file
| Quadrant A | 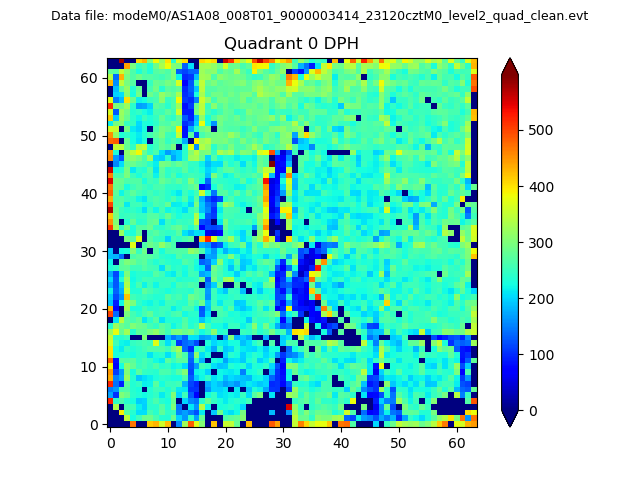 |
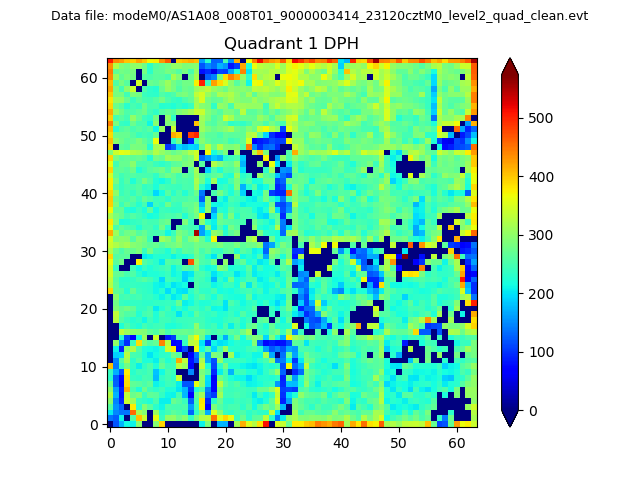 |
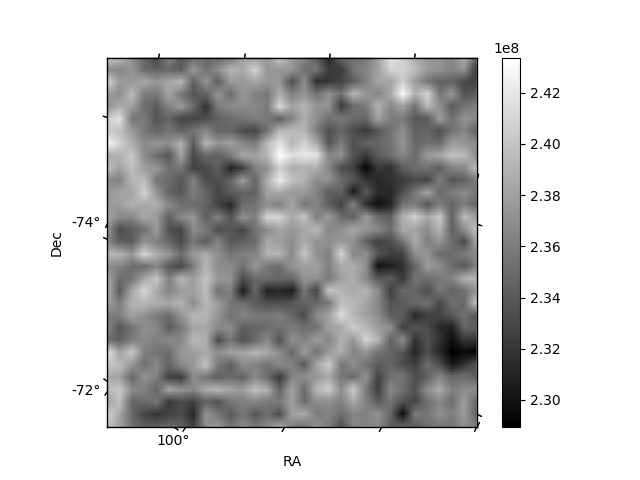
Quadrant B |
|---|---|---|---|
| Quadrant D | 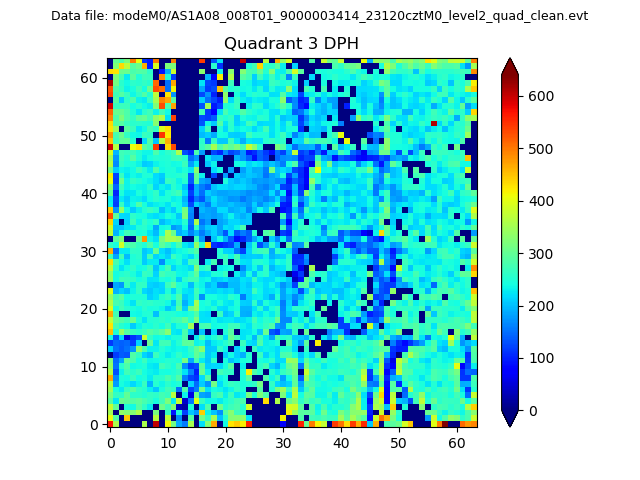 |
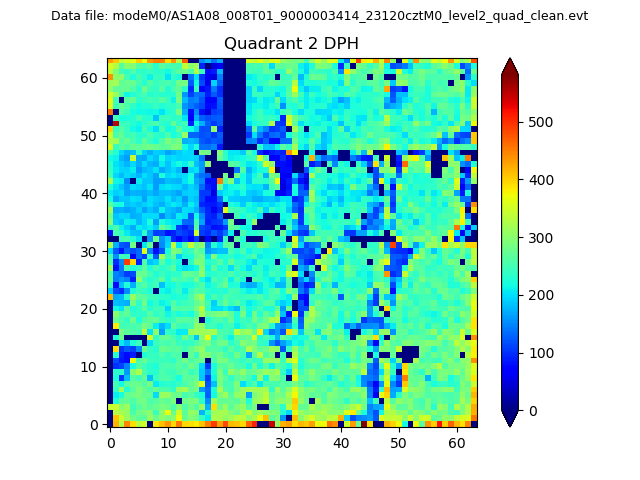 |
Quadrant C |
| Plot type | Count rate plots | Images |
|---|---|---|
| Comparison with Poisson distribution Blue bars denote a histogram of data divided into 1 sec bins. Red curve is a Poisson curve with rate = median count rate of data. |
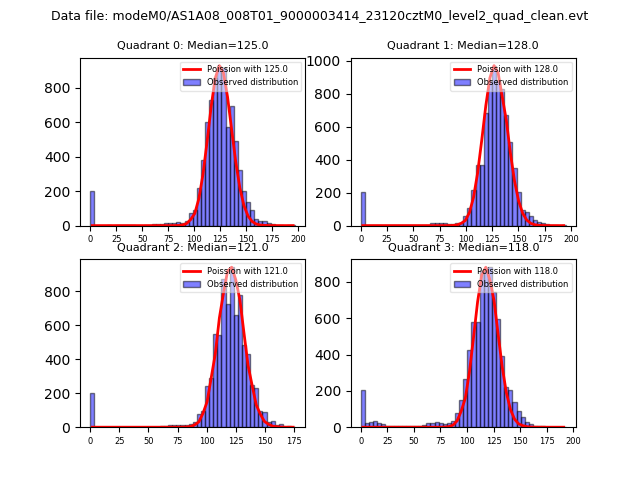 |
 |
| Quadrant-wise count rates Data is divided into 100 sec bins |
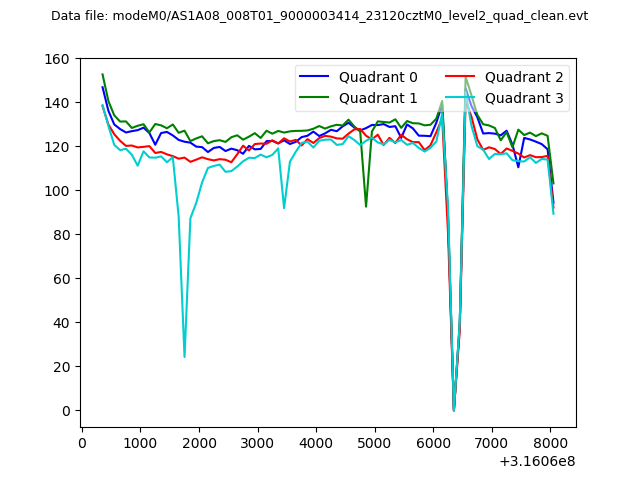 |
|
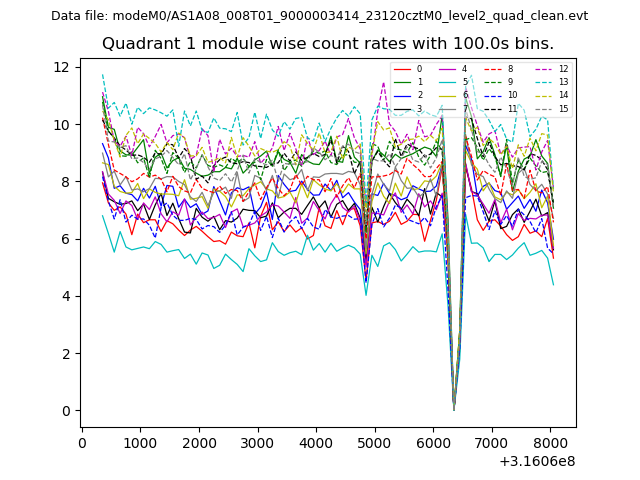
| Module-wise count rates for Quadrant A Data is divided into 100 sec bins |
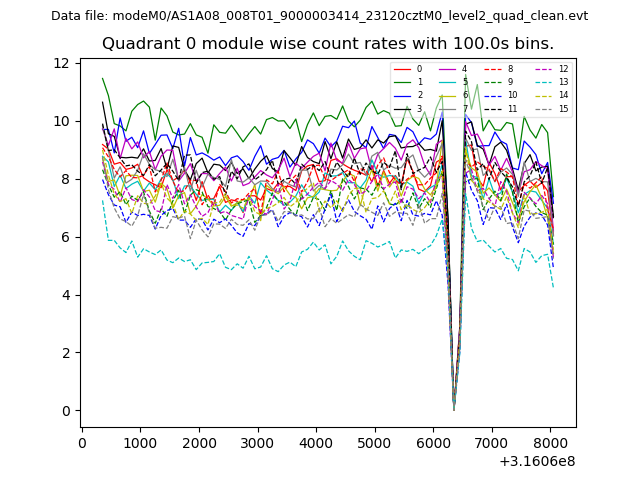 |
 |
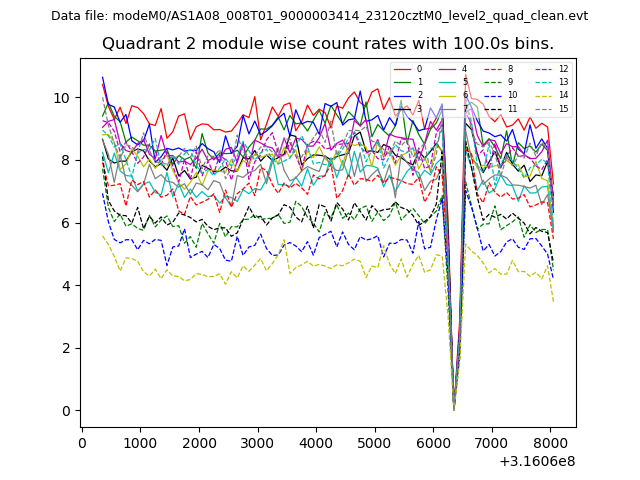
| Module-wise count rates for Quadrant B Data is divided into 100 sec bins |
 |
 |
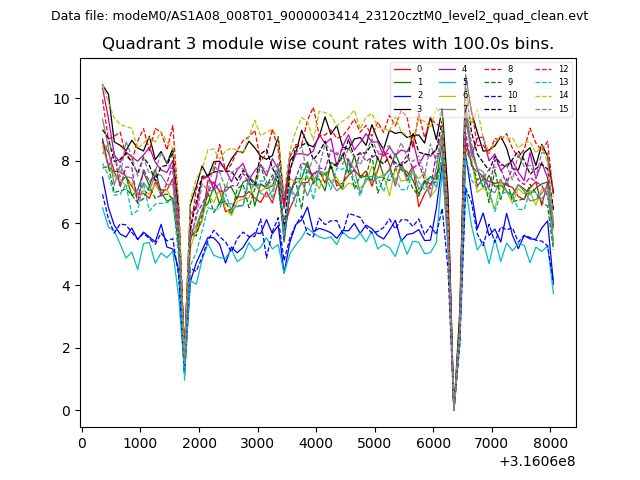
| Module-wise count rates for Quadrant C Data is divided into 100 sec bins |
 |
 |
| Module-wise count rates for Quadrant D Data is divided into 100 sec bins |
 |
 |
| Parameter | Plot |
|---|---|
| CZT HV Monitor | 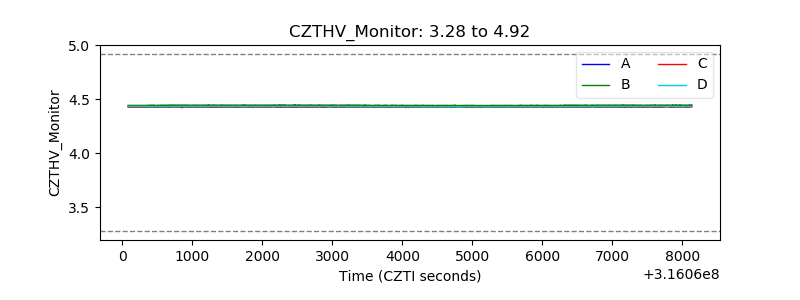 |
| D_VDD | 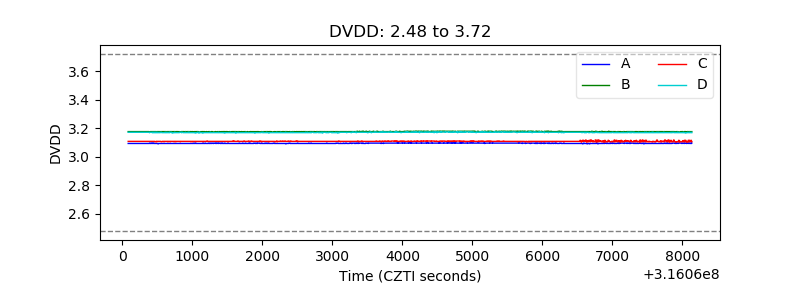 |
| Temperature 1 | 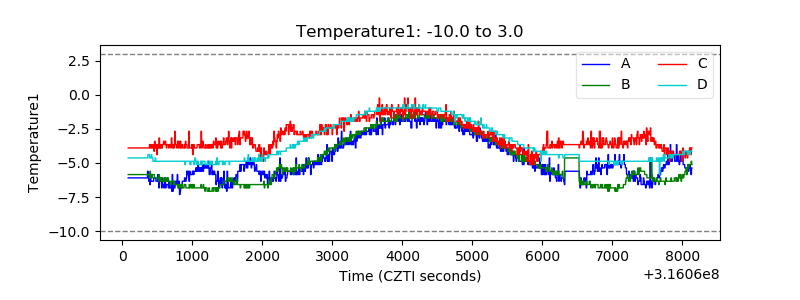 |
| Veto HV Monitor | 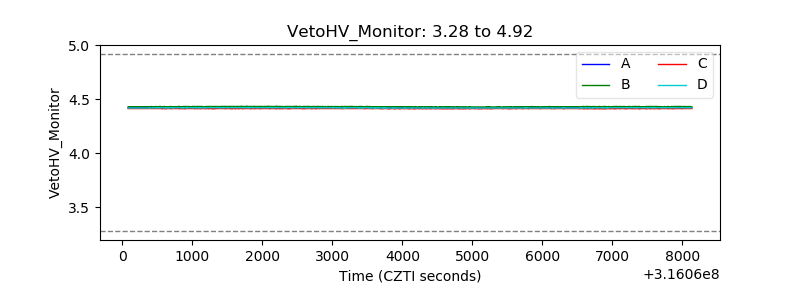 |
| Veto LLD | 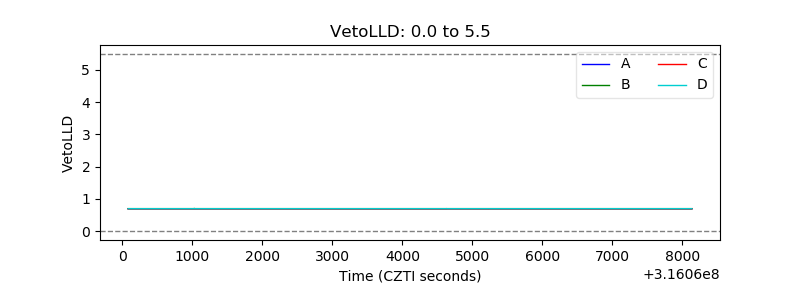 |
| Alpha Counter | 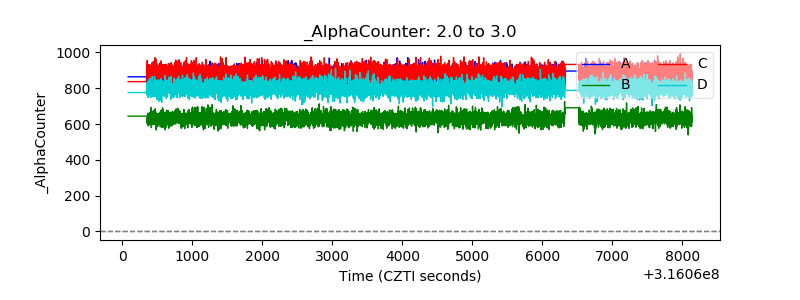 |
| _CPM_Rate | 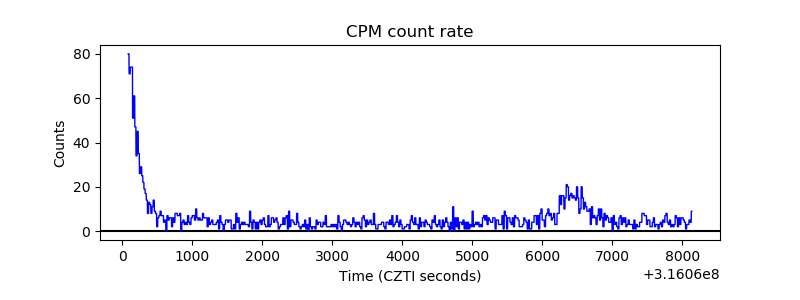 |
| CZT Counter | 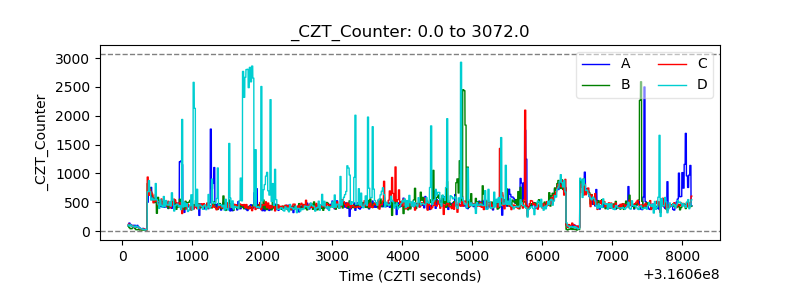 |
| +2.5 Volts monitor | 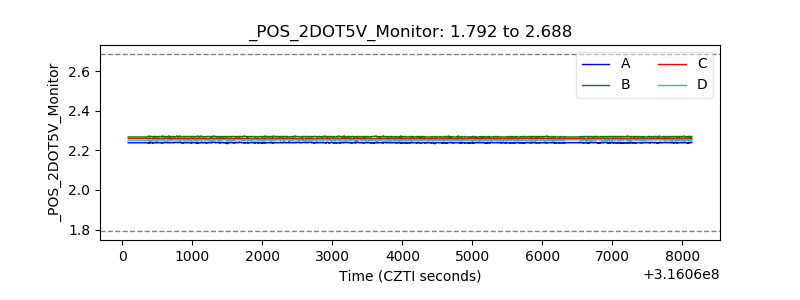 |
| +5 Volts monitor |  |
| _ROLL_ROT | 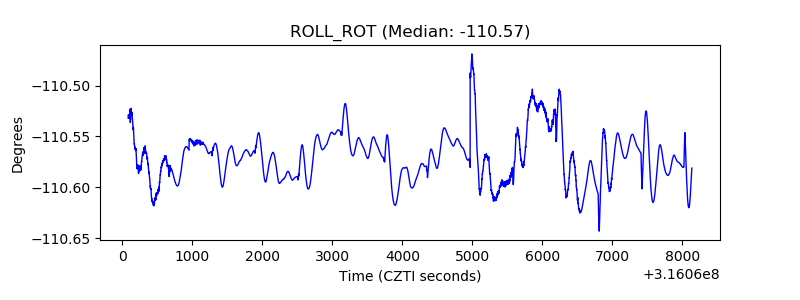 |
| _Roll_DEC | 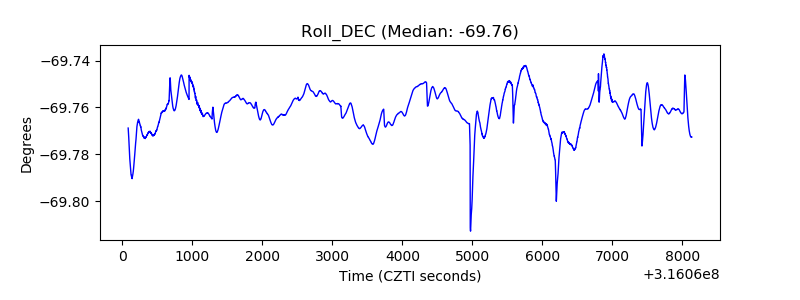 |
| _Roll_RA | 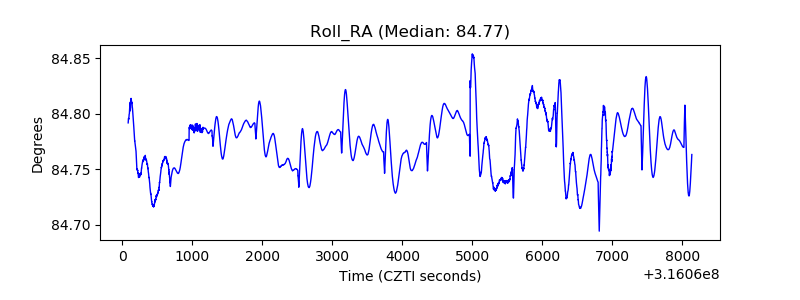 |
| Veto Counter | 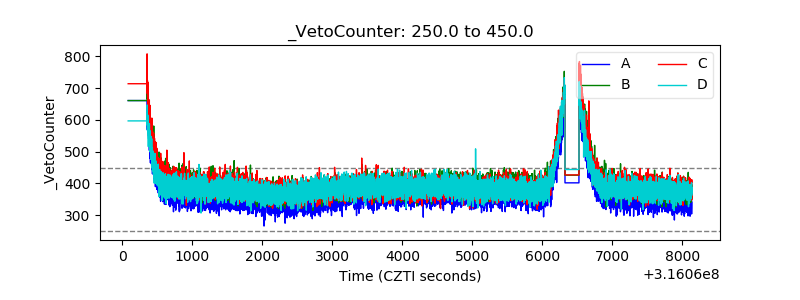 |