| Param | Original file | Final file |
|---|---|---|
| Filename | modeM0/AS1A08_008T01_9000003414_23121cztM0_level2.evt | modeM0/AS1A08_008T01_9000003414_23121cztM0_level2_quad_clean.evt |
| Size (bytes) | 574,531,200 | 128,828,160 |
| Size | 547.9 MB | 122.9 MB |
| Events in quadrant A | 5,948,635 | 843,910 |
| Events in quadrant B | 3,574,419 | 895,061 |
| Events in quadrant C | 3,380,828 | 846,933 |
| Events in quadrant D | 4,013,833 | 820,633 |
| Mode M0 | |||
|---|---|---|---|
| Quadrant | BADHDUFLAG | Total packets | Discarded packets |
| A | 0 | 22518 | 1 |
| B | 0 | 15317 | 1 |
| C | 0 | 14761 | 1 |
| D | 0 | 16837 | 1 |
| Mode M9 | |||
|---|---|---|---|
| Quadrant | BADHDUFLAG | Total packets | Discarded packets |
| A | 0 | 1 | 0 |
| B | 0 | 1 | 0 |
| C | 0 | 1 | 0 |
| D | 0 | 1 | 0 |
| Mode SS | |||
|---|---|---|---|
| Quadrant | BADHDUFLAG | Total packets | Discarded packets |
| A | 0 | 144 | 0 |
| B | 0 | 144 | 0 |
| C | 0 | 144 | 0 |
| D | 0 | 144 | 0 |
| Quadrant | Total seconds | Saturated seconds | Saturation percentage |
|---|---|---|---|
| A | 7105 | 620 | 8.726249% |
| B | 7106 | 351 | 4.939488% |
| C | 7105 | 298 | 4.194229% |
| D | 7105 | 354 | 4.982407% |
Noise dominated data is calculated using 1-second bins in cleaned event files. If a bin has >2000 counts, and if more than 50% of those come from <1% of pixels, then it is considered to be noise-dominated and hence unusable.
| Quadrant | # 1 sec bins | Bins with >0 counts | Bins with >2000 counts | High rate bins dominated by noise | Noise dominated (total time) | Noise dominated (detector-on time) | Marked lightcurve |
|---|---|---|---|---|---|---|---|
| A | 7155 | 7105 | 265 | 265 | 3.70% | 3.73% | 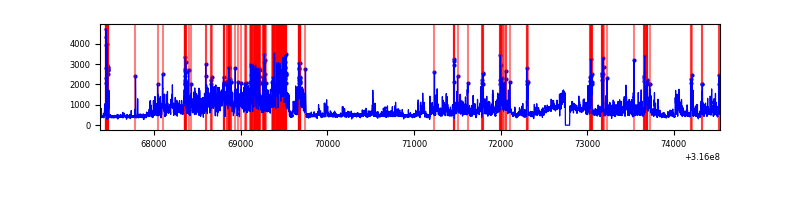 |
| B | 7156 | 7107 | 28 | 28 | 0.39% | 0.39% | 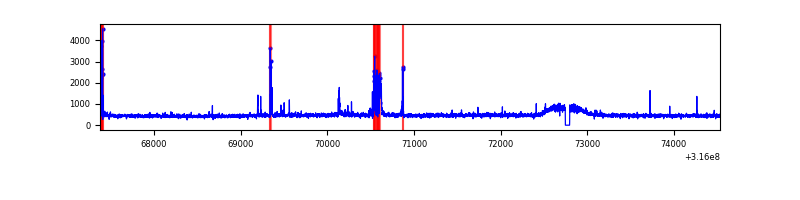 |
| C | 7155 | 7106 | 1 | 1 | 0.01% | 0.01% | 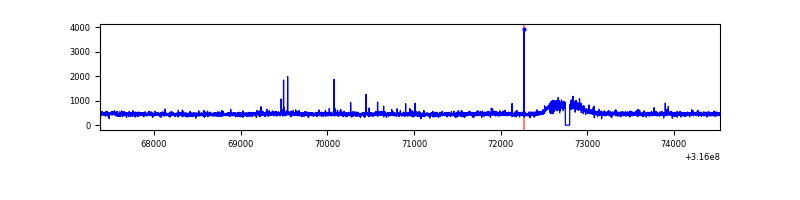 |
| D | 7155 | 7106 | 106 | 106 | 1.48% | 1.49% | 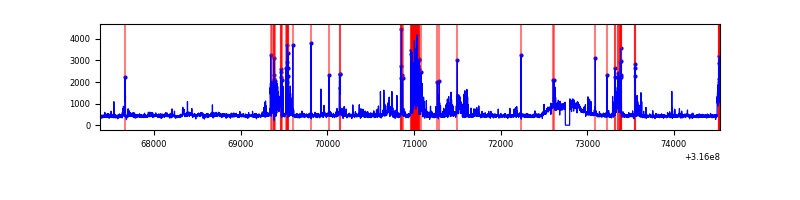 |
Top three noisy pixels from each quadrant. If the there are fewer than three noisy pixels in the level2.evt file, extra rows are filled as -1
| Pixel properties | Quadrant properties | ||||||
|---|---|---|---|---|---|---|---|
| Quadrant | DetID | PixID | Counts | Sigma | Mean | Median | Sigma |
| A | 6 | 16 | 2732410 | 16228.06 | 831 | 811 | 168.3 |
| A | 13 | 254 | 10709 | 58.8 | 831 | 811 | 168.3 |
| A | 4 | 2 | 8721 | 46.99 | 831 | 811 | 168.3 |
| B | 0 | 190 | 163394 | 1001.53 | 845 | 822 | 162.3 |
| B | 0 | 189 | 52014 | 315.37 | 845 | 822 | 162.3 |
| B | 0 | 228 | 21908 | 129.9 | 845 | 822 | 162.3 |
| C | 14 | 238 | 130013 | 675.11 | 815 | 816 | 191.4 |
| C | 0 | 207 | 23821 | 120.21 | 815 | 816 | 191.4 |
| C | 2 | 16 | 15029 | 74.27 | 815 | 816 | 191.4 |
| D | 12 | 233 | 310419 | 1544.05 | 822 | 796 | 200.5 |
| D | 7 | 38 | 179838 | 892.86 | 822 | 796 | 200.5 |
| D | 1 | 52 | 143718 | 712.74 | 822 | 796 | 200.5 |
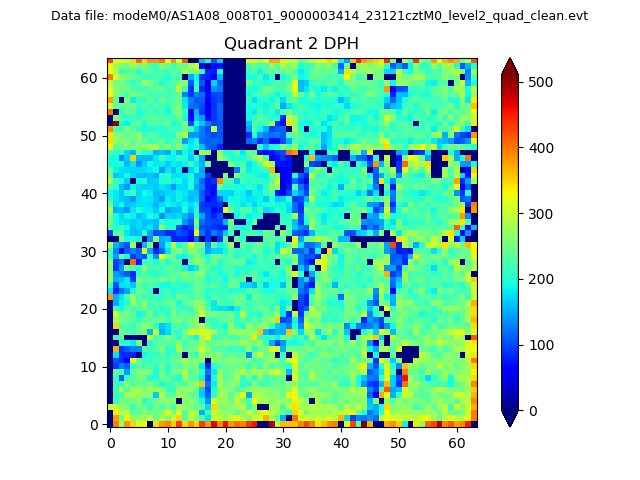
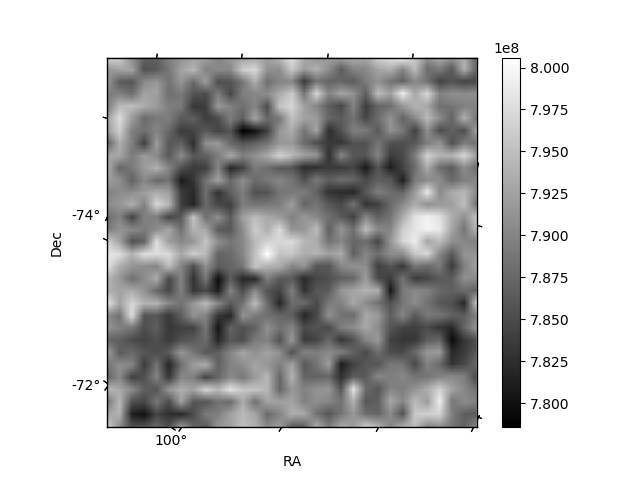
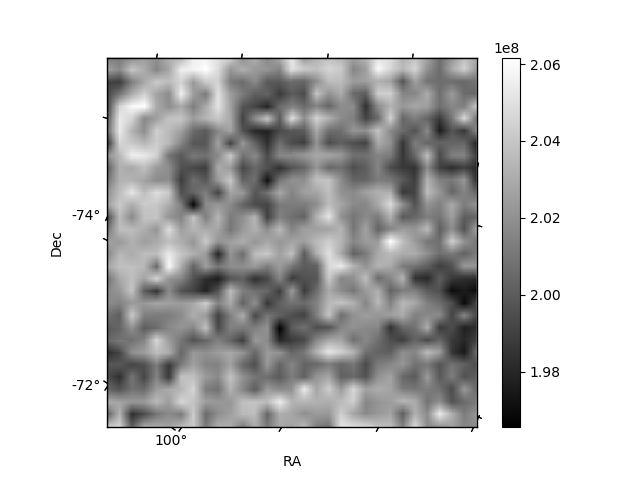
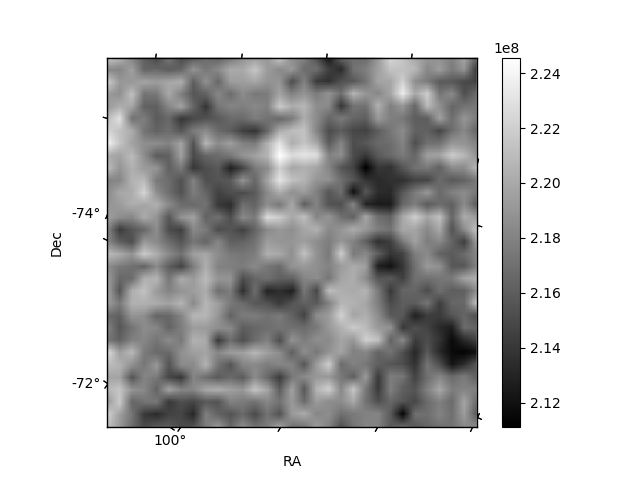
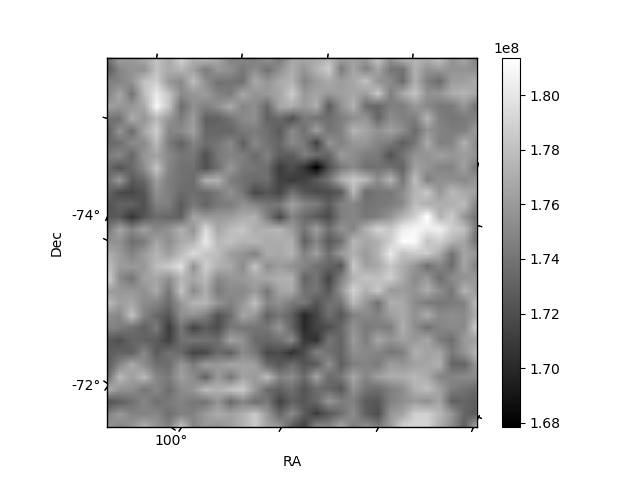
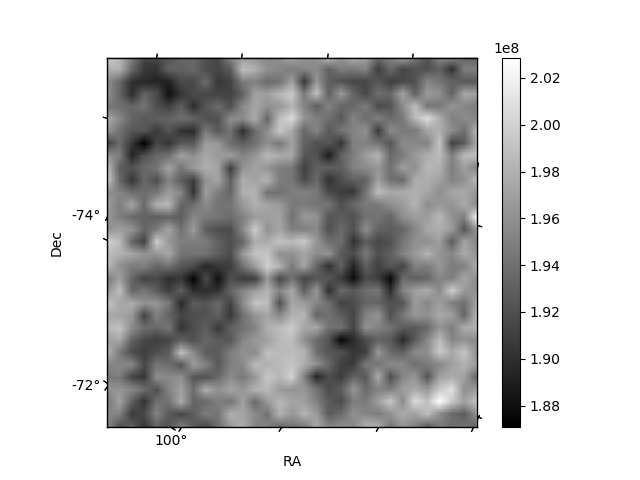
Histogram calculated using DETX and DETY for each event in the final _common_clean file
| Quadrant A | 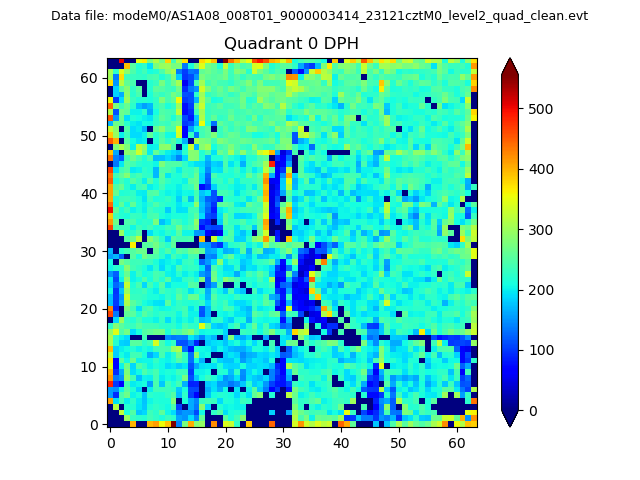 |
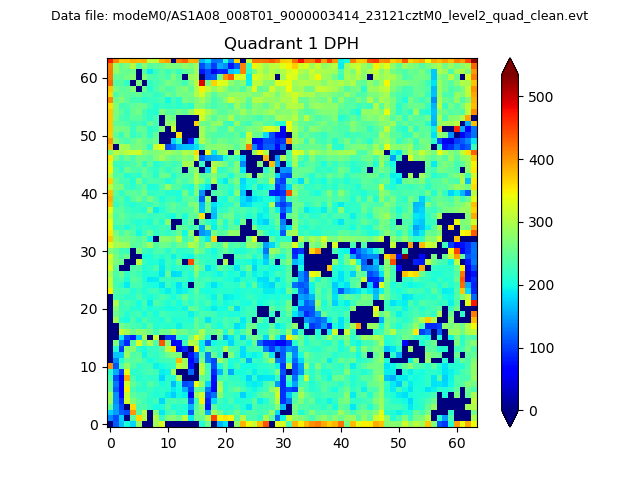 |
Quadrant B |
|---|---|---|---|
| Quadrant D | 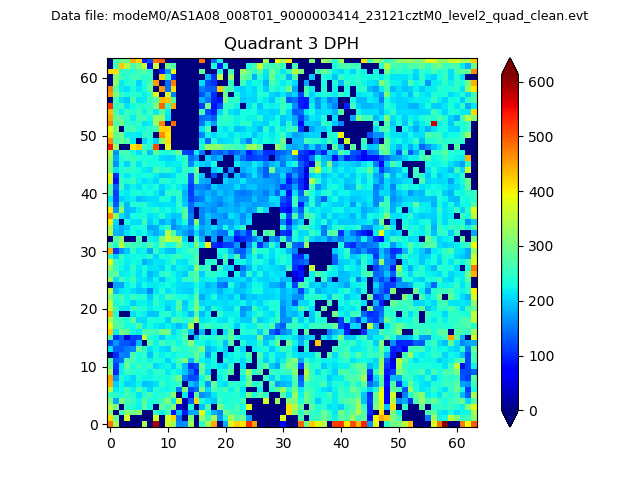 |
 |
Quadrant C |
| Plot type | Count rate plots | Images |
|---|---|---|
| Comparison with Poisson distribution Blue bars denote a histogram of data divided into 1 sec bins. Red curve is a Poisson curve with rate = median count rate of data. |
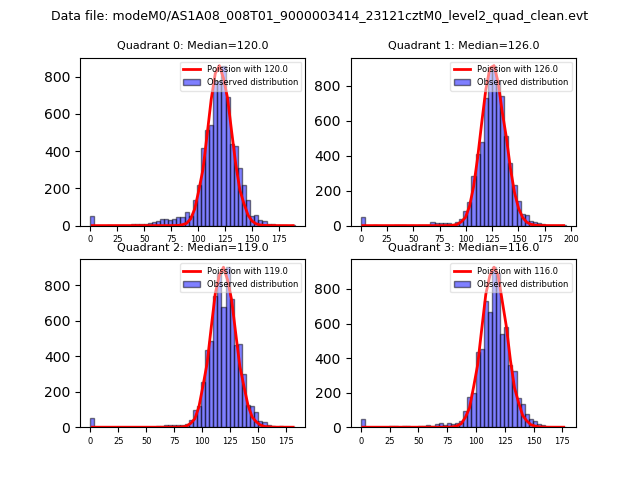 |
 |
| Quadrant-wise count rates Data is divided into 100 sec bins |
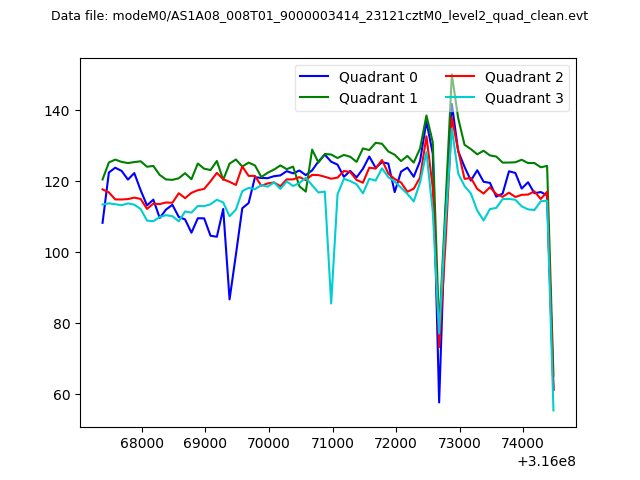 |
|
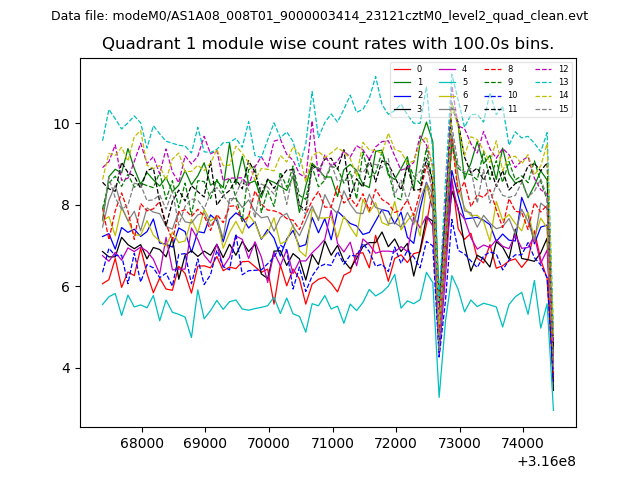
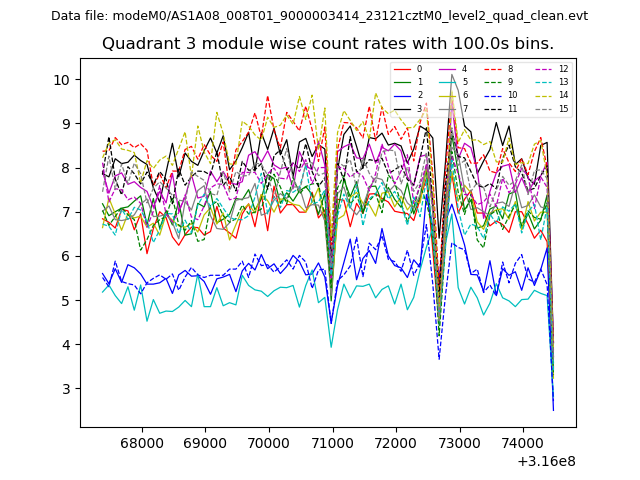
| Module-wise count rates for Quadrant A Data is divided into 100 sec bins |
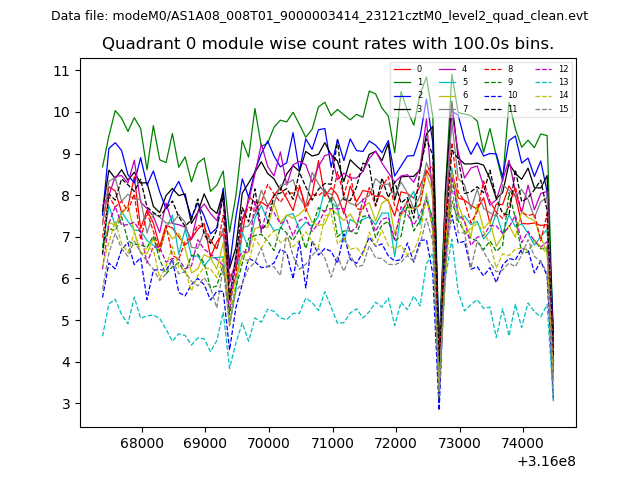 |
 |
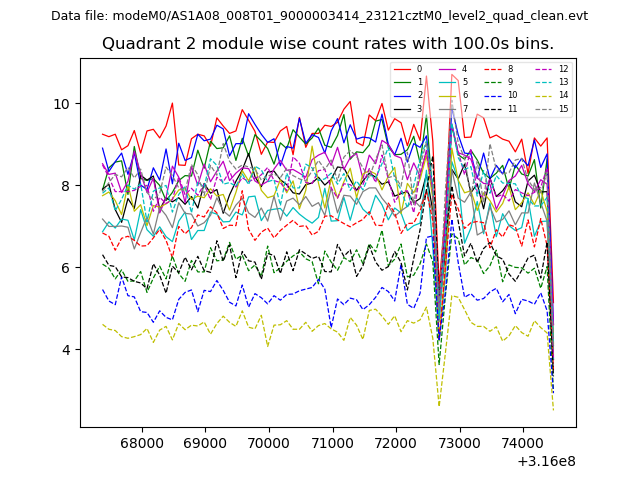
| Module-wise count rates for Quadrant B Data is divided into 100 sec bins |
 |
 |
| Module-wise count rates for Quadrant C Data is divided into 100 sec bins |
 |
 |
| Module-wise count rates for Quadrant D Data is divided into 100 sec bins |
 |
 |
| Parameter | Plot |
|---|---|
| CZT HV Monitor | 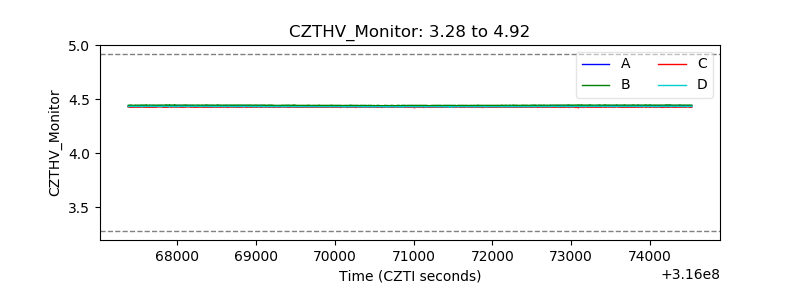 |
| D_VDD | 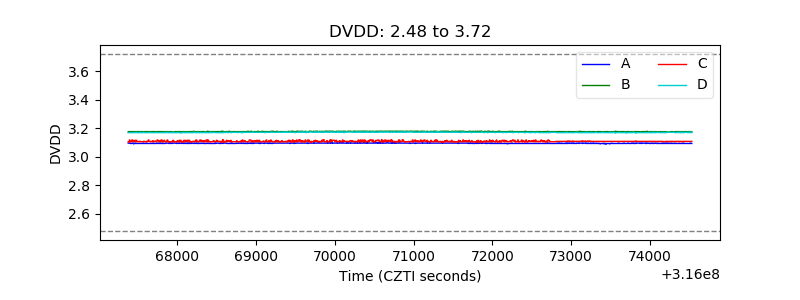 |
| Temperature 1 | 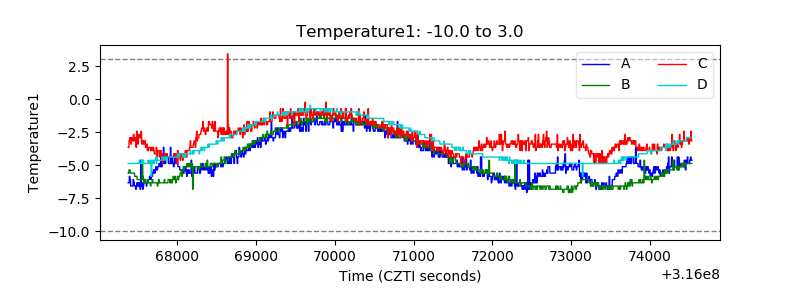 |
| Veto HV Monitor |  |
| Veto LLD | 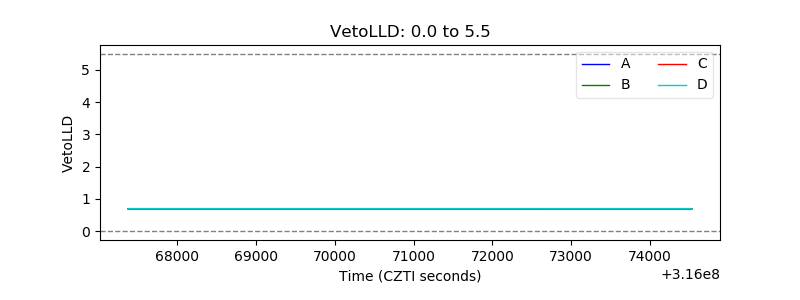 |
| Alpha Counter | 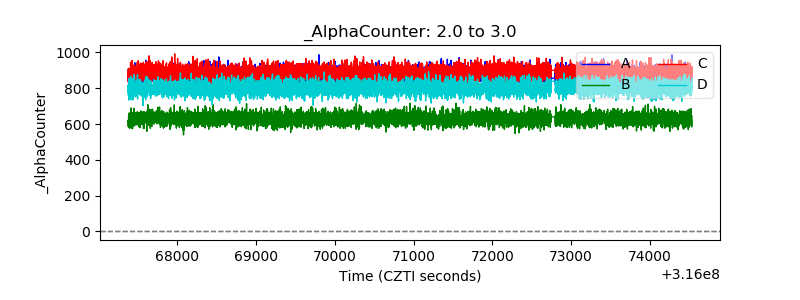 |
| _CPM_Rate |  |
| CZT Counter | 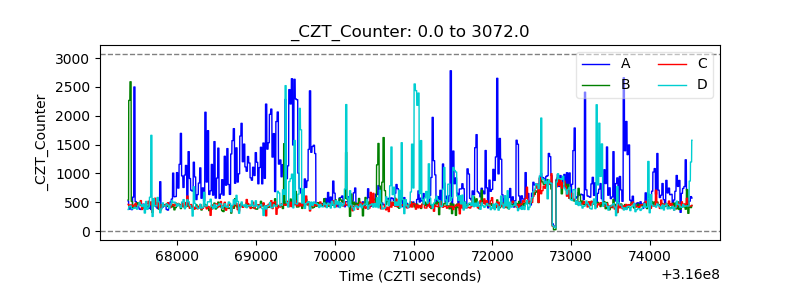 |
| +2.5 Volts monitor | 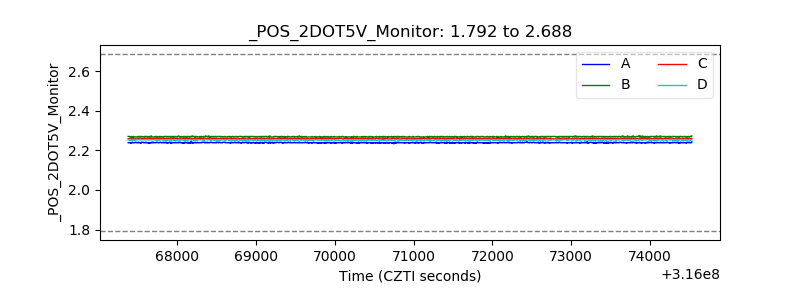 |
| +5 Volts monitor |  |
| _ROLL_ROT | 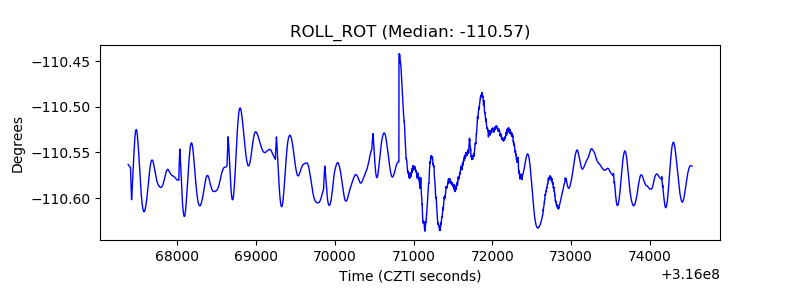 |
| _Roll_DEC | 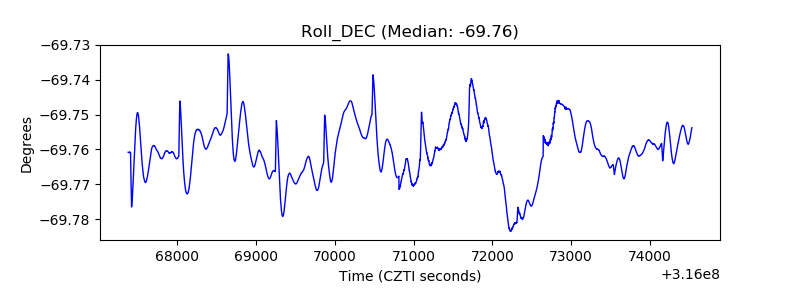 |
| _Roll_RA | 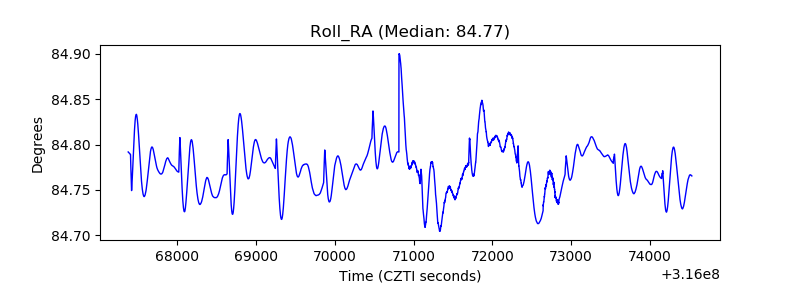 |
| Veto Counter | 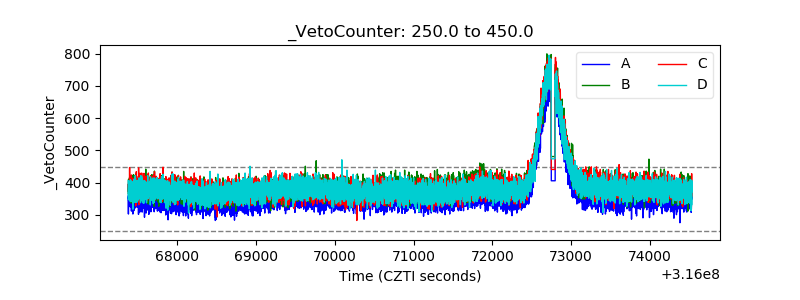 |