| Param | Original file | Final file |
|---|---|---|
| Filename | modeM0/AS1A08_008T01_9000003414_23125cztM0_level2.evt | modeM0/AS1A08_008T01_9000003414_23125cztM0_level2_quad_clean.evt |
| Size (bytes) | 1,254,732,480 | 296,392,320 |
| Size | 1.2 GB | 282.7 MB |
| Events in quadrant A | 11,888,583 | 1,936,379 |
| Events in quadrant B | 7,658,970 | 2,048,926 |
| Events in quadrant C | 7,658,335 | 1,962,189 |
| Events in quadrant D | 9,682,104 | 1,895,409 |
| Mode M0 | |||
|---|---|---|---|
| Quadrant | BADHDUFLAG | Total packets | Discarded packets |
| A | 0 | 46335 | 2 |
| B | 0 | 33638 | 2 |
| C | 0 | 33615 | 2 |
| D | 0 | 40292 | 2 |
| Mode M9 | |||
|---|---|---|---|
| Quadrant | BADHDUFLAG | Total packets | Discarded packets |
| A | 0 | 11 | 0 |
| B | 0 | 11 | 0 |
| C | 0 | 11 | 0 |
| D | 0 | 11 | 0 |
| Mode SS | |||
|---|---|---|---|
| Quadrant | BADHDUFLAG | Total packets | Discarded packets |
| A | 0 | 336 | 0 |
| B | 0 | 336 | 0 |
| C | 0 | 336 | 0 |
| D | 0 | 336 | 0 |
| Quadrant | Total seconds | Saturated seconds | Saturation percentage |
|---|---|---|---|
| A | 16442 | 1360 | 8.271500% |
| B | 16443 | 258 | 1.569057% |
| C | 16443 | 283 | 1.721097% |
| D | 16443 | 705 | 4.287539% |
Noise dominated data is calculated using 1-second bins in cleaned event files. If a bin has >2000 counts, and if more than 50% of those come from <1% of pixels, then it is considered to be noise-dominated and hence unusable.
| Quadrant | # 1 sec bins | Bins with >0 counts | Bins with >2000 counts | High rate bins dominated by noise | Noise dominated (total time) | Noise dominated (detector-on time) | Marked lightcurve |
|---|---|---|---|---|---|---|---|
| A | 17331 | 16442 | 882 | 882 | 5.09% | 5.36% | 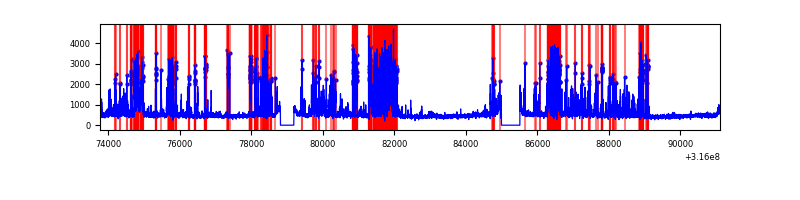 |
| B | 17332 | 16443 | 5 | 5 | 0.03% | 0.03% | 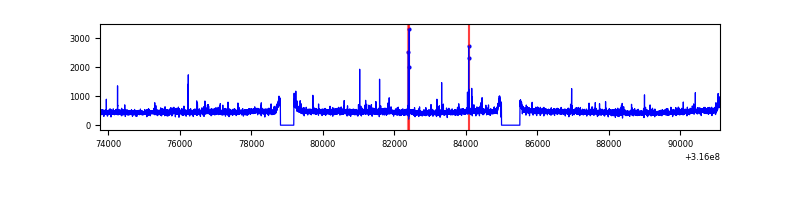 |
| C | 17332 | 16443 | 3 | 3 | 0.02% | 0.02% | 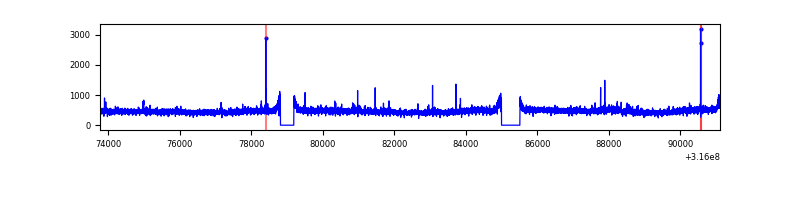 |
| D | 17332 | 16443 | 487 | 487 | 2.81% | 2.96% | 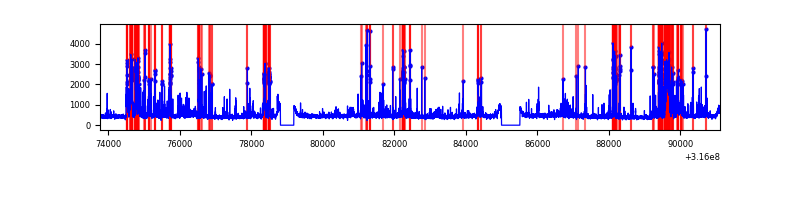 |
Top three noisy pixels from each quadrant. If the there are fewer than three noisy pixels in the level2.evt file, extra rows are filled as -1
| Pixel properties | Quadrant properties | ||||||
|---|---|---|---|---|---|---|---|
| Quadrant | DetID | PixID | Counts | Sigma | Mean | Median | Sigma |
| A | 6 | 16 | 4692567 | 12595.72 | 1858 | 1817 | 372.4 |
| A | 4 | 2 | 31654 | 80.12 | 1858 | 1817 | 372.4 |
| A | 13 | 254 | 26095 | 65.19 | 1858 | 1817 | 372.4 |
| B | 0 | 189 | 54258 | 146.2 | 1907 | 1859 | 358.4 |
| B | 0 | 190 | 47695 | 127.88 | 1907 | 1859 | 358.4 |
| B | 12 | 111 | 44649 | 119.39 | 1907 | 1859 | 358.4 |
| C | 14 | 238 | 289340 | 673.45 | 1834 | 1839 | 426.9 |
| C | 8 | 208 | 114496 | 263.89 | 1834 | 1839 | 426.9 |
| C | 0 | 207 | 41302 | 92.44 | 1834 | 1839 | 426.9 |
| D | 12 | 233 | 1029956 | 2296.94 | 1841 | 1780 | 447.6 |
| D | 1 | 52 | 746201 | 1663.03 | 1841 | 1780 | 447.6 |
| D | 13 | 172 | 398630 | 886.56 | 1841 | 1780 | 447.6 |
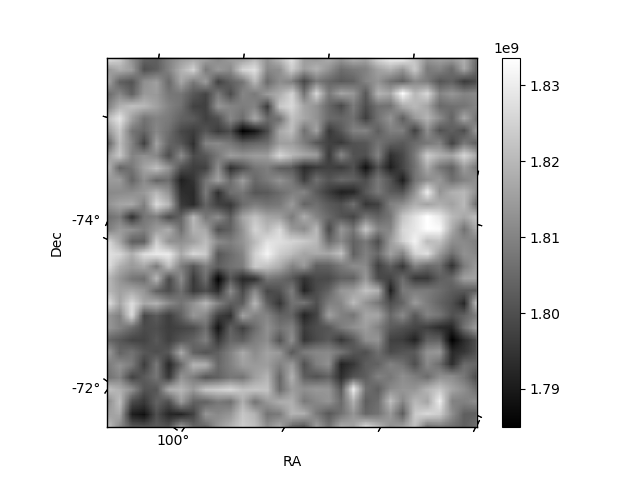
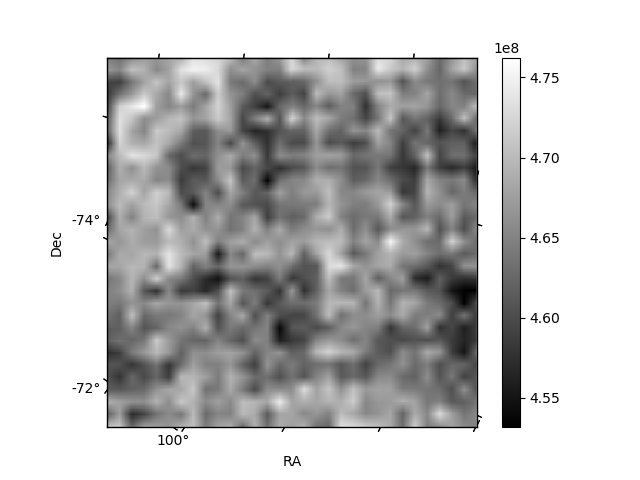
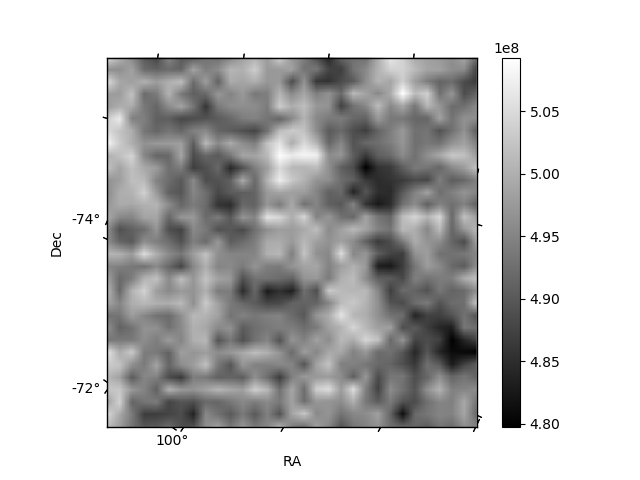
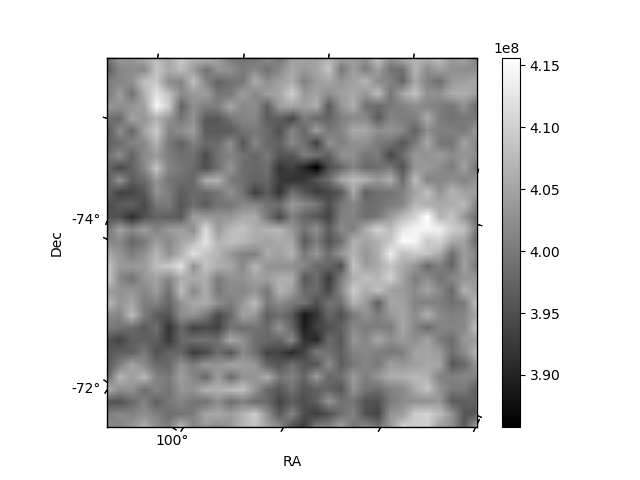
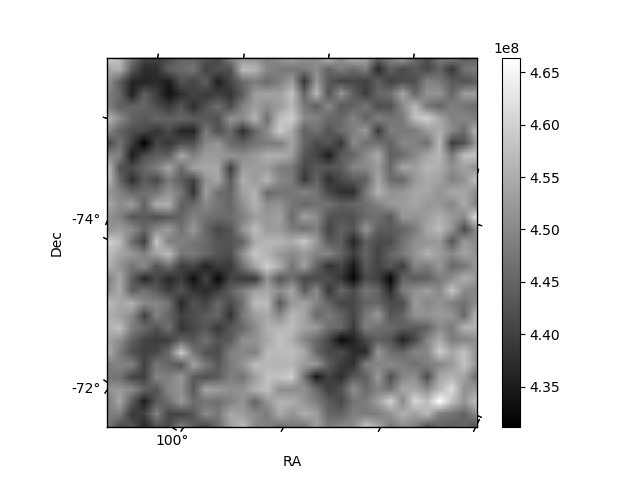
Histogram calculated using DETX and DETY for each event in the final _common_clean file
| Quadrant A | 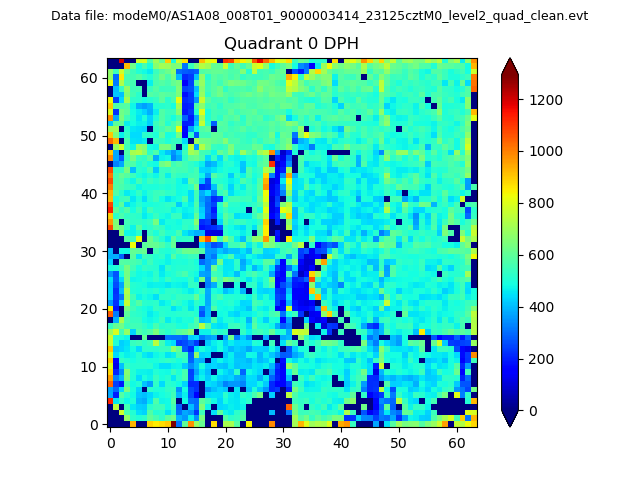 |
 |
Quadrant B |
|---|---|---|---|
| Quadrant D | 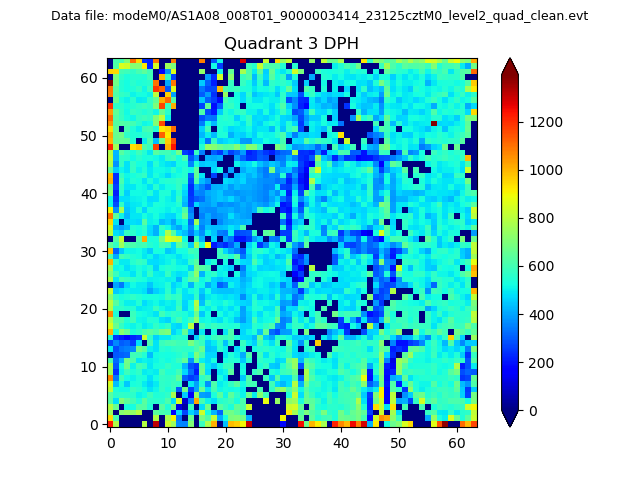 |
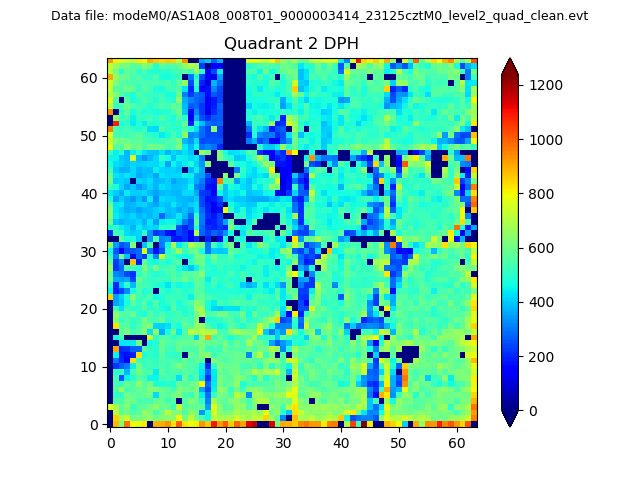 |
Quadrant C |
| Plot type | Count rate plots | Images |
|---|---|---|
| Comparison with Poisson distribution Blue bars denote a histogram of data divided into 1 sec bins. Red curve is a Poisson curve with rate = median count rate of data. |
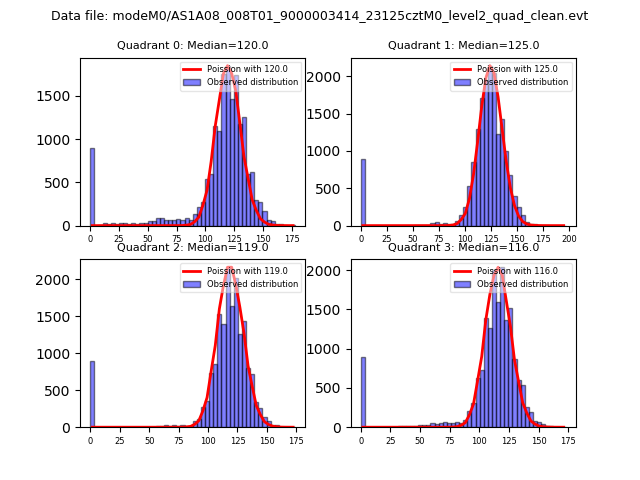 |
 |
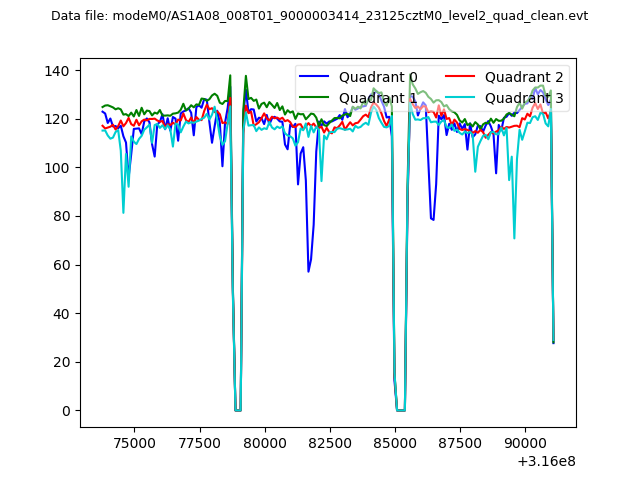
| Quadrant-wise count rates Data is divided into 100 sec bins |
 |
|
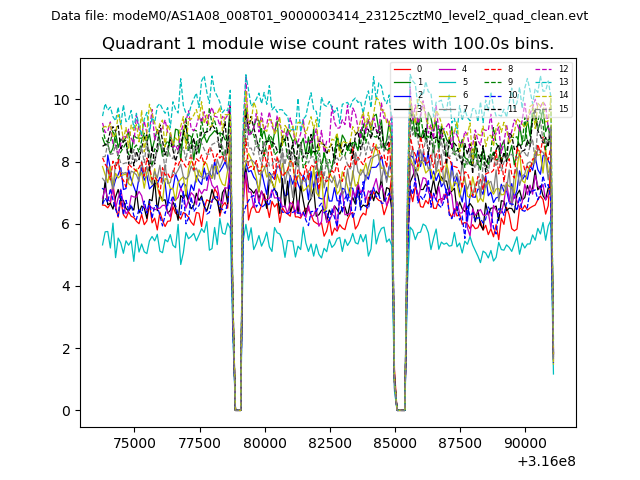
| Module-wise count rates for Quadrant A Data is divided into 100 sec bins |
 |
 |
| Module-wise count rates for Quadrant B Data is divided into 100 sec bins |
 |
 |
| Module-wise count rates for Quadrant C Data is divided into 100 sec bins |
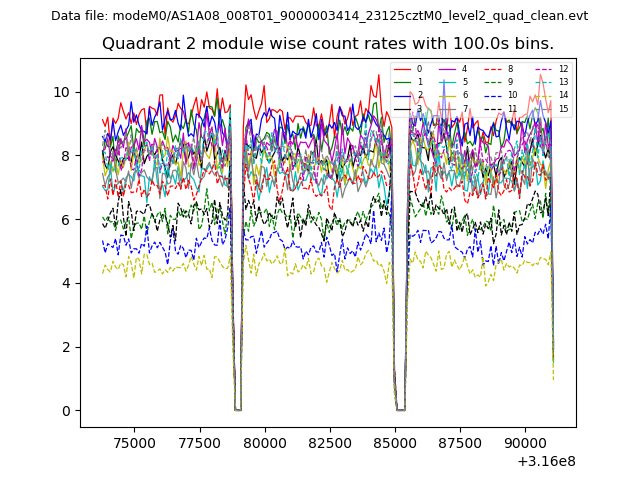 |
 |
| Module-wise count rates for Quadrant D Data is divided into 100 sec bins |
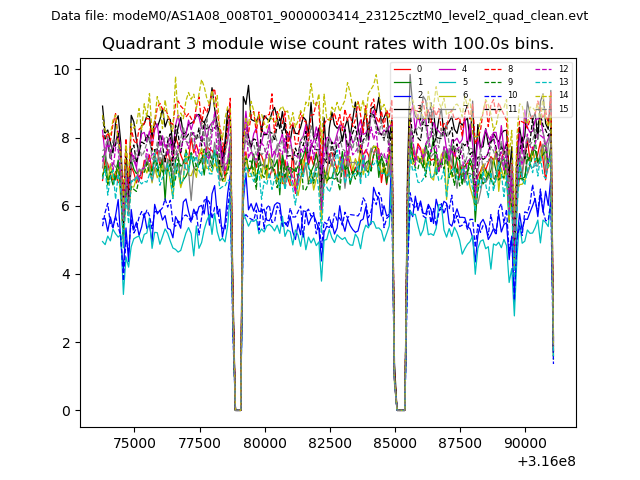 |
 |
| Parameter | Plot |
|---|---|
| CZT HV Monitor | 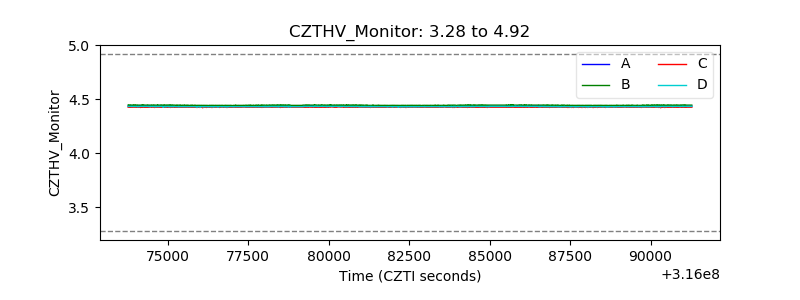 |
| D_VDD | 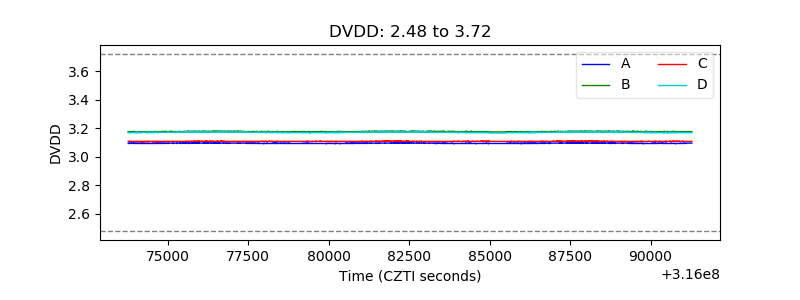 |
| Temperature 1 |  |
| Veto HV Monitor | 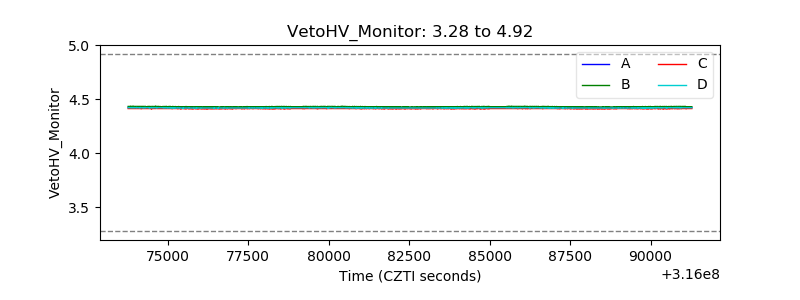 |
| Veto LLD | 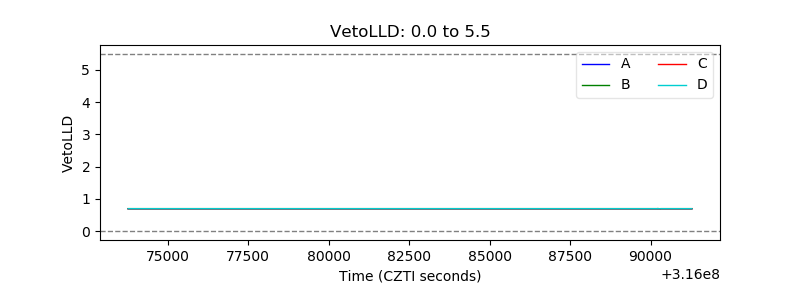 |
| Alpha Counter | 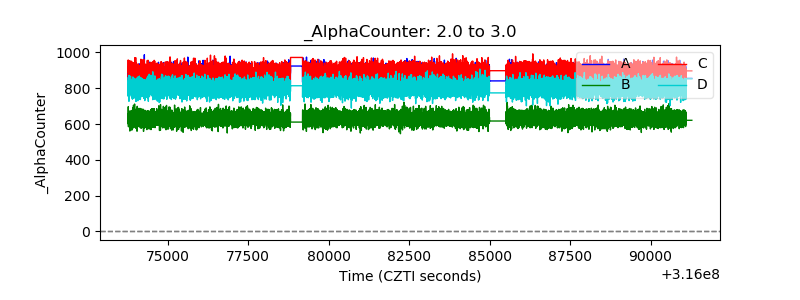 |
| _CPM_Rate | 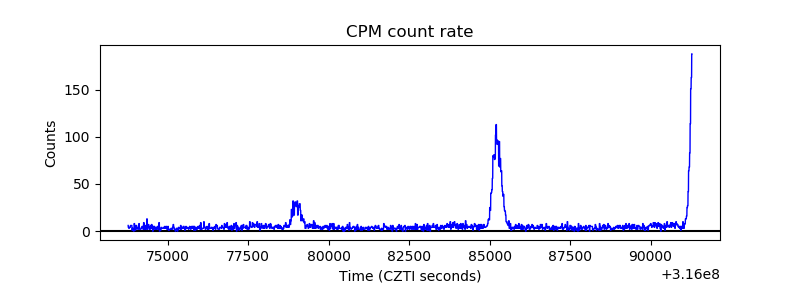 |
| CZT Counter | 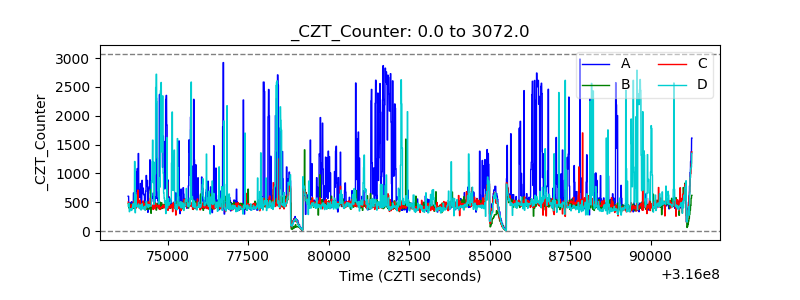 |
| +2.5 Volts monitor |  |
| +5 Volts monitor | 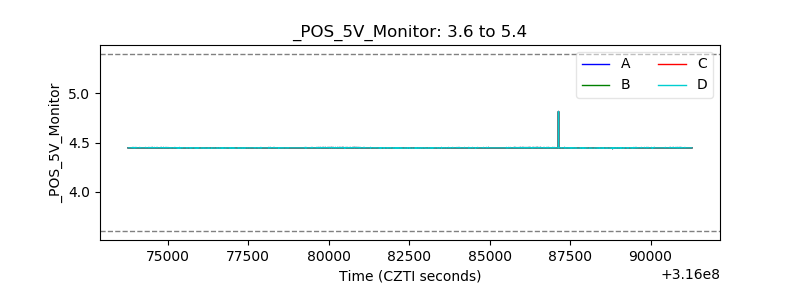 |
| _ROLL_ROT | 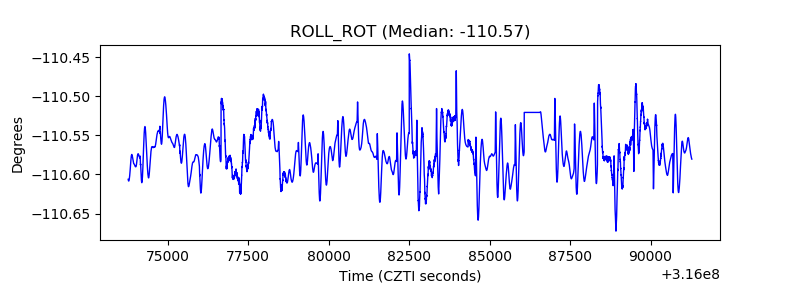 |
| _Roll_DEC | 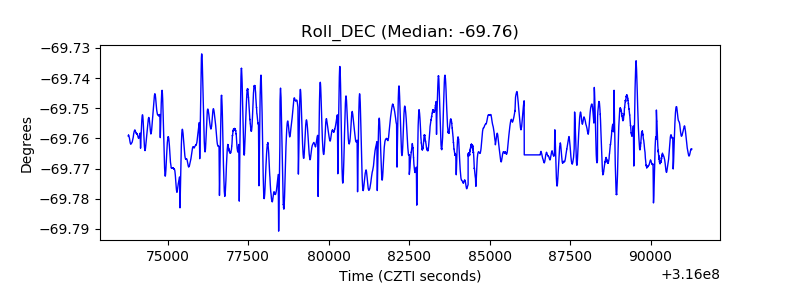 |
| _Roll_RA | 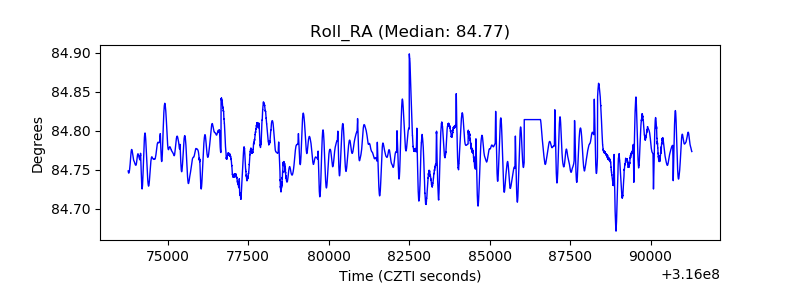 |
| Veto Counter | 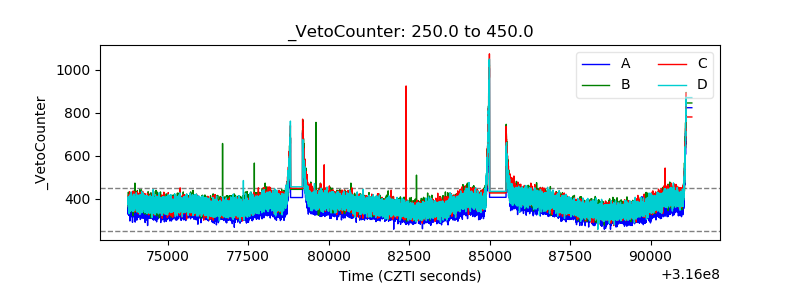 |