| Param | Original file | Final file |
|---|---|---|
| Filename | modeM0/AS1A08_008T01_9000003414_23128cztM0_level2.evt | modeM0/AS1A08_008T01_9000003414_23128cztM0_level2_quad_clean.evt |
| Size (bytes) | 961,606,080 | 230,166,720 |
| Size | 917.1 MB | 219.5 MB |
| Events in quadrant A | 6,627,620 | 1,584,534 |
| Events in quadrant B | 5,851,951 | 1,615,332 |
| Events in quadrant C | 9,154,510 | 1,437,422 |
| Events in quadrant D | 6,663,812 | 1,491,034 |
| Mode M0 | |||
|---|---|---|---|
| Quadrant | BADHDUFLAG | Total packets | Discarded packets |
| A | 0 | 27948 | 3 |
| B | 0 | 25509 | 3 |
| C | 0 | 35250 | 3 |
| D | 0 | 28492 | 3 |
| Mode M9 | |||
|---|---|---|---|
| Quadrant | BADHDUFLAG | Total packets | Discarded packets |
| A | 0 | 26 | 0 |
| B | 0 | 26 | 0 |
| C | 0 | 26 | 0 |
| D | 0 | 26 | 0 |
| Mode SS | |||
|---|---|---|---|
| Quadrant | BADHDUFLAG | Total packets | Discarded packets |
| A | 0 | 254 | 0 |
| B | 0 | 254 | 0 |
| C | 0 | 254 | 0 |
| D | 0 | 254 | 0 |
| Quadrant | Total seconds | Saturated seconds | Saturation percentage |
|---|---|---|---|
| A | 12175 | 333 | 2.735113% |
| B | 12176 | 133 | 1.092313% |
| C | 12176 | 1167 | 9.584428% |
| D | 12176 | 254 | 2.086071% |
Noise dominated data is calculated using 1-second bins in cleaned event files. If a bin has >2000 counts, and if more than 50% of those come from <1% of pixels, then it is considered to be noise-dominated and hence unusable.
| Quadrant | # 1 sec bins | Bins with >0 counts | Bins with >2000 counts | High rate bins dominated by noise | Noise dominated (total time) | Noise dominated (detector-on time) | Marked lightcurve |
|---|---|---|---|---|---|---|---|
| A | 14910 | 12175 | 139 | 139 | 0.93% | 1.14% | 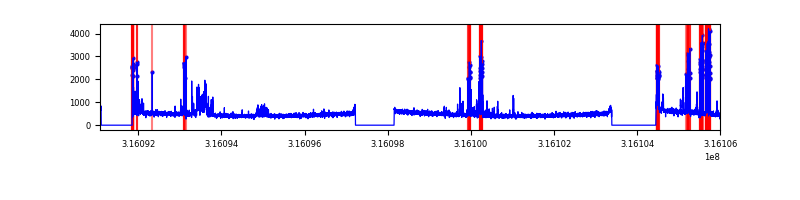 |
| B | 14911 | 12176 | 1 | 1 | 0.01% | 0.01% | 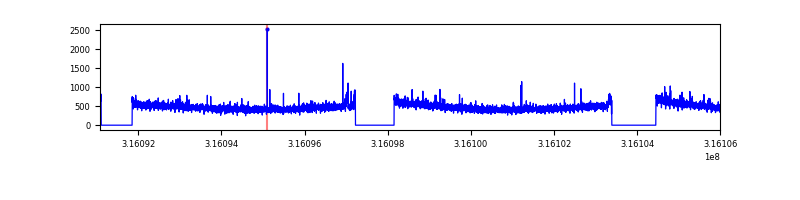 |
| C | 14910 | 12175 | 838 | 838 | 5.62% | 6.88% | 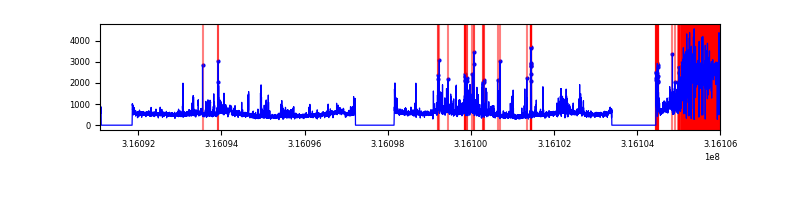 |
| D | 14911 | 12177 | 142 | 142 | 0.95% | 1.17% | 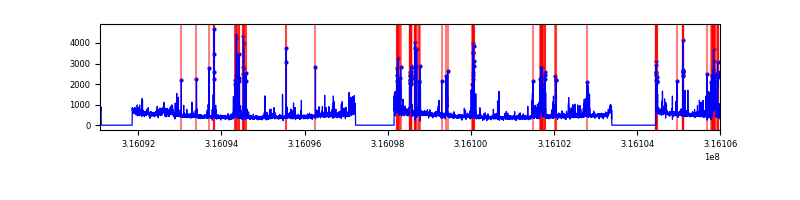 |
Top three noisy pixels from each quadrant. If the there are fewer than three noisy pixels in the level2.evt file, extra rows are filled as -1
| Pixel properties | Quadrant properties | ||||||
|---|---|---|---|---|---|---|---|
| Quadrant | DetID | PixID | Counts | Sigma | Mean | Median | Sigma |
| A | 6 | 16 | 989299 | 3358.98 | 1463 | 1430 | 294.1 |
| A | 13 | 254 | 19302 | 60.77 | 1463 | 1430 | 294.1 |
| A | 0 | 226 | 12828 | 38.76 | 1463 | 1430 | 294.1 |
| B | 0 | 190 | 56465 | 201.58 | 1464 | 1429 | 273.0 |
| B | 12 | 111 | 32567 | 114.05 | 1464 | 1429 | 273.0 |
| B | 11 | 111 | 28422 | 98.87 | 1464 | 1429 | 273.0 |
| C | 8 | 208 | 3187134 | 10358.19 | 1330 | 1337 | 307.6 |
| C | 0 | 10 | 432700 | 1402.52 | 1330 | 1337 | 307.6 |
| C | 14 | 238 | 211878 | 684.54 | 1330 | 1337 | 307.6 |
| D | 1 | 52 | 411959 | 1206.59 | 1414 | 1373 | 340.3 |
| D | 12 | 233 | 391550 | 1146.62 | 1414 | 1373 | 340.3 |
| D | 7 | 38 | 176857 | 515.7 | 1414 | 1373 | 340.3 |
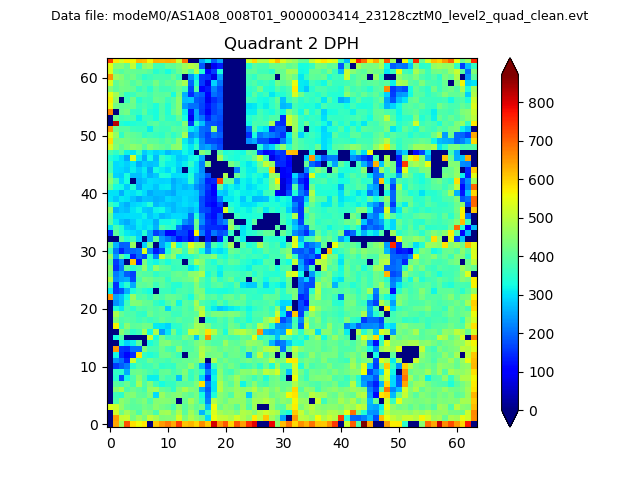
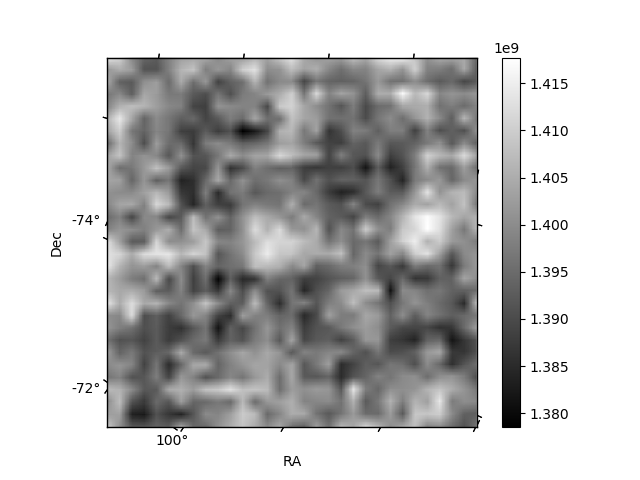
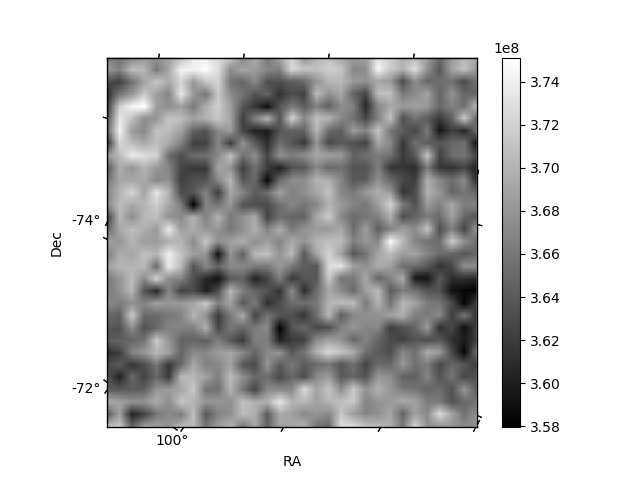
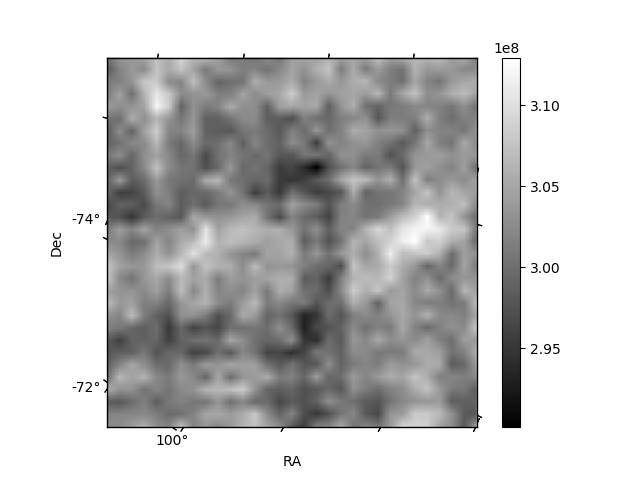
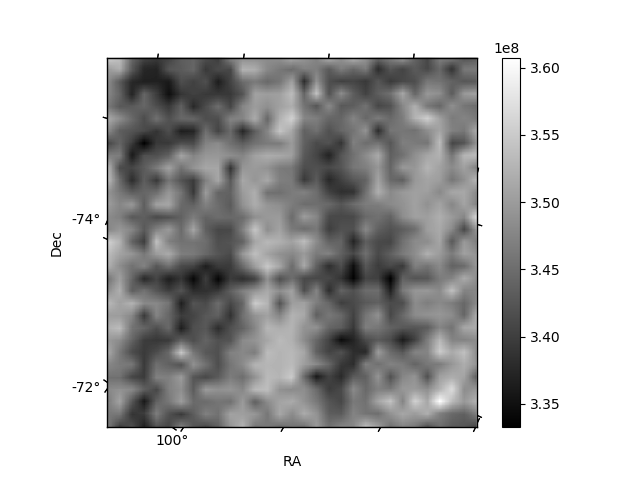
Histogram calculated using DETX and DETY for each event in the final _common_clean file
| Quadrant A | 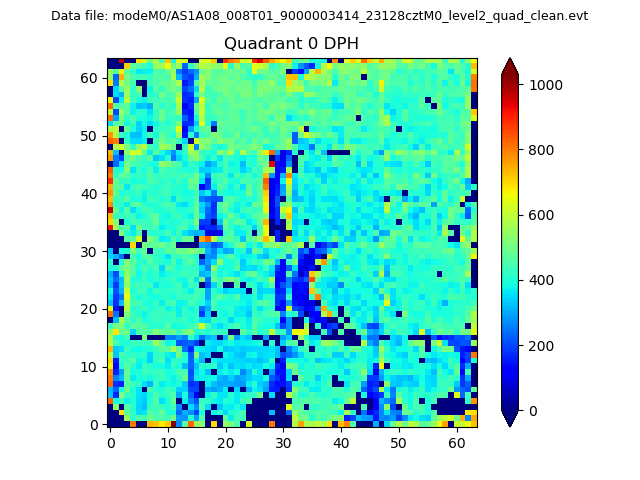 |
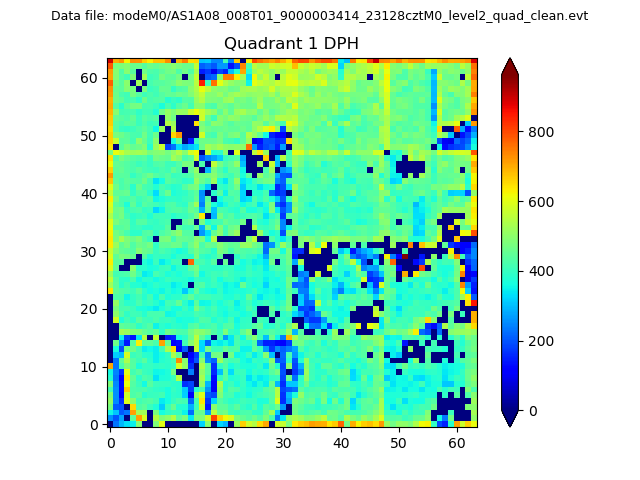 |
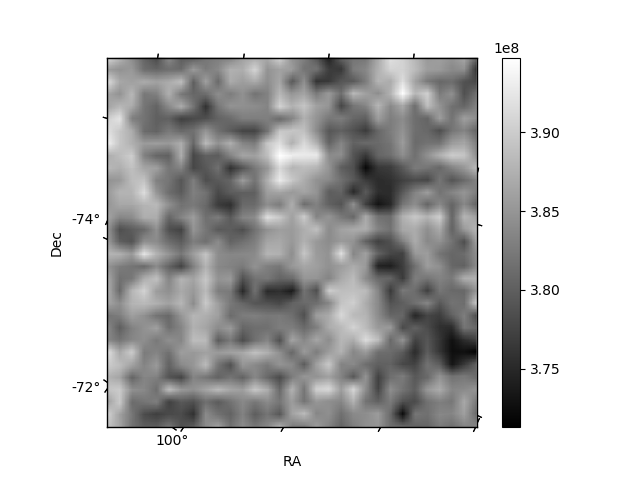
Quadrant B |
|---|---|---|---|
| Quadrant D | 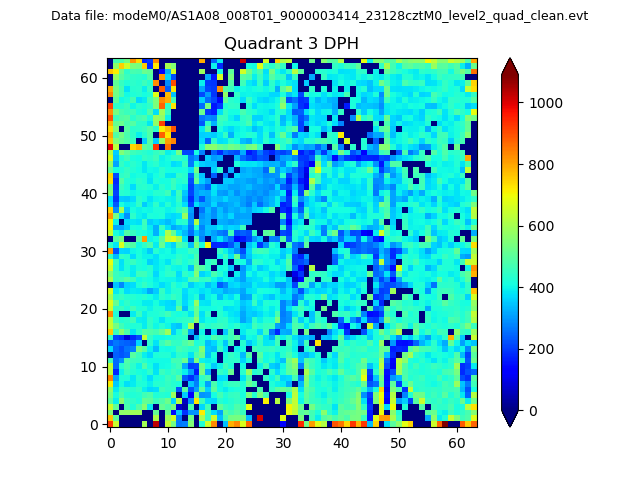 |
 |
Quadrant C |
| Plot type | Count rate plots | Images |
|---|---|---|
| Comparison with Poisson distribution Blue bars denote a histogram of data divided into 1 sec bins. Red curve is a Poisson curve with rate = median count rate of data. |
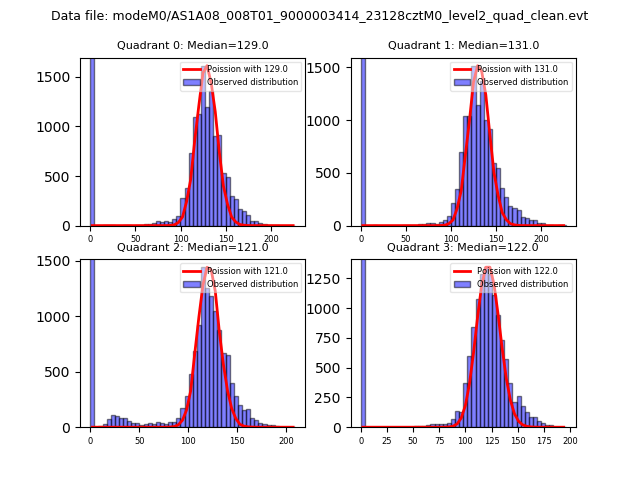 |
 |
| Quadrant-wise count rates Data is divided into 100 sec bins |
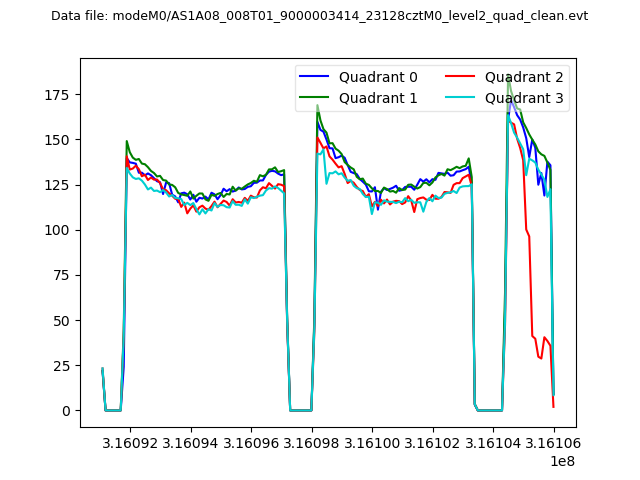 |
|
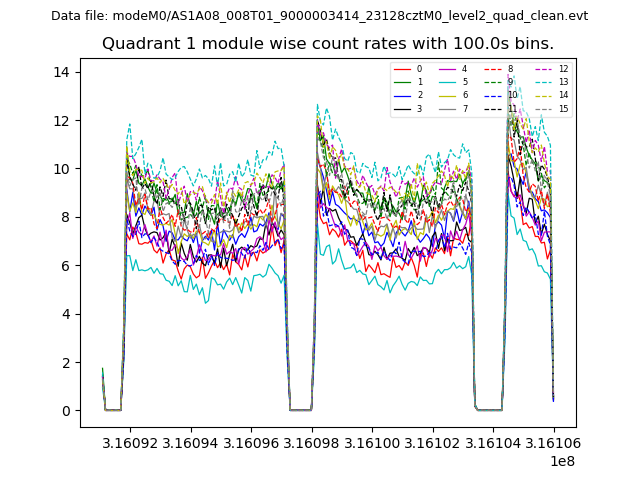
| Module-wise count rates for Quadrant A Data is divided into 100 sec bins |
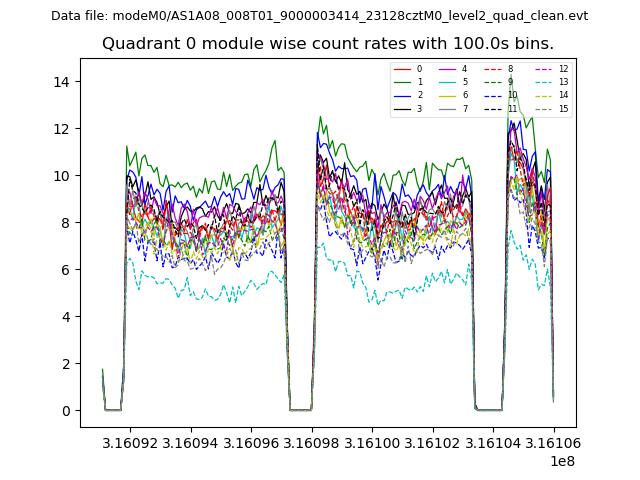 |
 |
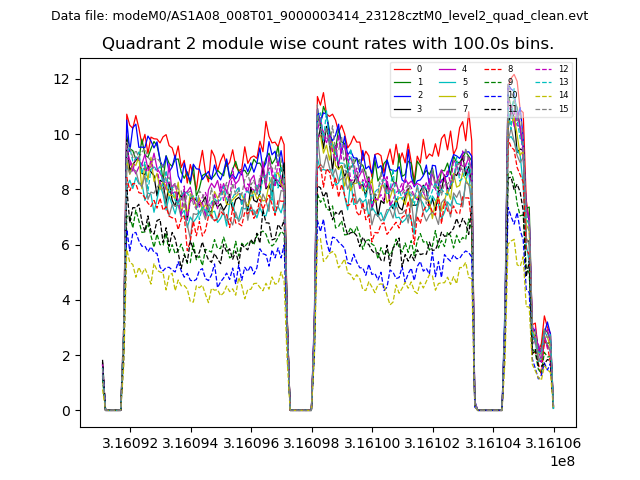
| Module-wise count rates for Quadrant B Data is divided into 100 sec bins |
 |
 |
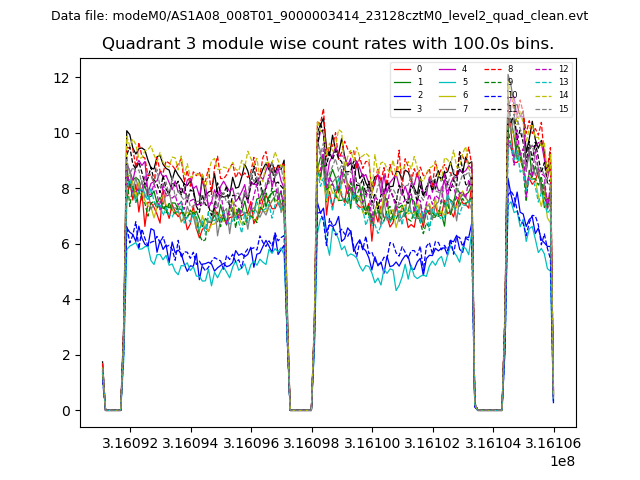
| Module-wise count rates for Quadrant C Data is divided into 100 sec bins |
 |
 |
| Module-wise count rates for Quadrant D Data is divided into 100 sec bins |
 |
 |
| Parameter | Plot |
|---|---|
| CZT HV Monitor | 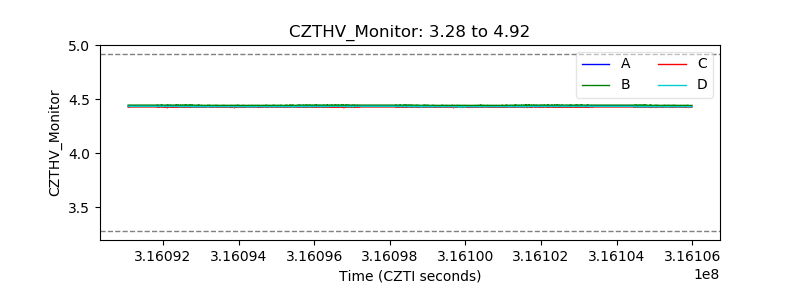 |
| D_VDD | 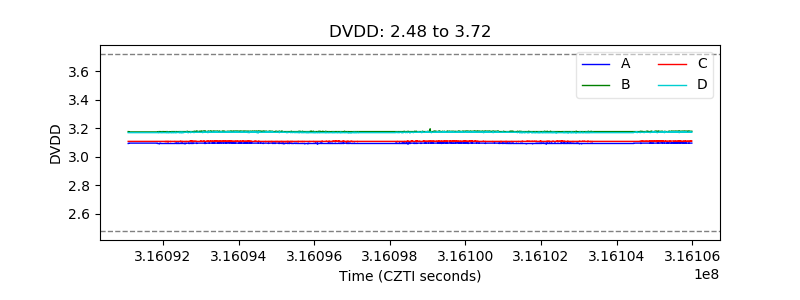 |
| Temperature 1 | 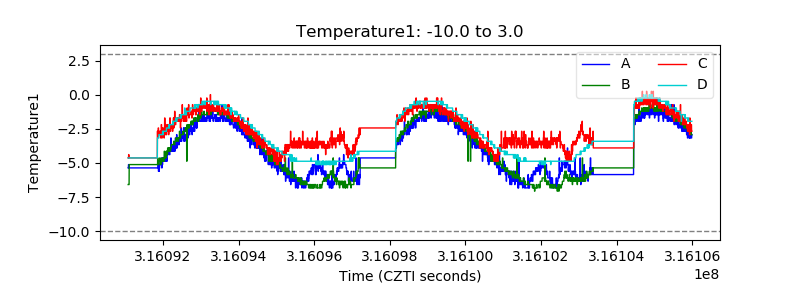 |
| Veto HV Monitor | 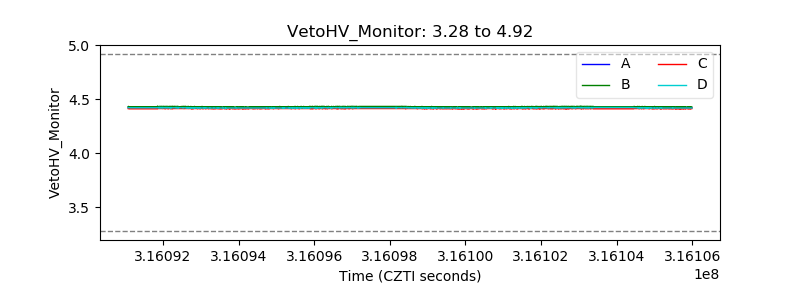 |
| Veto LLD | 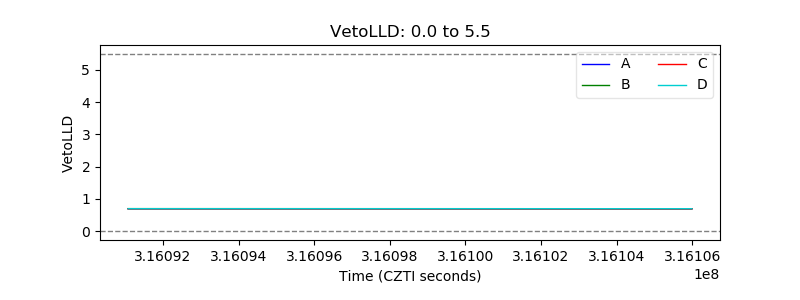 |
| Alpha Counter | 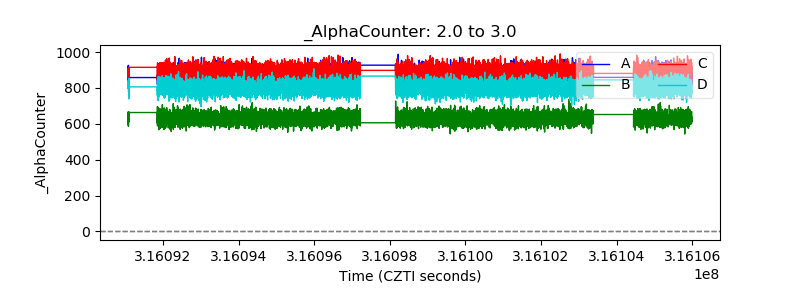 |
| _CPM_Rate | 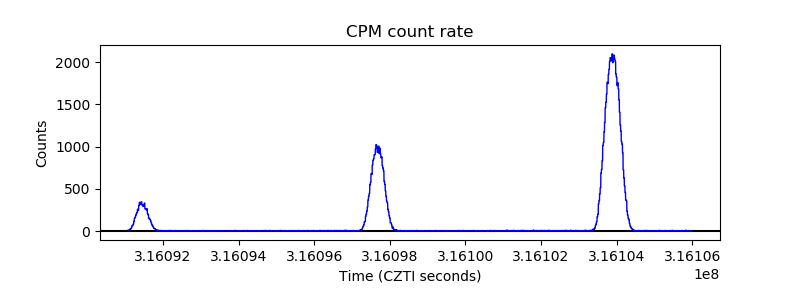 |
| CZT Counter | 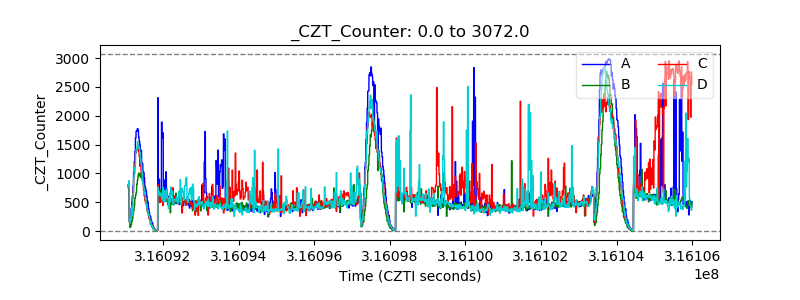 |
| +2.5 Volts monitor |  |
| +5 Volts monitor |  |
| _ROLL_ROT | 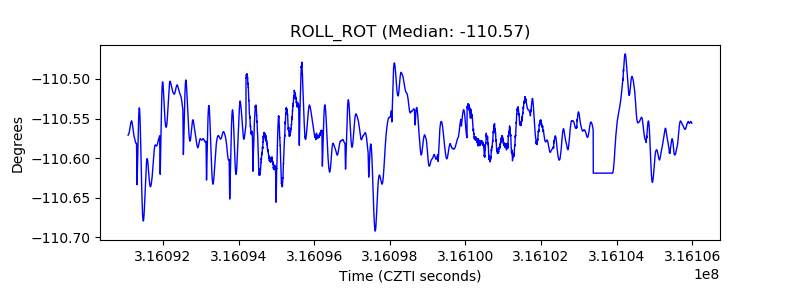 |
| _Roll_DEC | 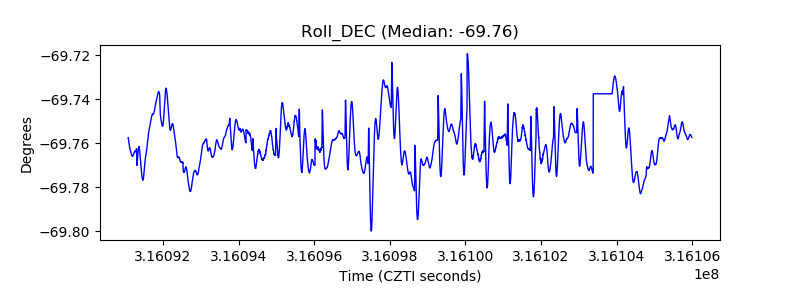 |
| _Roll_RA | 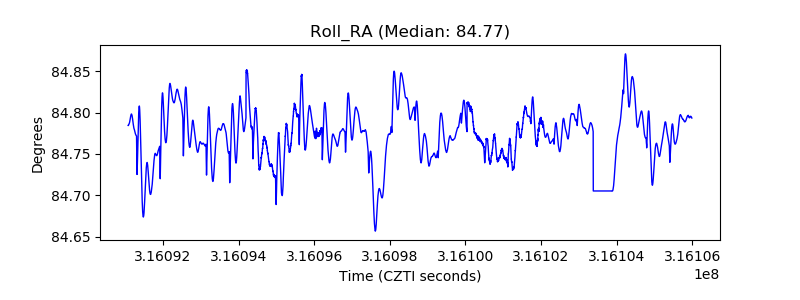 |
| Veto Counter | 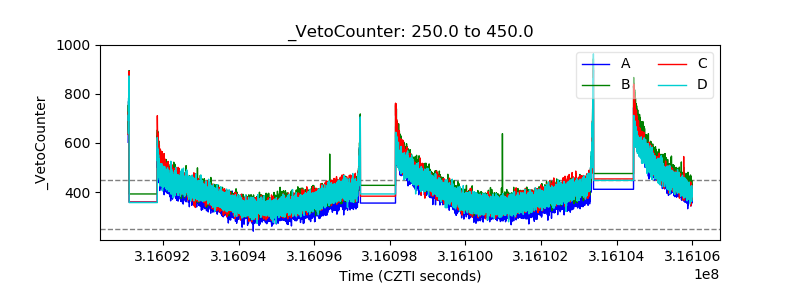 |