| Param | Original file | Final file |
|---|---|---|
| Filename | modeM0/AS1T03_173T01_9000003416_23128cztM0_level2.evt | modeM0/AS1T03_173T01_9000003416_23128cztM0_level2_quad_clean.evt |
| Size (bytes) | 308,070,720 | 55,440,000 |
| Size | 293.8 MB | 52.9 MB |
| Events in quadrant A | 2,865,504 | 361,431 |
| Events in quadrant B | 1,730,727 | 385,853 |
| Events in quadrant C | 2,734,450 | 338,500 |
| Events in quadrant D | 1,777,613 | 362,113 |
| Mode M9 | |||
|---|---|---|---|
| Quadrant | BADHDUFLAG | Total packets | Discarded packets |
| A | 0 | 12 | 0 |
| B | 0 | 12 | 0 |
| C | 0 | 12 | 0 |
| D | 0 | 12 | 0 |
| Mode M0 | |||
|---|---|---|---|
| Quadrant | BADHDUFLAG | Total packets | Discarded packets |
| A | 0 | 10727 | 1 |
| B | 0 | 7377 | 1 |
| C | 0 | 10354 | 2 |
| D | 0 | 7706 | 1 |
| Mode SS | |||
|---|---|---|---|
| Quadrant | BADHDUFLAG | Total packets | Discarded packets |
| A | 0 | 66 | 0 |
| B | 0 | 66 | 0 |
| C | 0 | 66 | 0 |
| D | 0 | 66 | 0 |
| Quadrant | Total seconds | Saturated seconds | Saturation percentage |
|---|---|---|---|
| A | 3247 | 464 | 14.290114% |
| B | 3247 | 65 | 2.001848% |
| C | 3246 | 501 | 15.434381% |
| D | 3246 | 77 | 2.372150% |
Noise dominated data is calculated using 1-second bins in cleaned event files. If a bin has >2000 counts, and if more than 50% of those come from <1% of pixels, then it is considered to be noise-dominated and hence unusable.
| Quadrant | # 1 sec bins | Bins with >0 counts | Bins with >2000 counts | High rate bins dominated by noise | Noise dominated (total time) | Noise dominated (detector-on time) | Marked lightcurve |
|---|---|---|---|---|---|---|---|
| A | 4432 | 3247 | 297 | 297 | 6.70% | 9.15% | 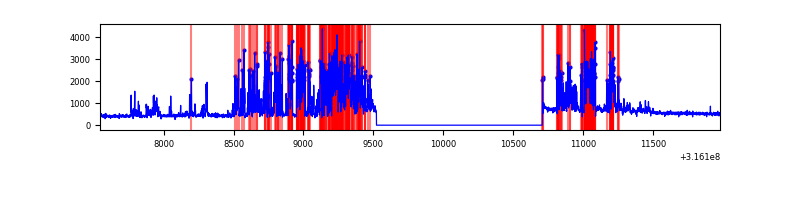 |
| B | 4432 | 3247 | 2 | 2 | 0.05% | 0.06% | 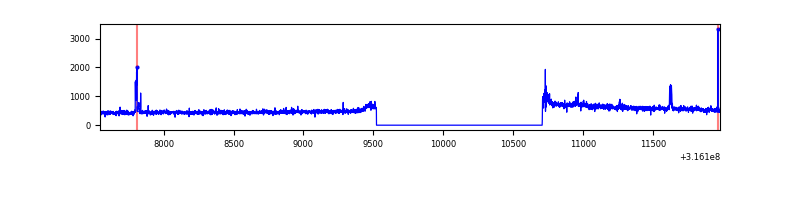 |
| C | 4431 | 3246 | 271 | 271 | 6.12% | 8.35% | 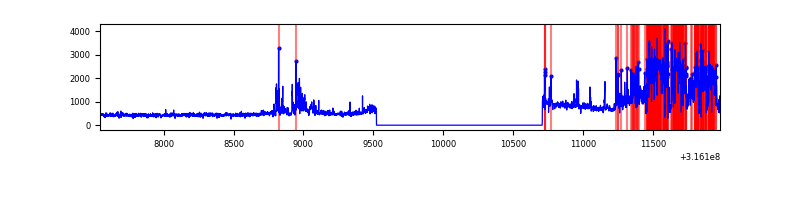 |
| D | 4431 | 3246 | 26 | 26 | 0.59% | 0.80% | 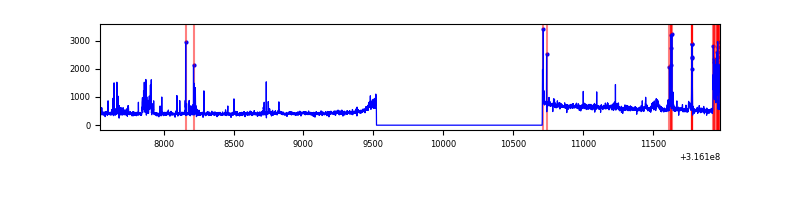 |
Top three noisy pixels from each quadrant. If the there are fewer than three noisy pixels in the level2.evt file, extra rows are filled as -1
| Pixel properties | Quadrant properties | ||||||
|---|---|---|---|---|---|---|---|
| Quadrant | DetID | PixID | Counts | Sigma | Mean | Median | Sigma |
| A | 6 | 16 | 1289062 | 15622.28 | 408 | 401 | 82.5 |
| A | 13 | 254 | 4891 | 54.43 | 408 | 401 | 82.5 |
| A | 0 | 226 | 3602 | 38.81 | 408 | 401 | 82.5 |
| B | 0 | 190 | 33625 | 415.01 | 427 | 417 | 80.0 |
| B | 5 | 172 | 18629 | 227.6 | 427 | 417 | 80.0 |
| B | 12 | 111 | 9210 | 109.88 | 427 | 417 | 80.0 |
| C | 8 | 208 | 1098796 | 12061.5 | 390 | 392 | 91.1 |
| C | 14 | 238 | 62135 | 678.0 | 390 | 392 | 91.1 |
| C | 2 | 16 | 29141 | 315.69 | 390 | 392 | 91.1 |
| D | 2 | 82 | 58549 | 579.61 | 415 | 404 | 100.3 |
| D | 13 | 153 | 57447 | 568.63 | 415 | 404 | 100.3 |
| D | 12 | 233 | 22260 | 217.87 | 415 | 404 | 100.3 |
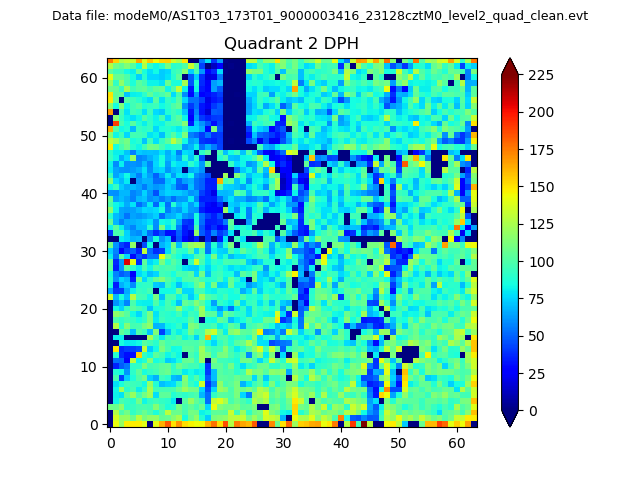
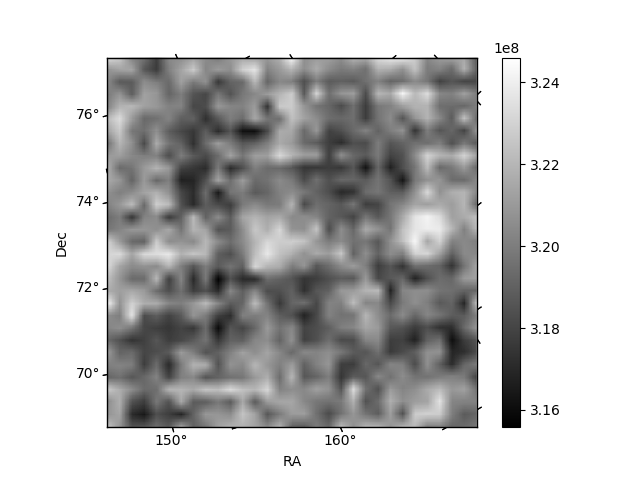
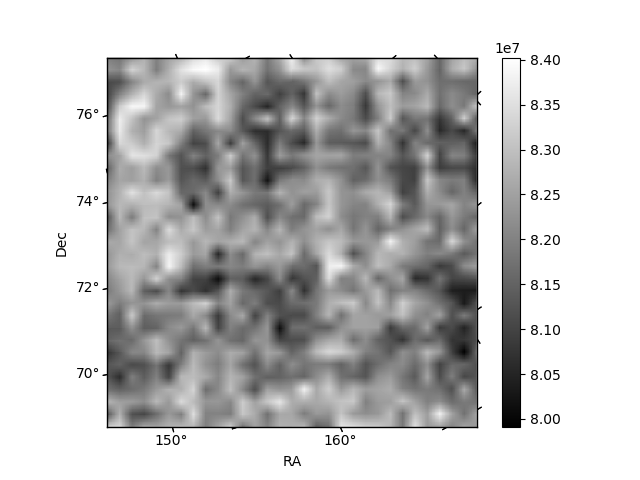
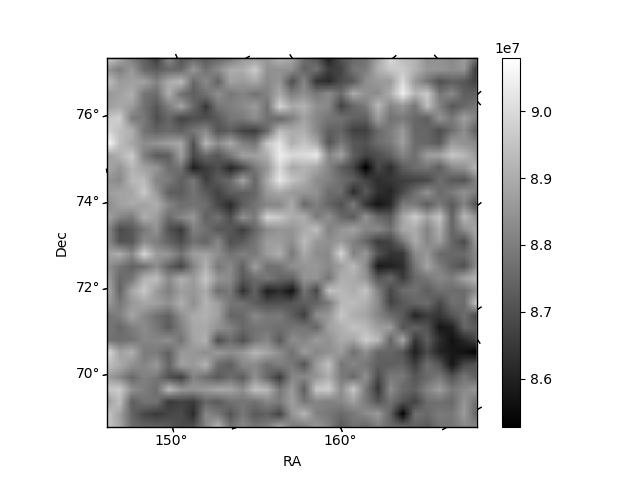
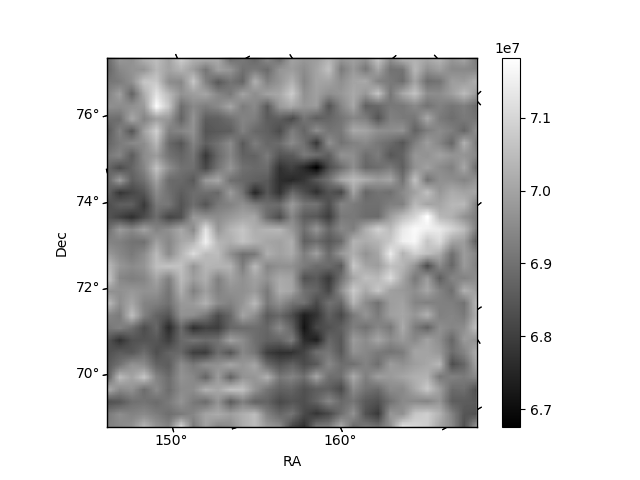
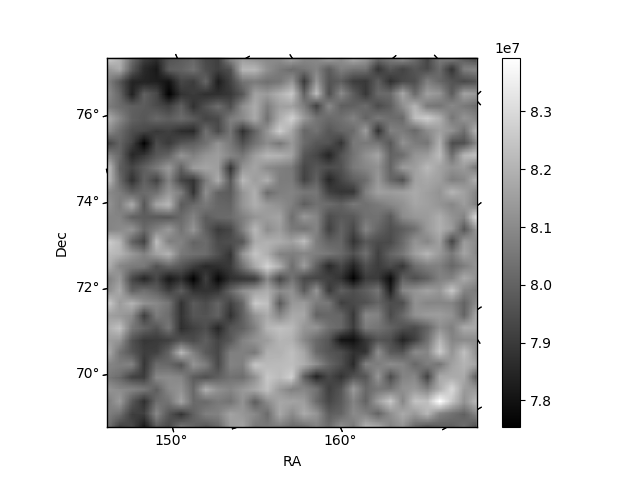
Histogram calculated using DETX and DETY for each event in the final _common_clean file
| Quadrant A | 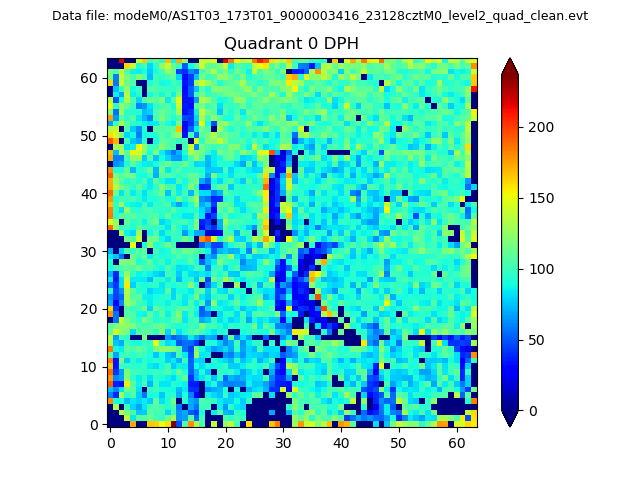 |
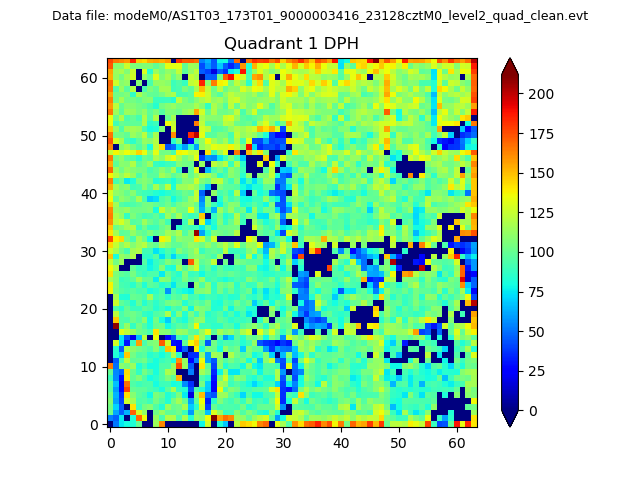 |
Quadrant B |
|---|---|---|---|
| Quadrant D | 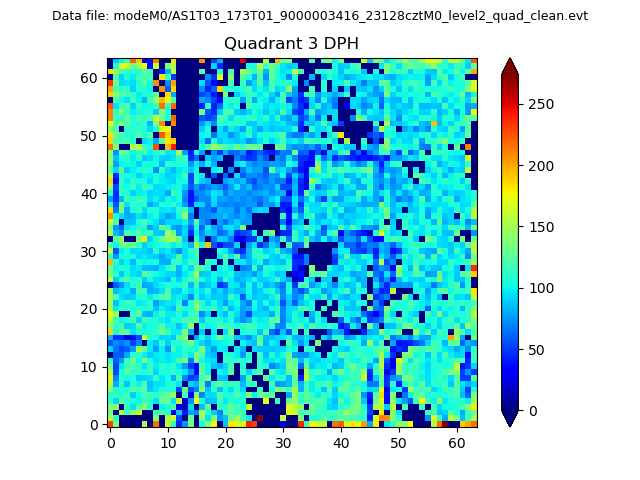 |
 |
Quadrant C |
| Plot type | Count rate plots | Images |
|---|---|---|
| Comparison with Poisson distribution Blue bars denote a histogram of data divided into 1 sec bins. Red curve is a Poisson curve with rate = median count rate of data. |
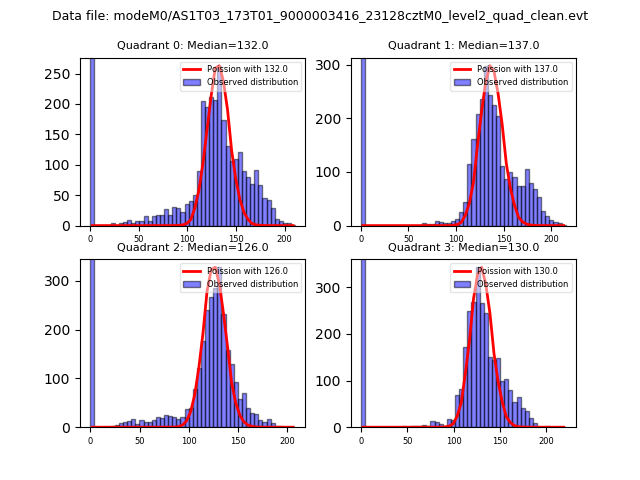 |
 |
| Quadrant-wise count rates Data is divided into 100 sec bins |
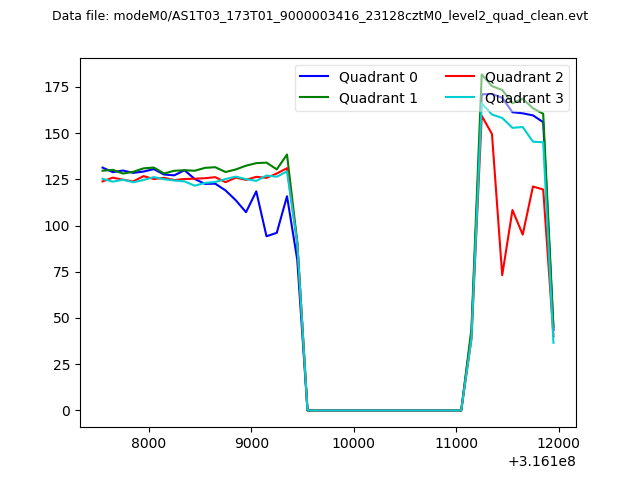 |
|
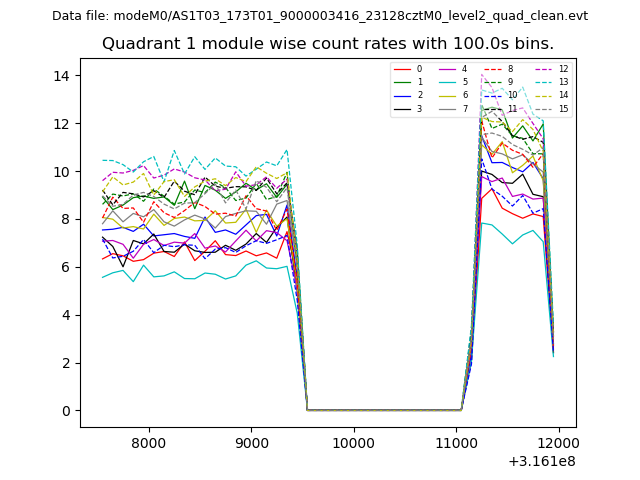
| Module-wise count rates for Quadrant A Data is divided into 100 sec bins |
 |
 |
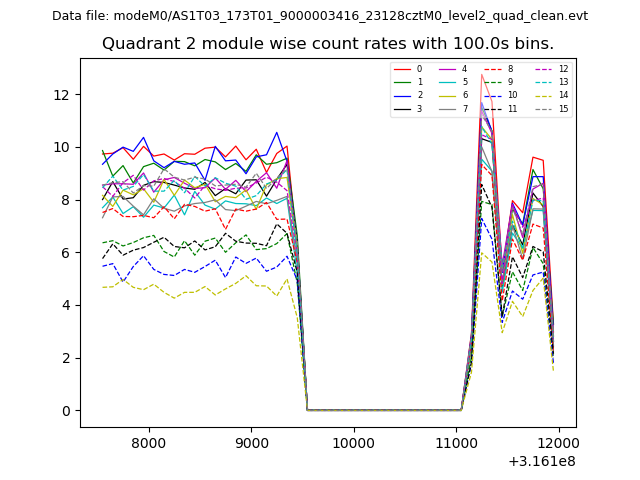
| Module-wise count rates for Quadrant B Data is divided into 100 sec bins |
 |
 |
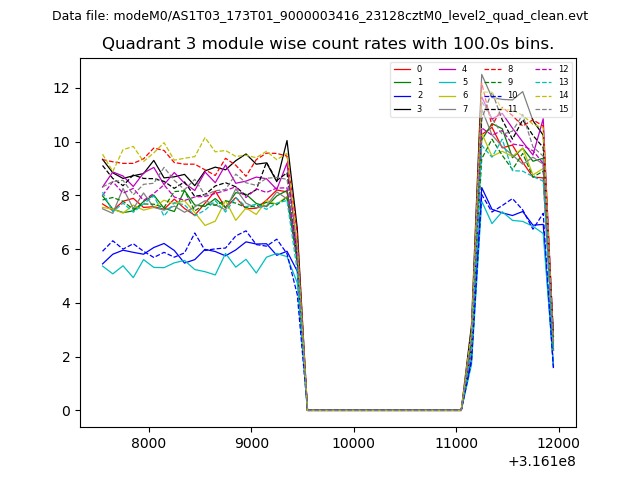
| Module-wise count rates for Quadrant C Data is divided into 100 sec bins |
 |
 |
| Module-wise count rates for Quadrant D Data is divided into 100 sec bins |
 |
 |
| Parameter | Plot |
|---|---|
| CZT HV Monitor | 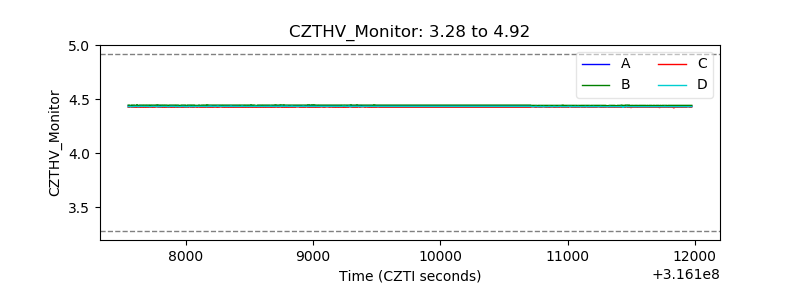 |
| D_VDD | 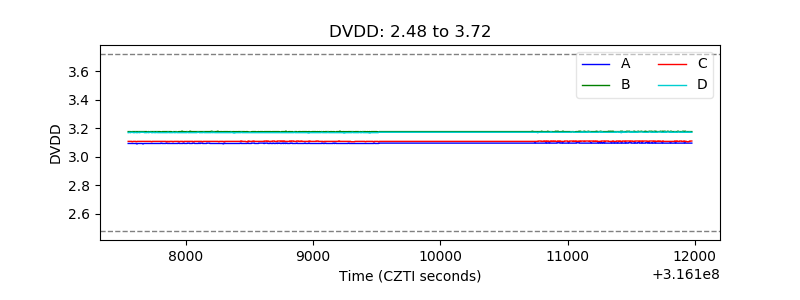 |
| Temperature 1 | 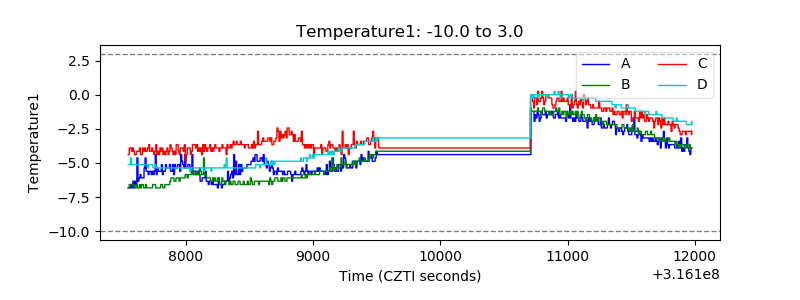 |
| Veto HV Monitor | 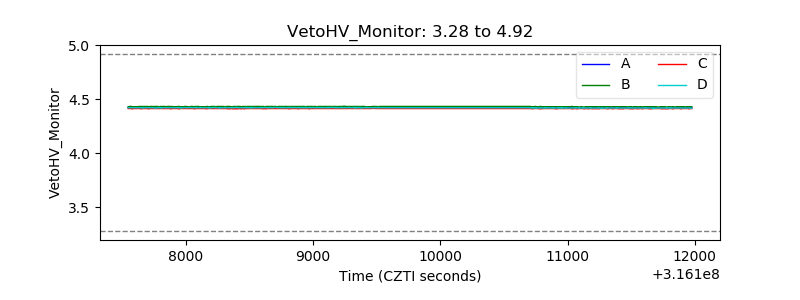 |
| Veto LLD | 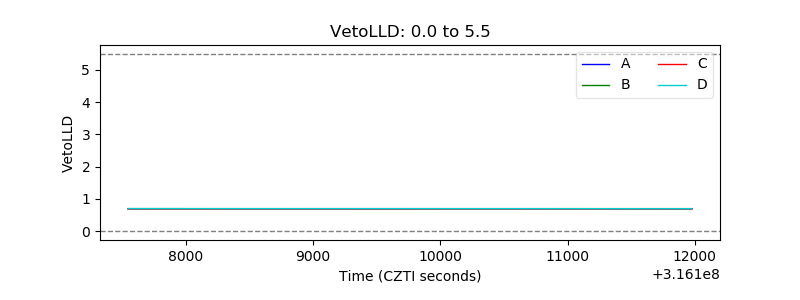 |
| Alpha Counter |  |
| _CPM_Rate | 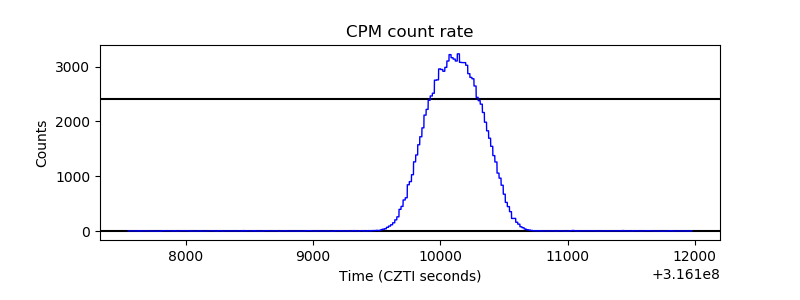 |
| CZT Counter | 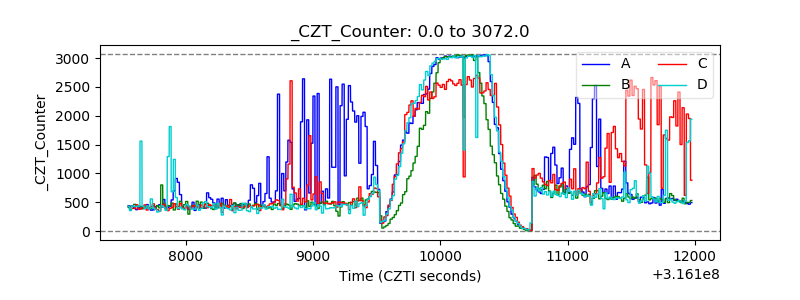 |
| +2.5 Volts monitor | 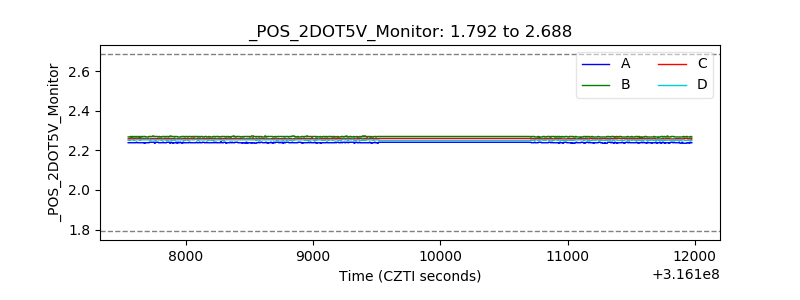 |
| +5 Volts monitor |  |
| _ROLL_ROT | 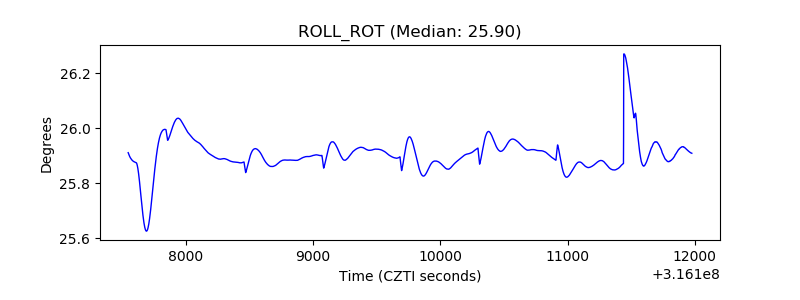 |
| _Roll_DEC | 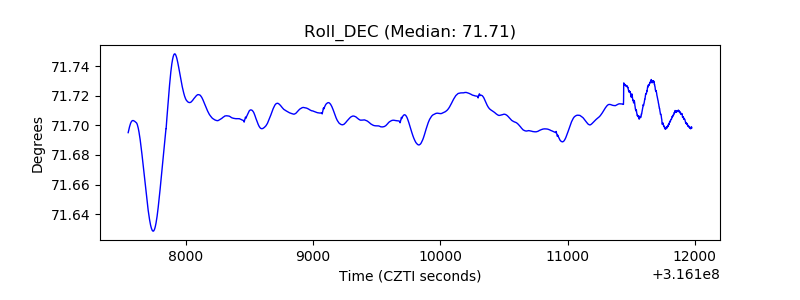 |
| _Roll_RA | 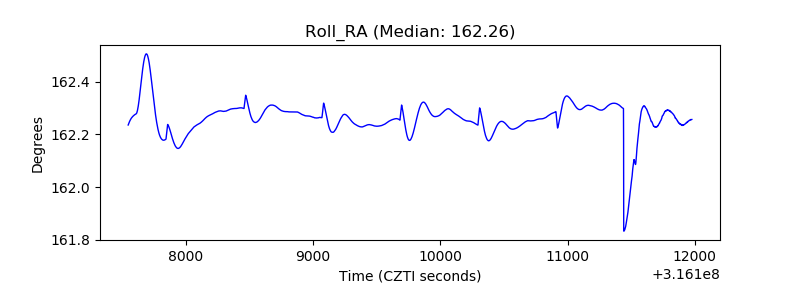 |
| Veto Counter | 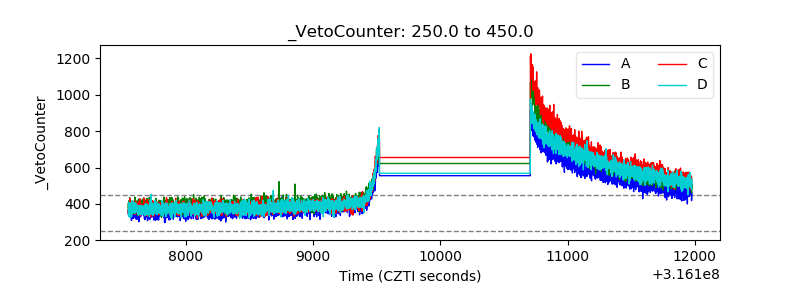 |