| Param | Original file | Final file |
|---|---|---|
| Filename | modeM0/AS1T03_173T01_9000003416_23130cztM0_level2.evt | modeM0/AS1T03_173T01_9000003416_23130cztM0_level2_quad_clean.evt |
| Size (bytes) | 513,570,240 | 136,477,440 |
| Size | 489.8 MB | 130.2 MB |
| Events in quadrant A | 3,221,044 | 935,803 |
| Events in quadrant B | 3,372,079 | 971,337 |
| Events in quadrant C | 4,947,608 | 891,608 |
| Events in quadrant D | 3,592,191 | 902,178 |
| Mode M9 | |||
|---|---|---|---|
| Quadrant | BADHDUFLAG | Total packets | Discarded packets |
| A | 0 | 16 | 0 |
| B | 0 | 17 | 0 |
| C | 0 | 17 | 0 |
| D | 0 | 17 | 0 |
| Mode M0 | |||
|---|---|---|---|
| Quadrant | BADHDUFLAG | Total packets | Discarded packets |
| A | 0 | 13661 | 2 |
| B | 0 | 14112 | 2 |
| C | 0 | 18804 | 3 |
| D | 0 | 14791 | 2 |
| Mode SS | |||
|---|---|---|---|
| Quadrant | BADHDUFLAG | Total packets | Discarded packets |
| A | 0 | 126 | 0 |
| B | 0 | 126 | 0 |
| C | 0 | 126 | 0 |
| D | 0 | 126 | 0 |
| Quadrant | Total seconds | Saturated seconds | Saturation percentage |
|---|---|---|---|
| A | 6201 | 66 | 1.064344% |
| B | 6201 | 73 | 1.177229% |
| C | 6200 | 709 | 11.435484% |
| D | 6200 | 90 | 1.451613% |
Noise dominated data is calculated using 1-second bins in cleaned event files. If a bin has >2000 counts, and if more than 50% of those come from <1% of pixels, then it is considered to be noise-dominated and hence unusable.
| Quadrant | # 1 sec bins | Bins with >0 counts | Bins with >2000 counts | High rate bins dominated by noise | Noise dominated (total time) | Noise dominated (detector-on time) | Marked lightcurve |
|---|---|---|---|---|---|---|---|
| A | 7591 | 6202 | 0 | 0 | 0.00% | 0.00% | 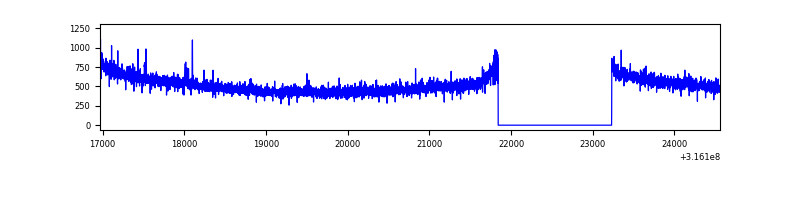 |
| B | 7591 | 6202 | 1 | 1 | 0.01% | 0.02% | 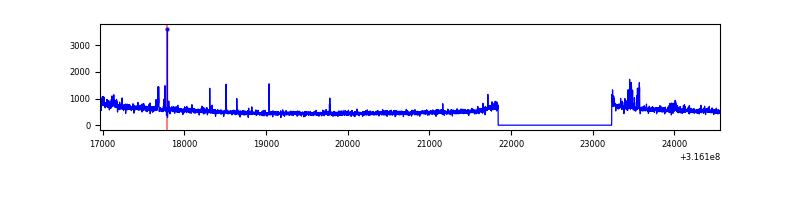 |
| C | 7590 | 6200 | 307 | 307 | 4.04% | 4.95% | 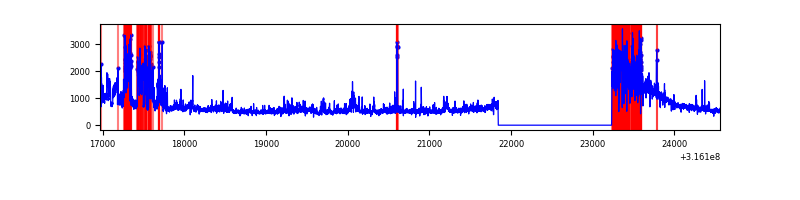 |
| D | 7590 | 6201 | 30 | 30 | 0.40% | 0.48% | 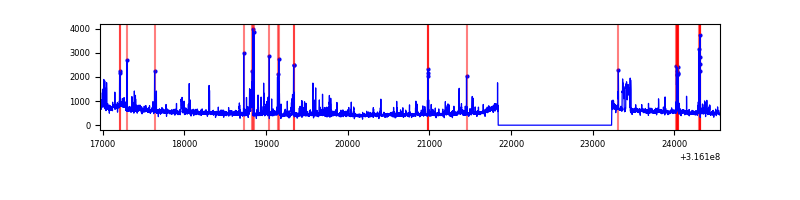 |
Top three noisy pixels from each quadrant. If the there are fewer than three noisy pixels in the level2.evt file, extra rows are filled as -1
| Pixel properties | Quadrant properties | ||||||
|---|---|---|---|---|---|---|---|
| Quadrant | DetID | PixID | Counts | Sigma | Mean | Median | Sigma |
| A | 6 | 16 | 41710 | 254.09 | 821 | 807 | 161.0 |
| A | 2 | 79 | 11827 | 68.46 | 821 | 807 | 161.0 |
| A | 13 | 254 | 11194 | 64.52 | 821 | 807 | 161.0 |
| B | 0 | 190 | 70375 | 462.43 | 835 | 816 | 150.4 |
| B | 12 | 111 | 16760 | 106.0 | 835 | 816 | 150.4 |
| B | 0 | 229 | 14696 | 92.27 | 835 | 816 | 150.4 |
| C | 8 | 208 | 1404925 | 7849.47 | 785 | 792 | 178.9 |
| C | 2 | 16 | 278455 | 1552.21 | 785 | 792 | 178.9 |
| C | 14 | 238 | 126212 | 701.13 | 785 | 792 | 178.9 |
| D | 1 | 52 | 160712 | 833.63 | 812 | 792 | 191.8 |
| D | 13 | 153 | 100152 | 517.94 | 812 | 792 | 191.8 |
| D | 13 | 172 | 61938 | 318.74 | 812 | 792 | 191.8 |
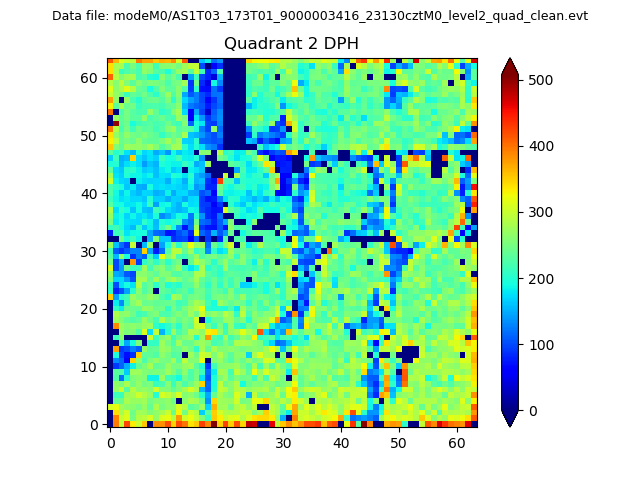
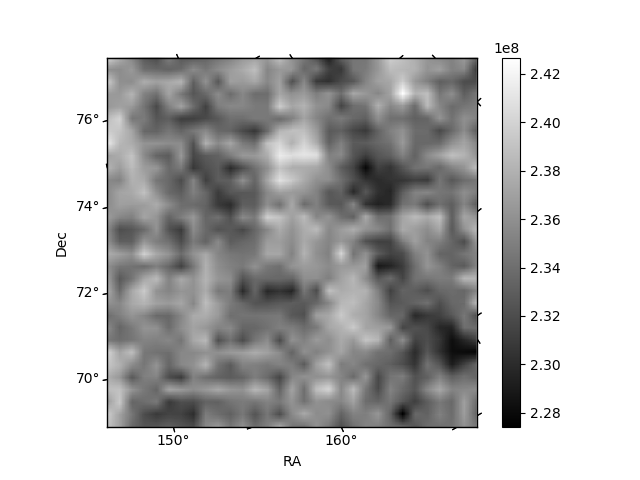
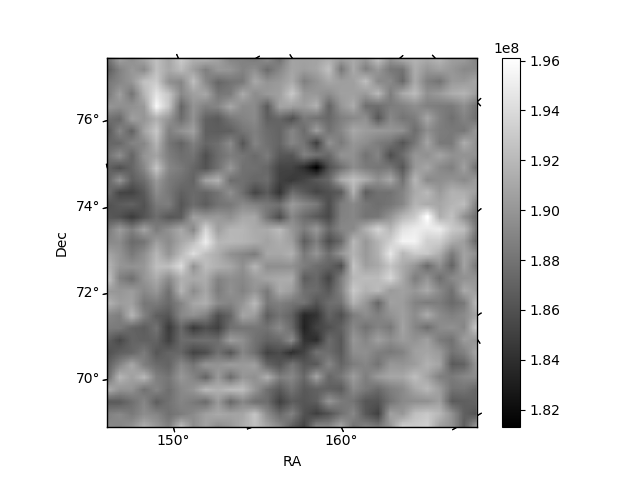
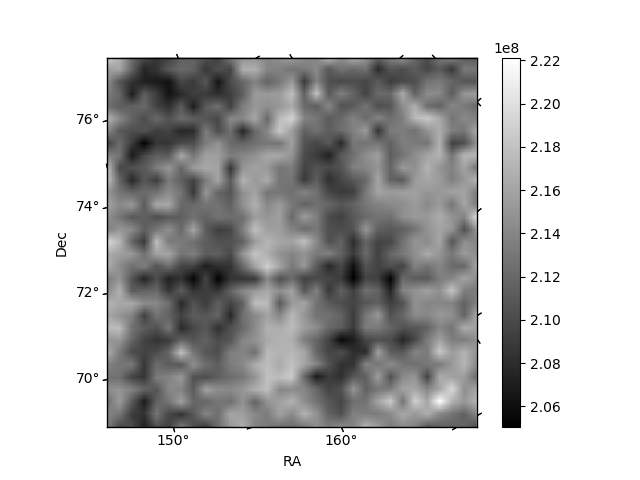
Histogram calculated using DETX and DETY for each event in the final _common_clean file
| Quadrant A | 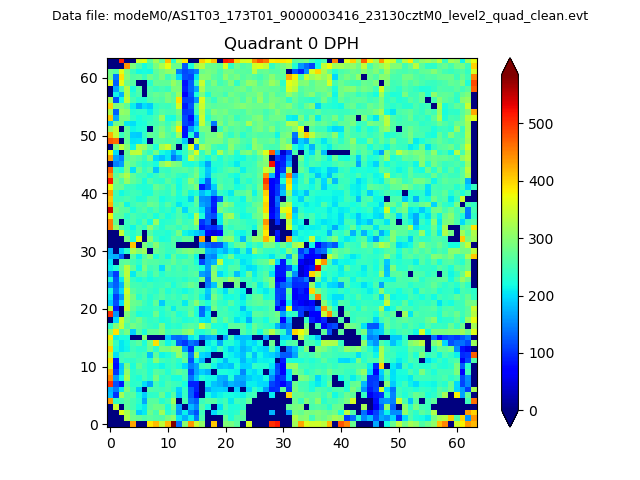 |
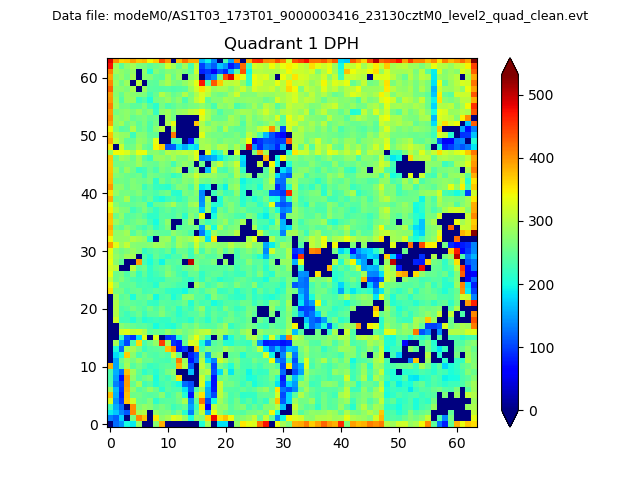 |
Quadrant B |
|---|---|---|---|
| Quadrant D | 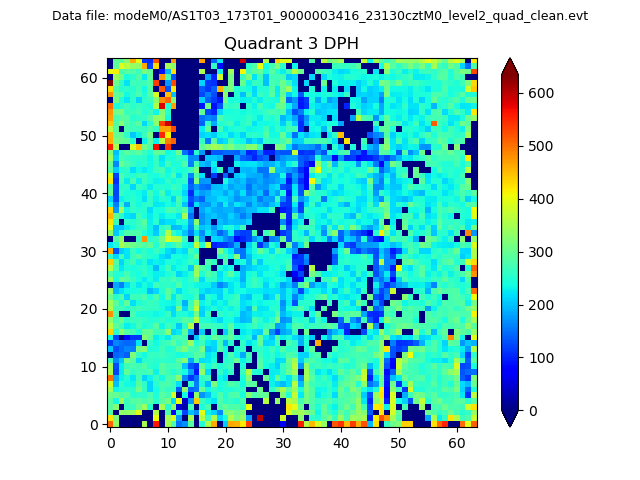 |
 |
Quadrant C |
| Plot type | Count rate plots | Images |
|---|---|---|
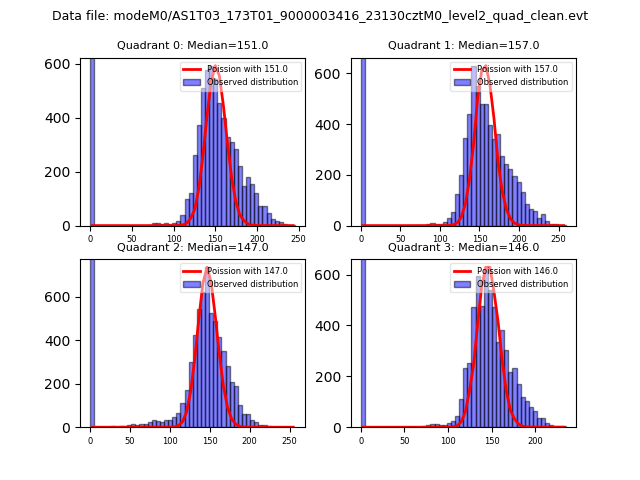
| Comparison with Poisson distribution Blue bars denote a histogram of data divided into 1 sec bins. Red curve is a Poisson curve with rate = median count rate of data. |
 |
 |
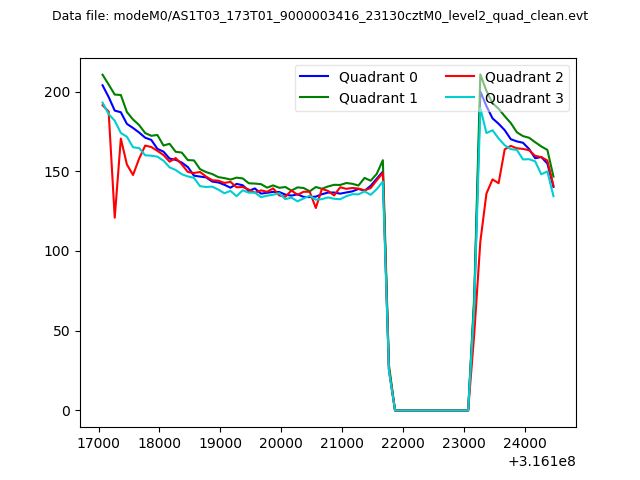
| Quadrant-wise count rates Data is divided into 100 sec bins |
 |
|
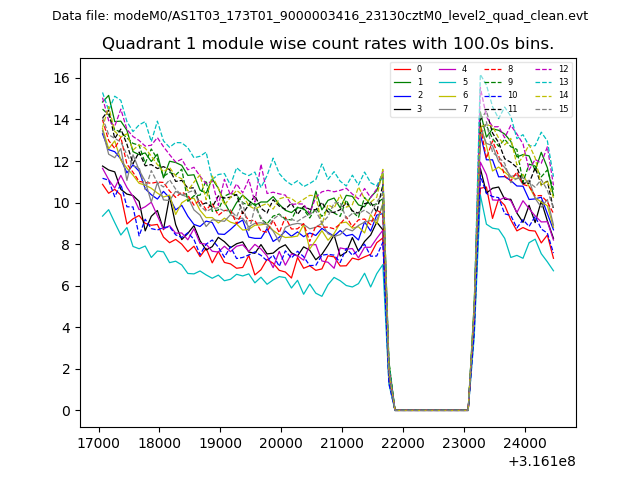
| Module-wise count rates for Quadrant A Data is divided into 100 sec bins |
 |
 |
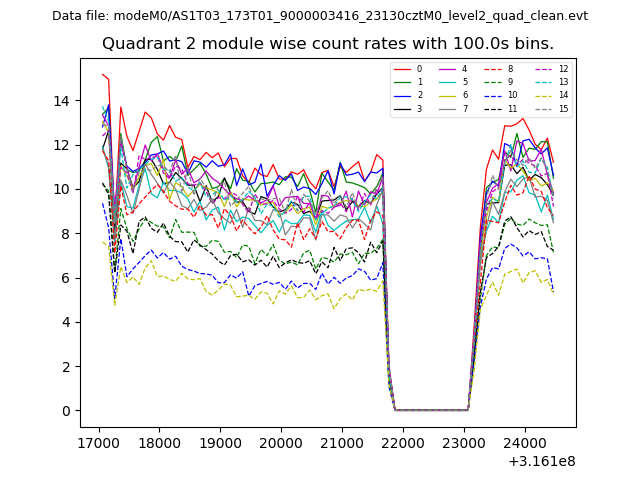
| Module-wise count rates for Quadrant B Data is divided into 100 sec bins |
 |
 |
| Module-wise count rates for Quadrant C Data is divided into 100 sec bins |
 |
 |
| Module-wise count rates for Quadrant D Data is divided into 100 sec bins |
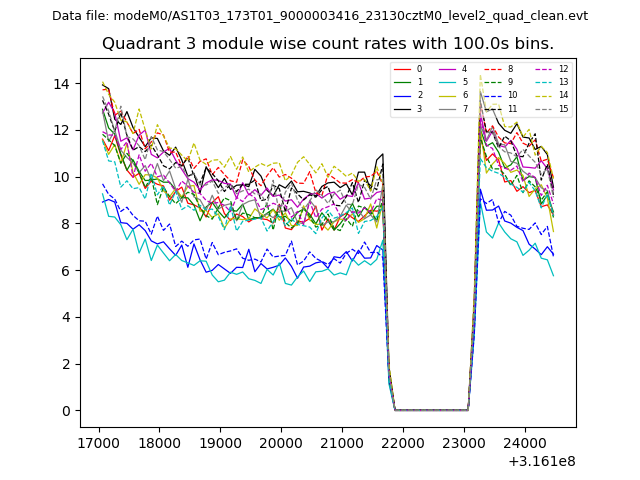 |
 |
| Parameter | Plot |
|---|---|
| CZT HV Monitor | 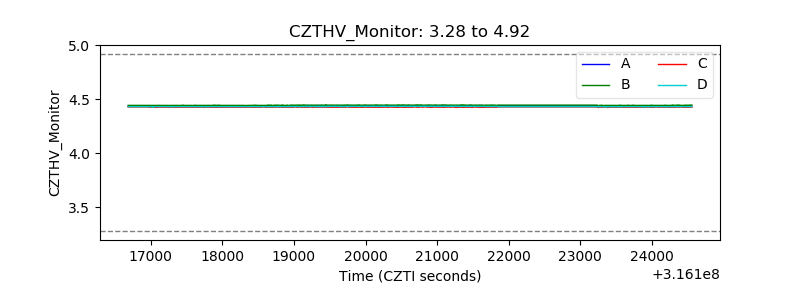 |
| D_VDD | 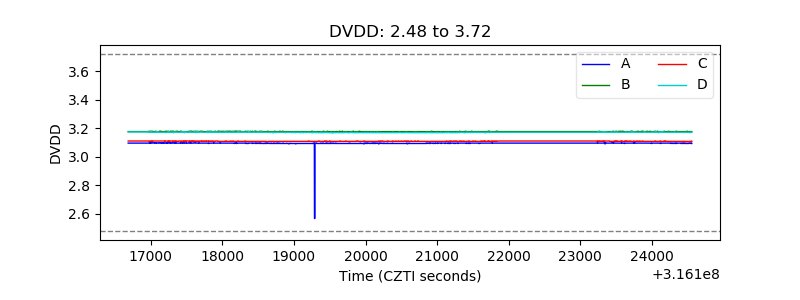 |
| Temperature 1 | 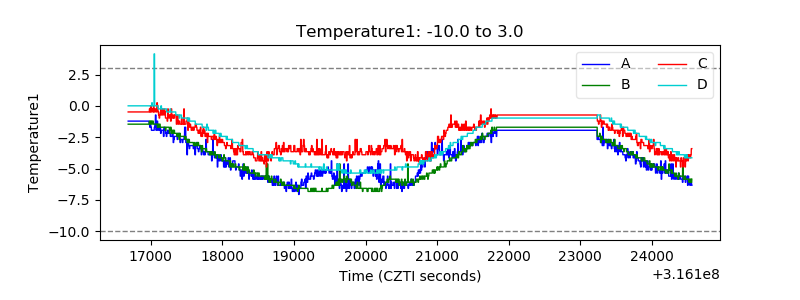 |
| Veto HV Monitor |  |
| Veto LLD | 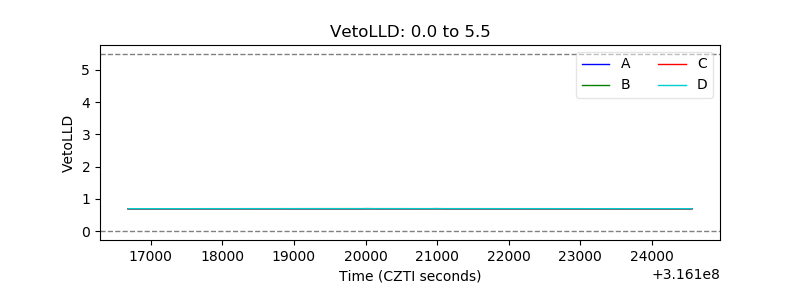 |
| Alpha Counter | 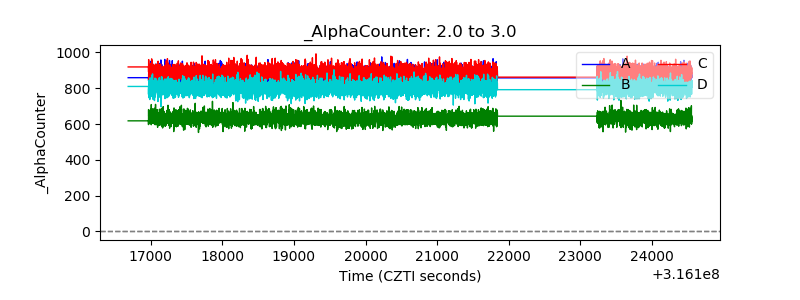 |
| _CPM_Rate |  |
| CZT Counter | 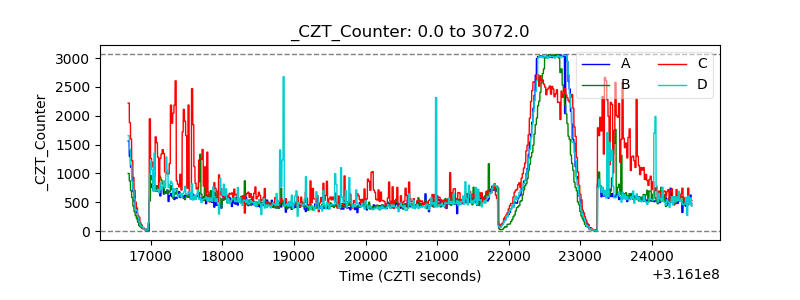 |
| +2.5 Volts monitor |  |
| +5 Volts monitor |  |
| _ROLL_ROT | 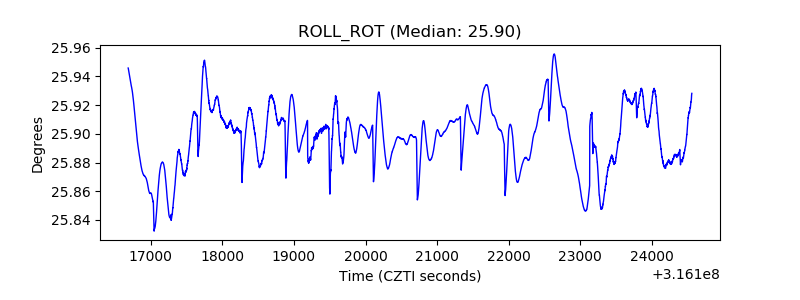 |
| _Roll_DEC | 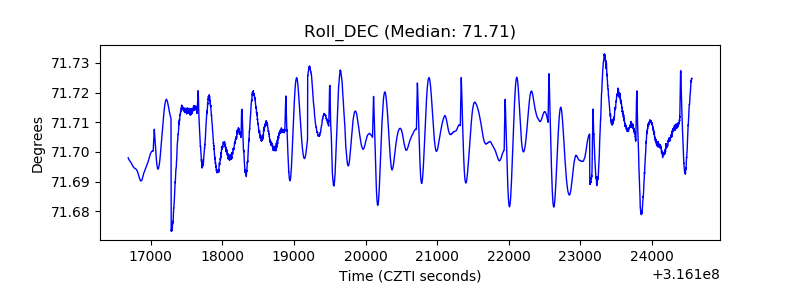 |
| _Roll_RA | 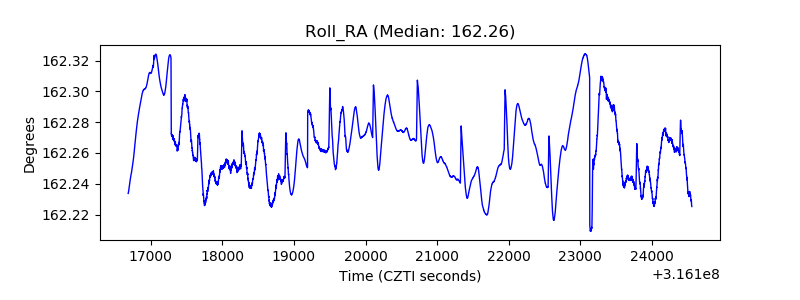 |
| Veto Counter | 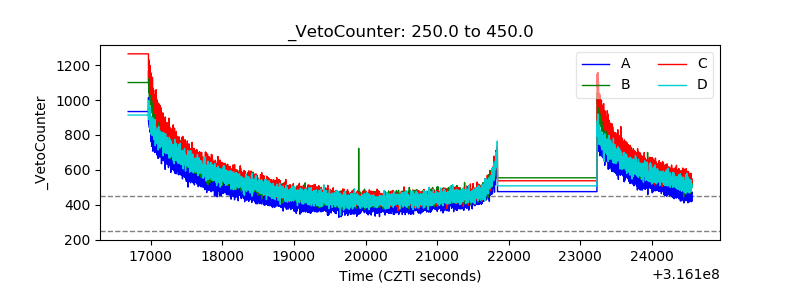 |