| Param | Original file | Final file |
|---|---|---|
| Filename | modeM0/AS1T03_173T01_9000003416_23131cztM0_level2.evt | modeM0/AS1T03_173T01_9000003416_23131cztM0_level2_quad_clean.evt |
| Size (bytes) | 529,499,520 | 124,885,440 |
| Size | 505.0 MB | 119.1 MB |
| Events in quadrant A | 3,086,783 | 860,432 |
| Events in quadrant B | 4,929,952 | 831,185 |
| Events in quadrant C | 4,212,167 | 831,806 |
| Events in quadrant D | 3,388,223 | 828,018 |
| Mode M9 | |||
|---|---|---|---|
| Quadrant | BADHDUFLAG | Total packets | Discarded packets |
| A | 0 | 25 | 0 |
| B | 0 | 26 | 0 |
| C | 0 | 26 | 0 |
| D | 0 | 26 | 0 |
| Mode M0 | |||
|---|---|---|---|
| Quadrant | BADHDUFLAG | Total packets | Discarded packets |
| A | 0 | 13197 | 2 |
| B | 0 | 18750 | 3 |
| C | 0 | 16479 | 2 |
| D | 0 | 14053 | 2 |
| Mode SS | |||
|---|---|---|---|
| Quadrant | BADHDUFLAG | Total packets | Discarded packets |
| A | 0 | 126 | 0 |
| B | 0 | 126 | 0 |
| C | 0 | 126 | 0 |
| D | 0 | 126 | 0 |
| Quadrant | Total seconds | Saturated seconds | Saturation percentage |
|---|---|---|---|
| A | 6169 | 51 | 0.826714% |
| B | 6168 | 863 | 13.991569% |
| C | 6168 | 456 | 7.392996% |
| D | 6168 | 107 | 1.734760% |
Noise dominated data is calculated using 1-second bins in cleaned event files. If a bin has >2000 counts, and if more than 50% of those come from <1% of pixels, then it is considered to be noise-dominated and hence unusable.
| Quadrant | # 1 sec bins | Bins with >0 counts | Bins with >2000 counts | High rate bins dominated by noise | Noise dominated (total time) | Noise dominated (detector-on time) | Marked lightcurve |
|---|---|---|---|---|---|---|---|
| A | 7539 | 6170 | 0 | 0 | 0.00% | 0.00% | 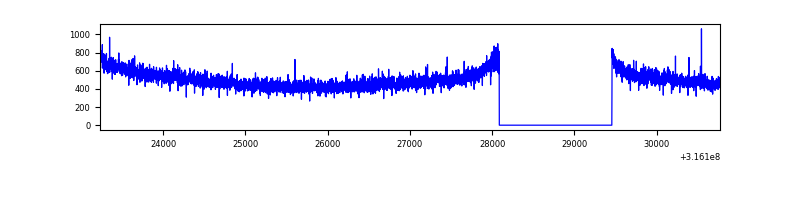 |
| B | 7538 | 6169 | 684 | 684 | 9.07% | 11.09% | 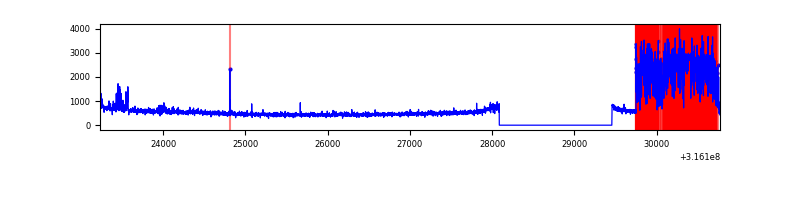 |
| C | 7538 | 6169 | 192 | 192 | 2.55% | 3.11% | 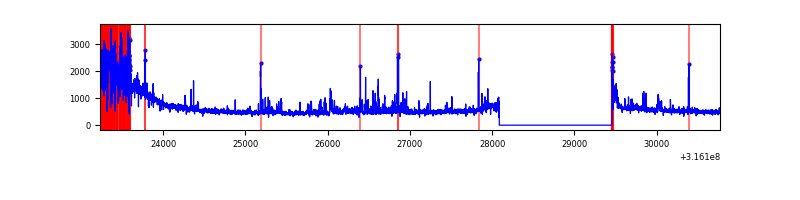 |
| D | 7538 | 6169 | 31 | 31 | 0.41% | 0.50% | 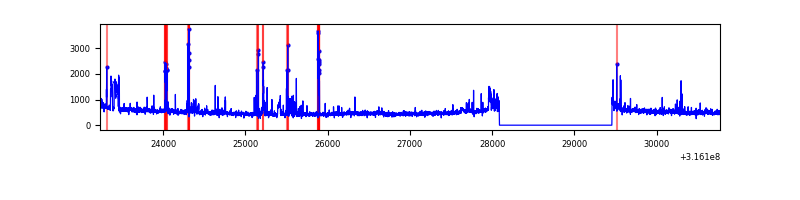 |
Top three noisy pixels from each quadrant. If the there are fewer than three noisy pixels in the level2.evt file, extra rows are filled as -1
| Pixel properties | Quadrant properties | ||||||
|---|---|---|---|---|---|---|---|
| Quadrant | DetID | PixID | Counts | Sigma | Mean | Median | Sigma |
| A | 6 | 16 | 33907 | 210.92 | 791 | 778 | 157.1 |
| A | 13 | 254 | 9582 | 56.05 | 791 | 778 | 157.1 |
| A | 0 | 226 | 6843 | 38.61 | 791 | 778 | 157.1 |
| B | 5 | 31 | 1307354 | 9418.84 | 758 | 740 | 138.7 |
| B | 5 | 15 | 375238 | 2699.6 | 758 | 740 | 138.7 |
| B | 5 | 14 | 216020 | 1551.86 | 758 | 740 | 138.7 |
| C | 8 | 208 | 790224 | 4490.01 | 763 | 772 | 175.8 |
| C | 2 | 16 | 194911 | 1104.17 | 763 | 772 | 175.8 |
| C | 14 | 238 | 121723 | 687.91 | 763 | 772 | 175.8 |
| D | 1 | 52 | 91189 | 484.07 | 781 | 759 | 186.8 |
| D | 13 | 153 | 77534 | 410.97 | 781 | 759 | 186.8 |
| D | 7 | 38 | 75603 | 400.64 | 781 | 759 | 186.8 |
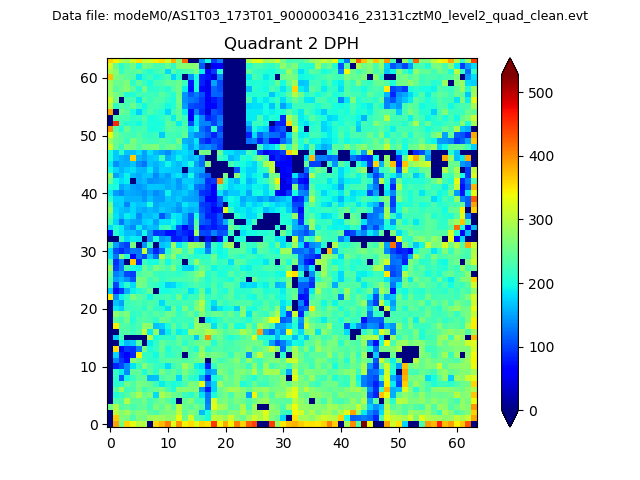
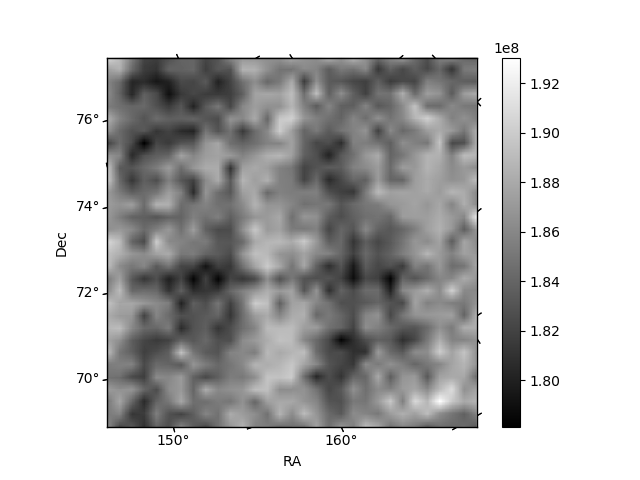
Histogram calculated using DETX and DETY for each event in the final _common_clean file
| Quadrant A | 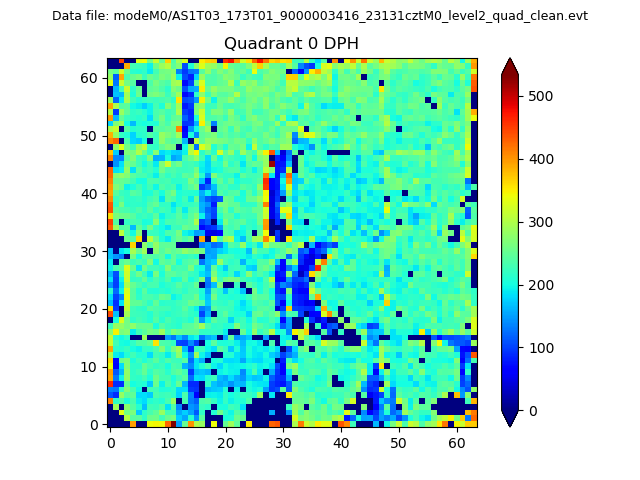 |
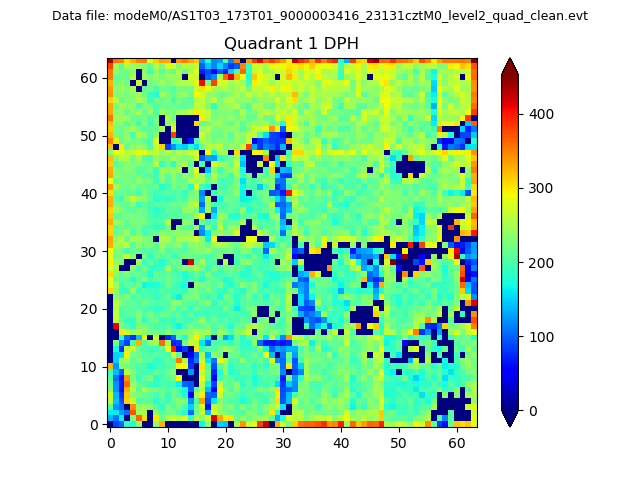 |
Quadrant B |
|---|---|---|---|
| Quadrant D | 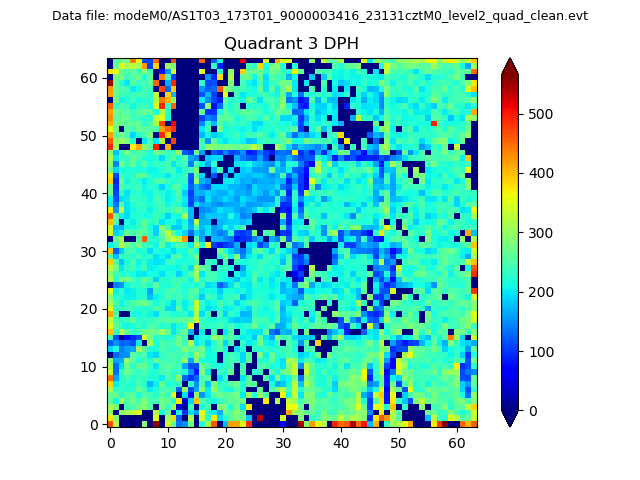 |
 |
Quadrant C |
| Plot type | Count rate plots | Images |
|---|---|---|
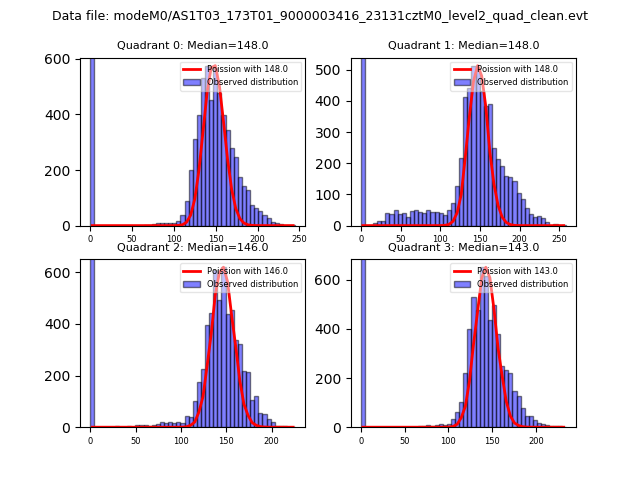
| Comparison with Poisson distribution Blue bars denote a histogram of data divided into 1 sec bins. Red curve is a Poisson curve with rate = median count rate of data. |
 |
 |
| Quadrant-wise count rates Data is divided into 100 sec bins |
 |
|
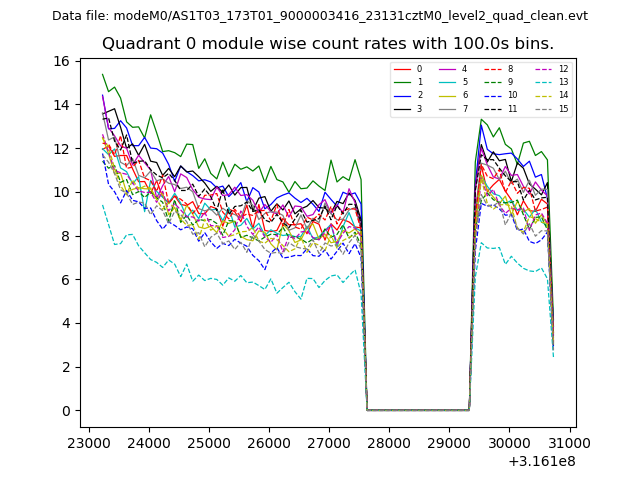
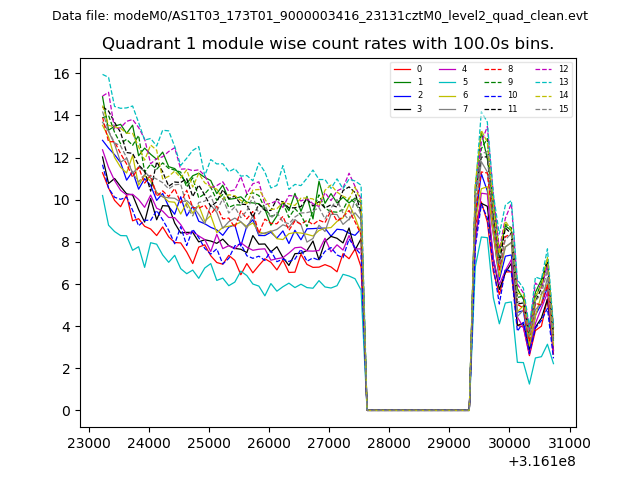
| Module-wise count rates for Quadrant A Data is divided into 100 sec bins |
 |
 |
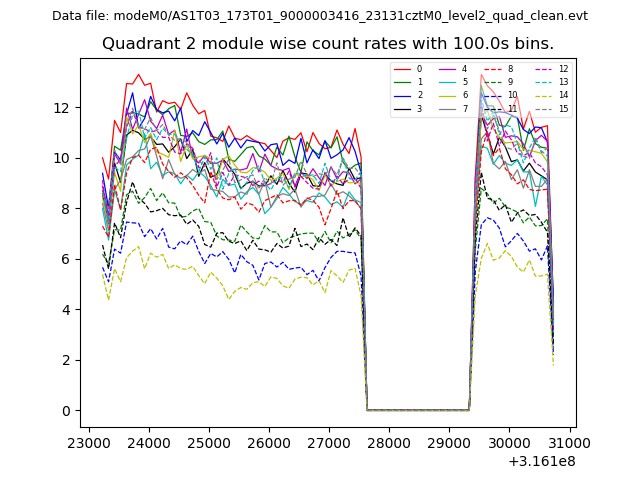
| Module-wise count rates for Quadrant B Data is divided into 100 sec bins |
 |
 |
| Module-wise count rates for Quadrant C Data is divided into 100 sec bins |
 |
 |
| Module-wise count rates for Quadrant D Data is divided into 100 sec bins |
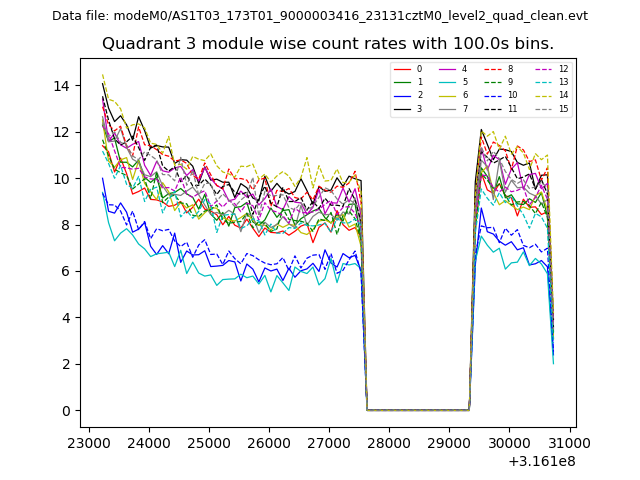 |
 |
| Parameter | Plot |
|---|---|
| CZT HV Monitor | 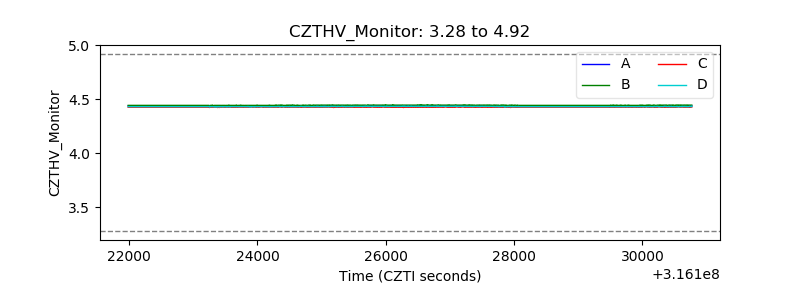 |
| D_VDD | 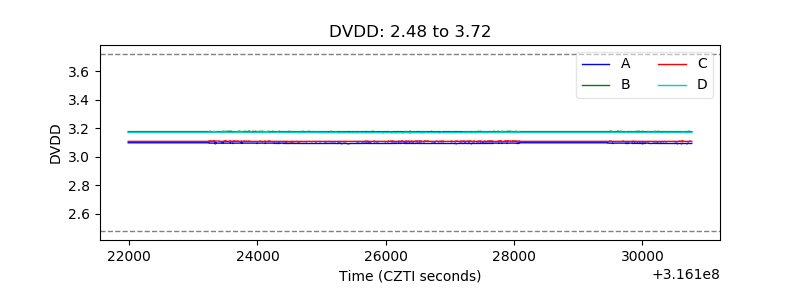 |
| Temperature 1 | 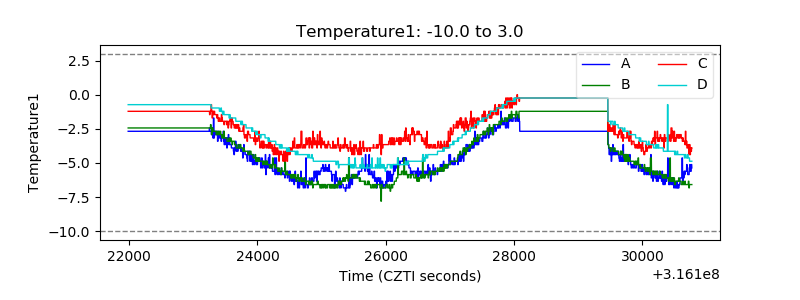 |
| Veto HV Monitor | 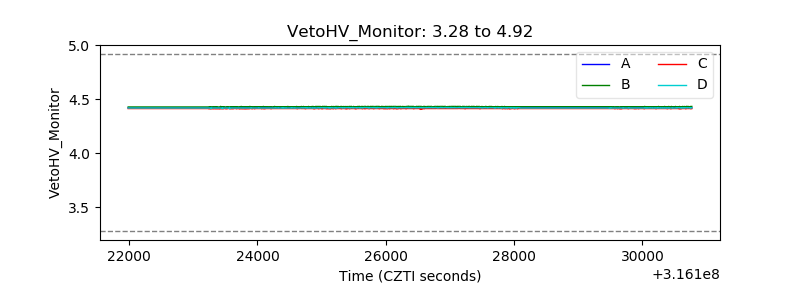 |
| Veto LLD | 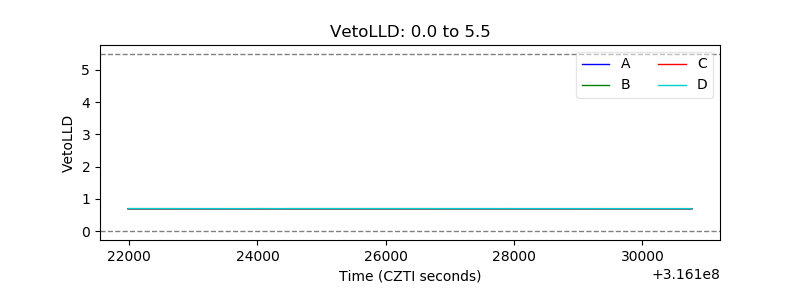 |
| Alpha Counter | 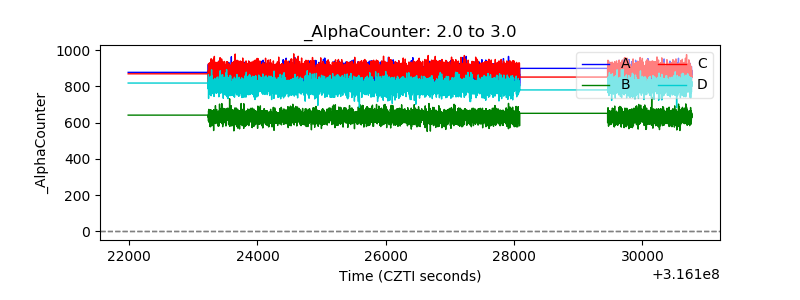 |
| _CPM_Rate | 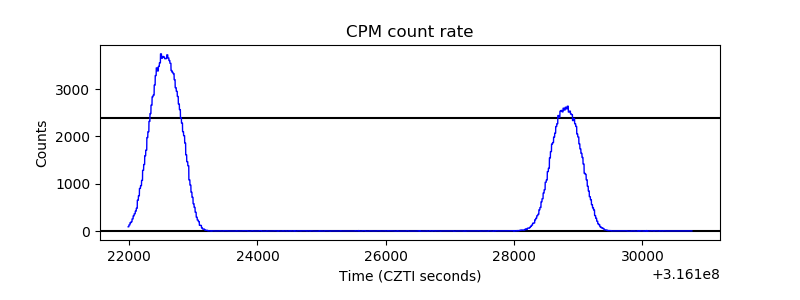 |
| CZT Counter | 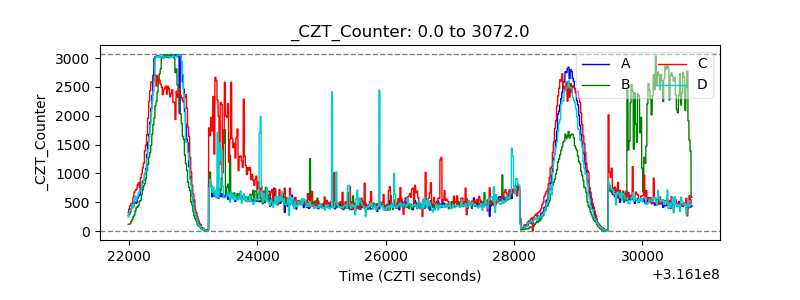 |
| +2.5 Volts monitor |  |
| +5 Volts monitor |  |
| _ROLL_ROT | 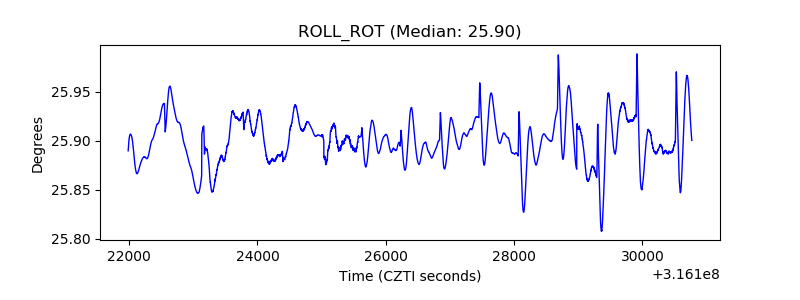 |
| _Roll_DEC | 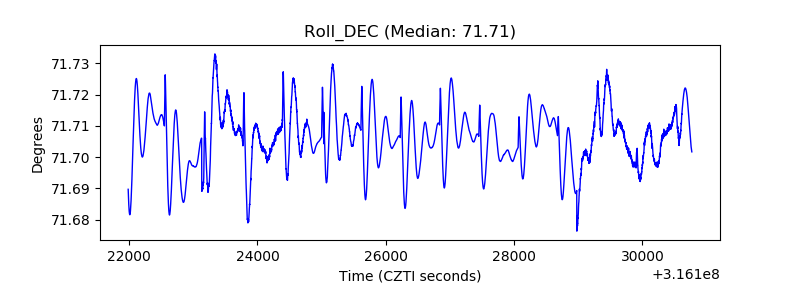 |
| _Roll_RA | 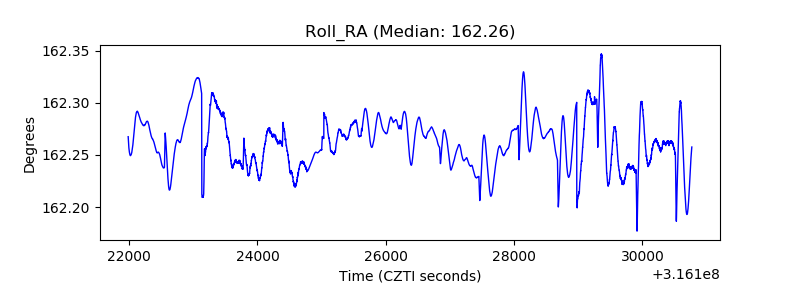 |
| Veto Counter | 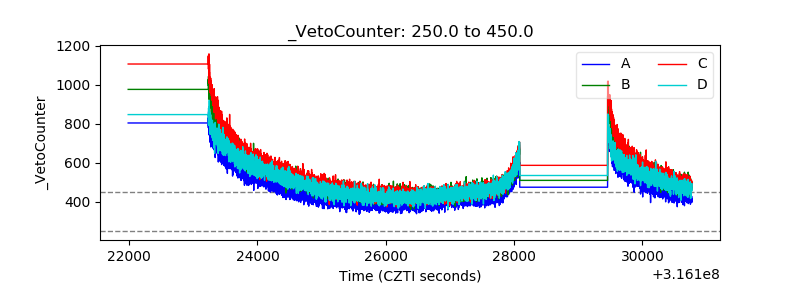 |