| Param | Original file | Final file |
|---|---|---|
| Filename | modeM0/AS1T03_173T01_9000003416_23132cztM0_level2.evt | modeM0/AS1T03_173T01_9000003416_23132cztM0_level2_quad_clean.evt |
| Size (bytes) | 687,447,360 | 103,806,720 |
| Size | 655.6 MB | 99.0 MB |
| Events in quadrant A | 2,986,918 | 743,482 |
| Events in quadrant B | 10,788,060 | 510,759 |
| Events in quadrant C | 3,215,543 | 739,295 |
| Events in quadrant D | 3,404,927 | 712,296 |
| Mode M9 | |||
|---|---|---|---|
| Quadrant | BADHDUFLAG | Total packets | Discarded packets |
| A | 0 | 16 | 0 |
| B | 0 | 17 | 0 |
| C | 0 | 17 | 0 |
| D | 0 | 17 | 0 |
| Mode M0 | |||
|---|---|---|---|
| Quadrant | BADHDUFLAG | Total packets | Discarded packets |
| A | 0 | 13022 | 2 |
| B | 0 | 36215 | 2 |
| C | 0 | 13669 | 2 |
| D | 0 | 14534 | 3 |
| Mode SS | |||
|---|---|---|---|
| Quadrant | BADHDUFLAG | Total packets | Discarded packets |
| A | 0 | 126 | 0 |
| B | 0 | 126 | 0 |
| C | 0 | 126 | 0 |
| D | 0 | 126 | 0 |
| Quadrant | Total seconds | Saturated seconds | Saturation percentage |
|---|---|---|---|
| A | 6260 | 22 | 0.351438% |
| B | 6260 | 3346 | 53.450479% |
| C | 6260 | 119 | 1.900958% |
| D | 6259 | 91 | 1.453906% |
Noise dominated data is calculated using 1-second bins in cleaned event files. If a bin has >2000 counts, and if more than 50% of those come from <1% of pixels, then it is considered to be noise-dominated and hence unusable.
| Quadrant | # 1 sec bins | Bins with >0 counts | Bins with >2000 counts | High rate bins dominated by noise | Noise dominated (total time) | Noise dominated (detector-on time) | Marked lightcurve |
|---|---|---|---|---|---|---|---|
| A | 7510 | 6261 | 0 | 0 | 0.00% | 0.00% | 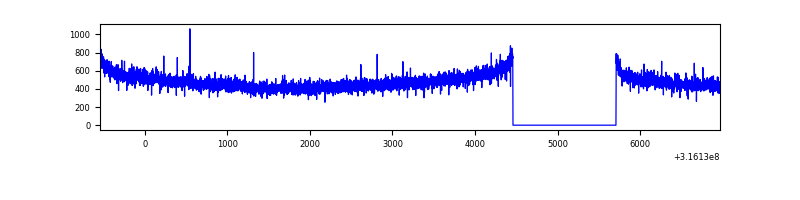 |
| B | 7510 | 6261 | 3040 | 3040 | 40.48% | 48.55% | 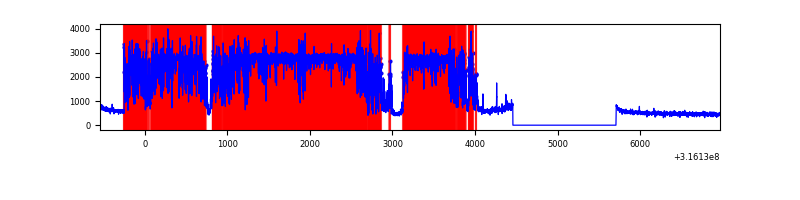 |
| C | 7510 | 6261 | 15 | 15 | 0.20% | 0.24% | 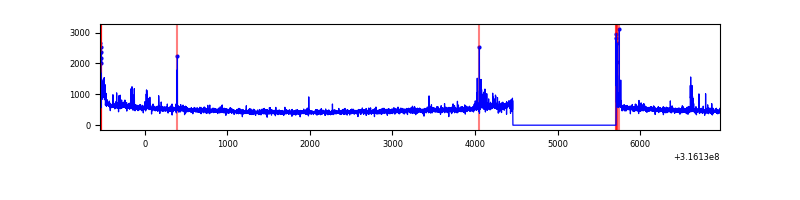 |
| D | 7509 | 6260 | 30 | 30 | 0.40% | 0.48% | 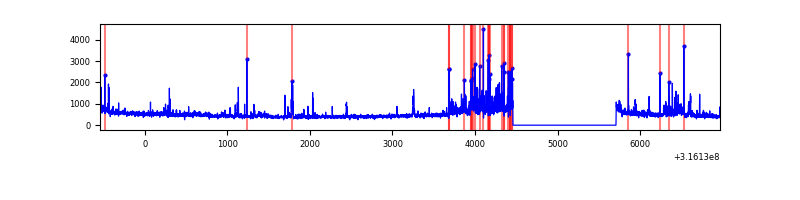 |
Top three noisy pixels from each quadrant. If the there are fewer than three noisy pixels in the level2.evt file, extra rows are filled as -1
| Pixel properties | Quadrant properties | ||||||
|---|---|---|---|---|---|---|---|
| Quadrant | DetID | PixID | Counts | Sigma | Mean | Median | Sigma |
| A | 6 | 16 | 27233 | 171.49 | 768 | 752 | 154.4 |
| A | 13 | 254 | 9682 | 57.83 | 768 | 752 | 154.4 |
| A | 0 | 226 | 6592 | 37.82 | 768 | 752 | 154.4 |
| B | 5 | 31 | 4591357 | 43751.84 | 565 | 551 | 104.9 |
| B | 5 | 15 | 2280488 | 21728.53 | 565 | 551 | 104.9 |
| B | 5 | 14 | 1682294 | 16027.55 | 565 | 551 | 104.9 |
| C | 14 | 238 | 121024 | 697.06 | 750 | 756 | 172.5 |
| C | 2 | 16 | 68809 | 394.43 | 750 | 756 | 172.5 |
| C | 0 | 10 | 56191 | 321.29 | 750 | 756 | 172.5 |
| D | 1 | 52 | 232084 | 1277.7 | 748 | 726 | 181.1 |
| D | 1 | 239 | 93093 | 510.11 | 748 | 726 | 181.1 |
| D | 12 | 233 | 71466 | 390.67 | 748 | 726 | 181.1 |
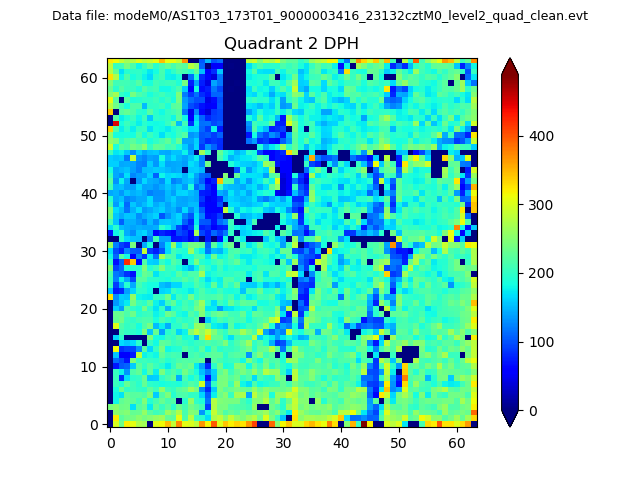
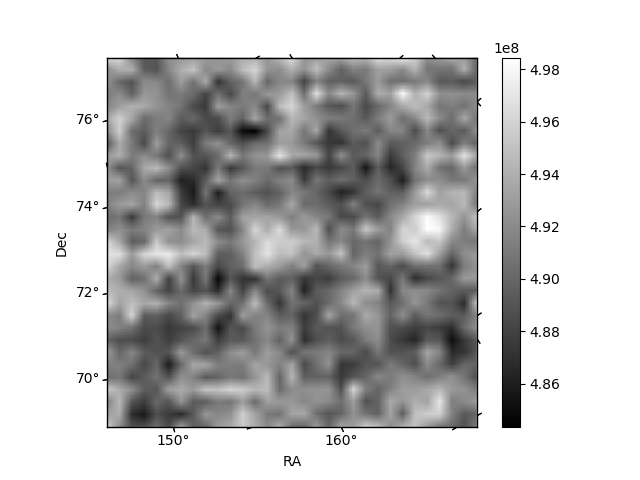
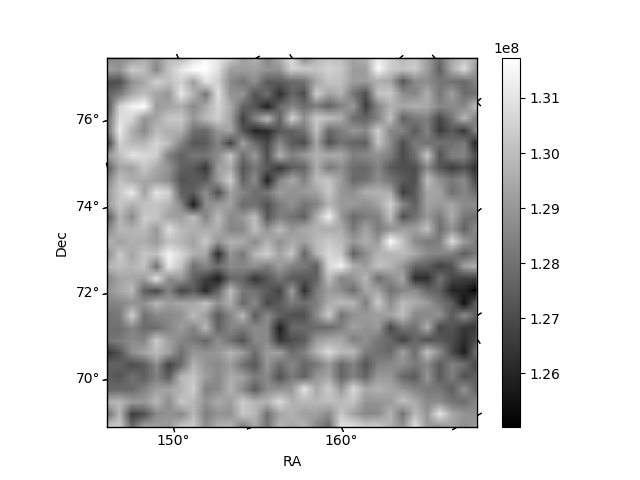
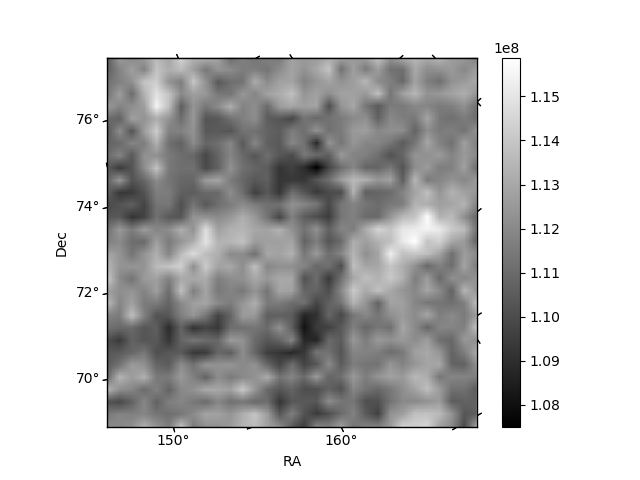
Histogram calculated using DETX and DETY for each event in the final _common_clean file
| Quadrant A | 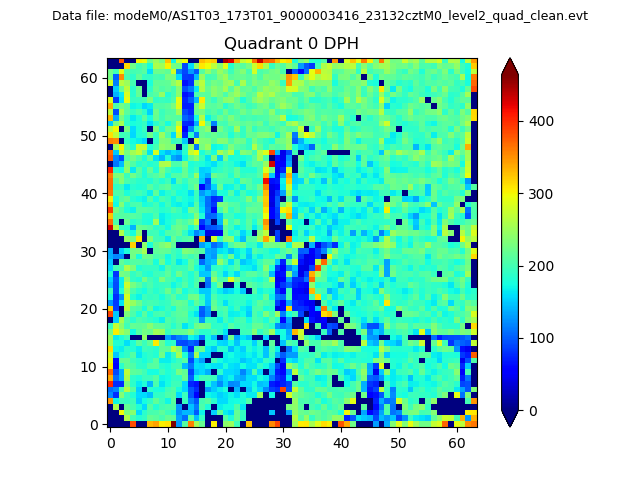 |
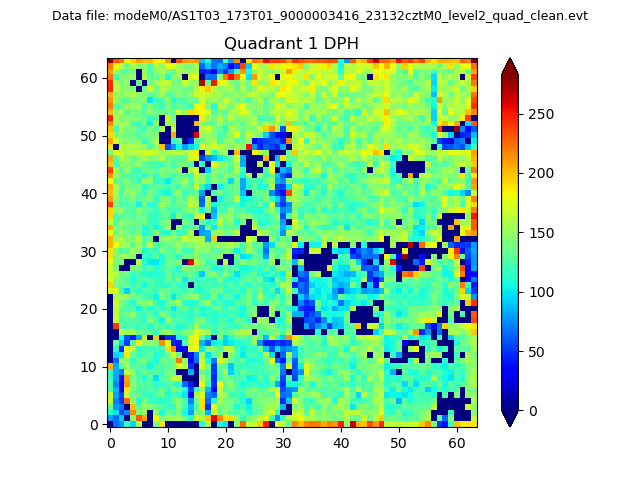 |
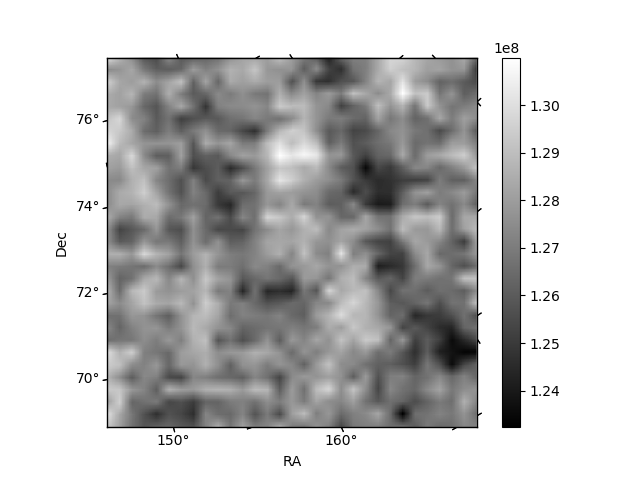
Quadrant B |
|---|---|---|---|
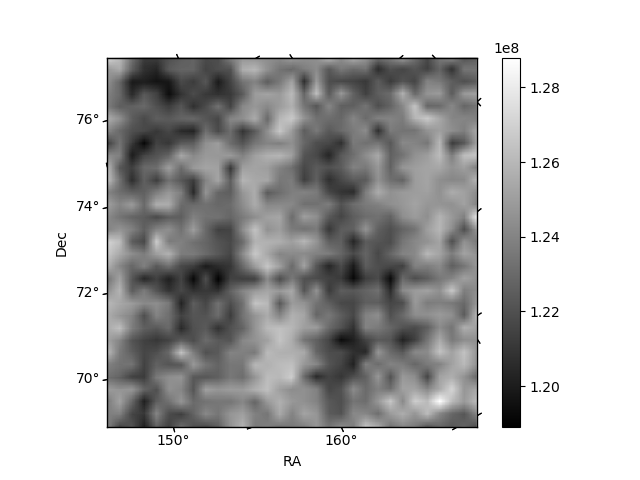
| Quadrant D | 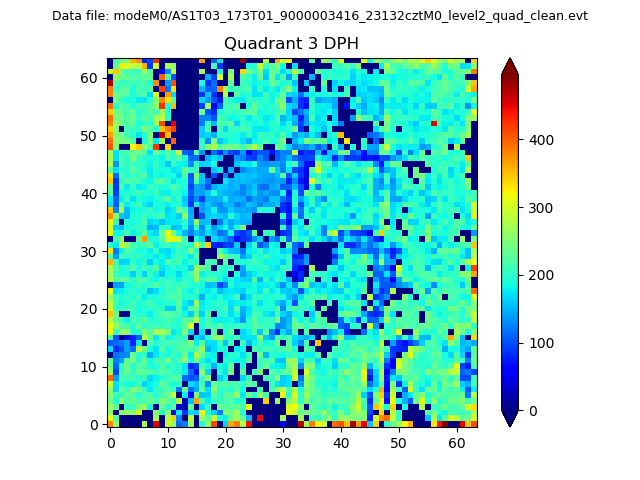 |
 |
Quadrant C |
| Plot type | Count rate plots | Images |
|---|---|---|
| Comparison with Poisson distribution Blue bars denote a histogram of data divided into 1 sec bins. Red curve is a Poisson curve with rate = median count rate of data. |
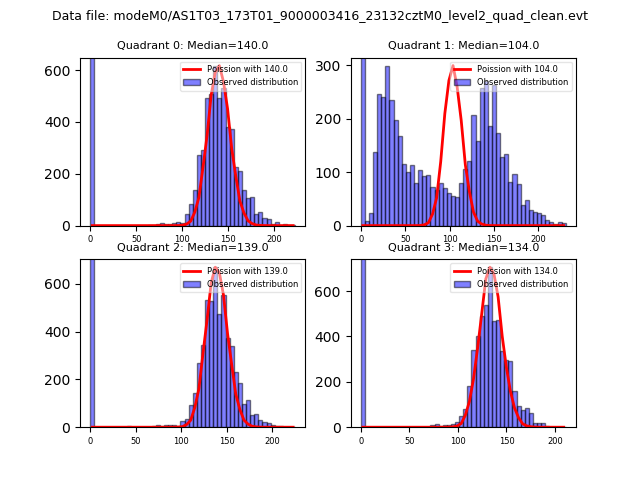 |
 |
| Quadrant-wise count rates Data is divided into 100 sec bins |
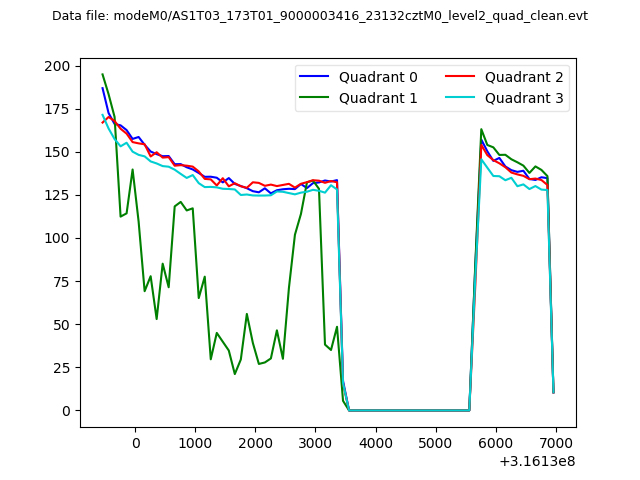 |
|
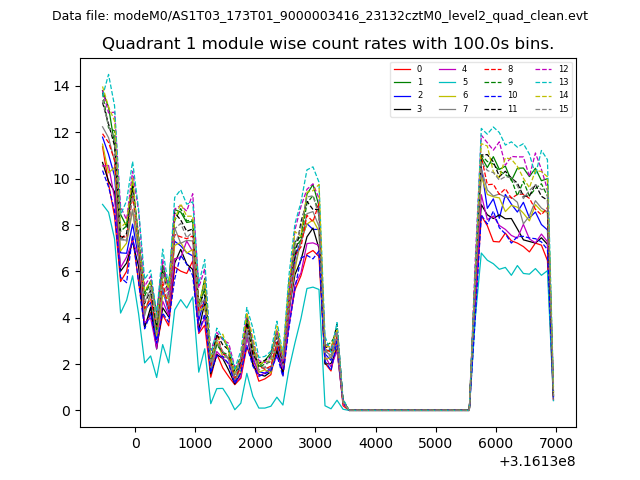
| Module-wise count rates for Quadrant A Data is divided into 100 sec bins |
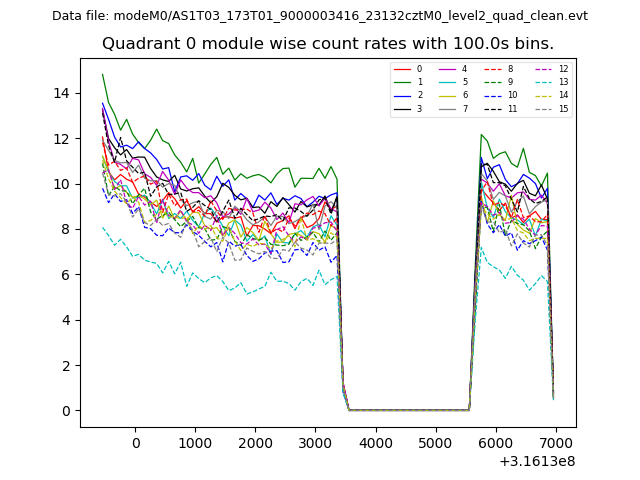 |
 |
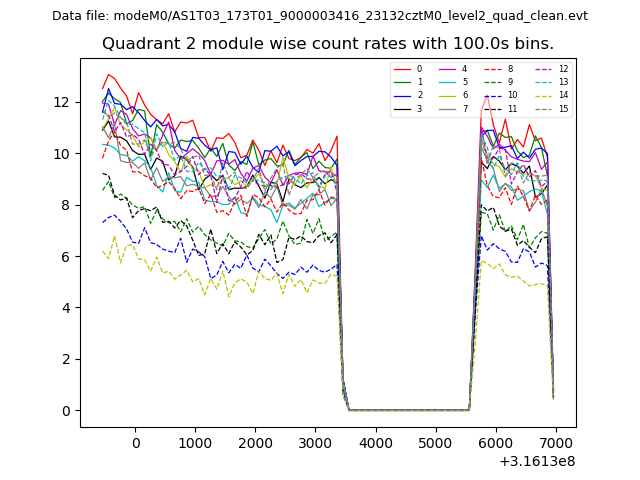
| Module-wise count rates for Quadrant B Data is divided into 100 sec bins |
 |
 |
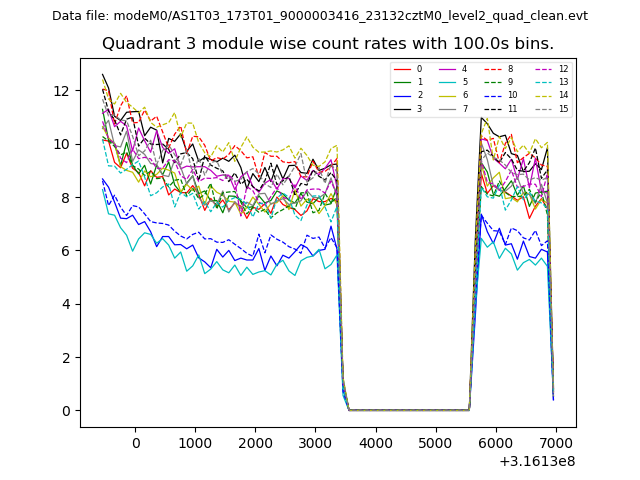
| Module-wise count rates for Quadrant C Data is divided into 100 sec bins |
 |
 |
| Module-wise count rates for Quadrant D Data is divided into 100 sec bins |
 |
 |
| Parameter | Plot |
|---|---|
| CZT HV Monitor | 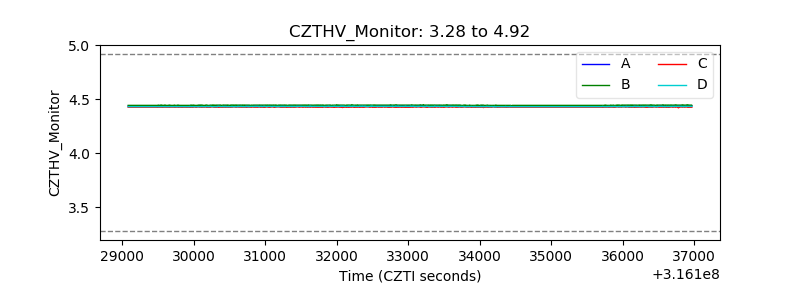 |
| D_VDD | 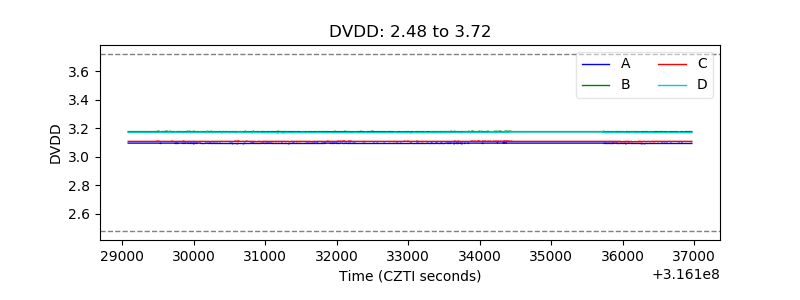 |
| Temperature 1 | 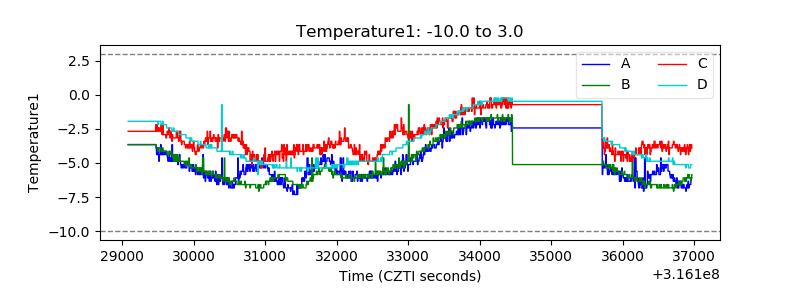 |
| Veto HV Monitor | 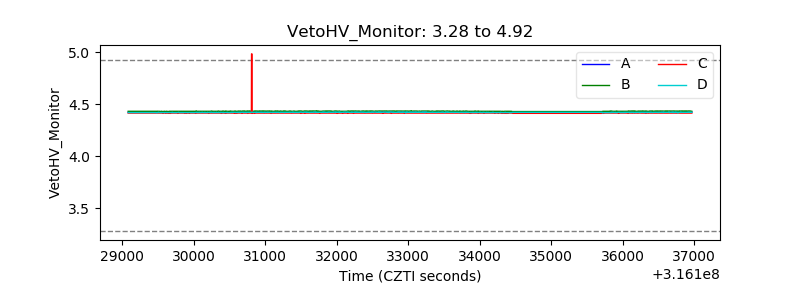 |
| Veto LLD | 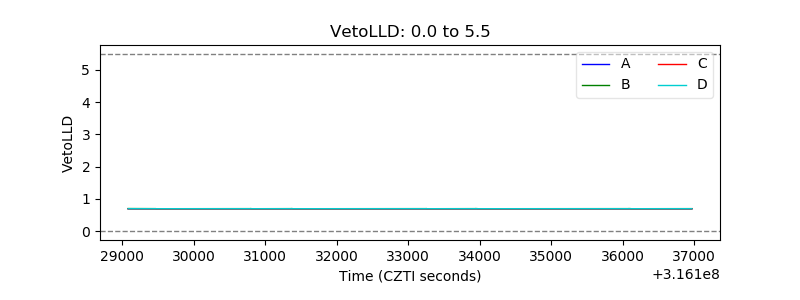 |
| Alpha Counter |  |
| _CPM_Rate |  |
| CZT Counter | 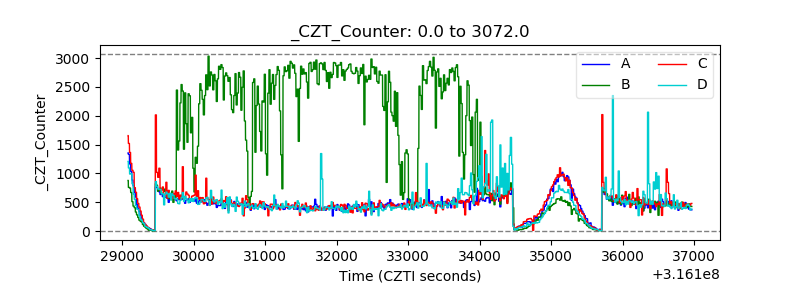 |
| +2.5 Volts monitor | 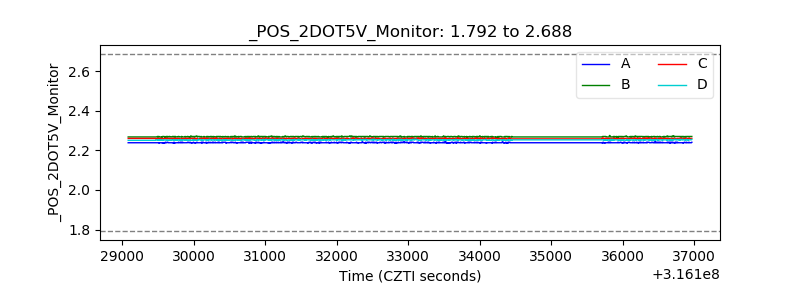 |
| +5 Volts monitor |  |
| _ROLL_ROT | 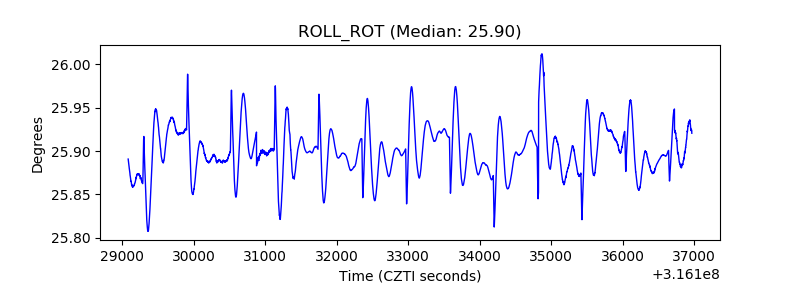 |
| _Roll_DEC | 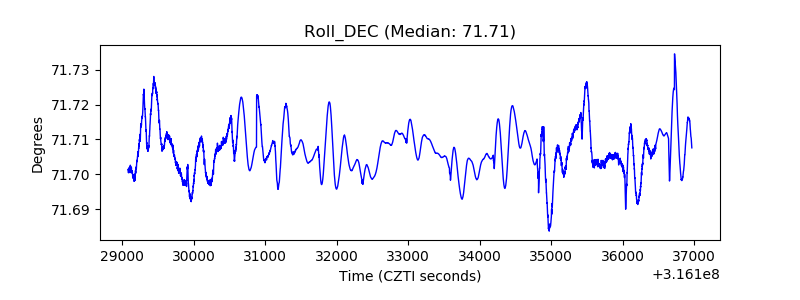 |
| _Roll_RA | 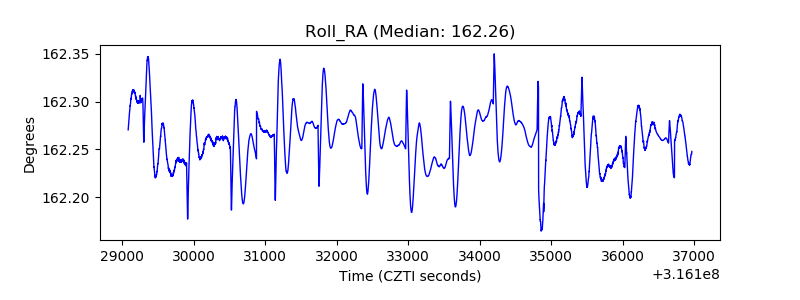 |
| Veto Counter | 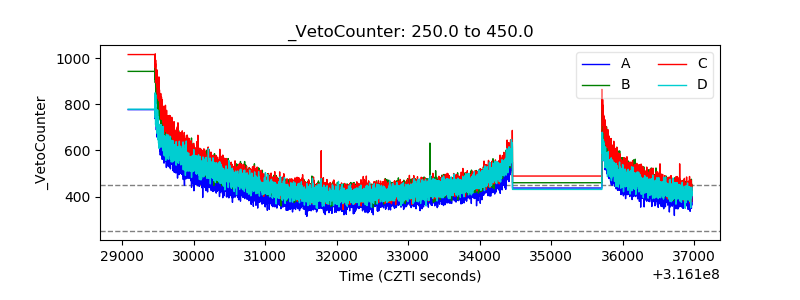 |