| Param | Original file | Final file |
|---|---|---|
| Filename | modeM0/AS1T03_173T01_9000003416_23133cztM0_level2.evt | modeM0/AS1T03_173T01_9000003416_23133cztM0_level2_quad_clean.evt |
| Size (bytes) | 456,926,400 | 111,856,320 |
| Size | 435.8 MB | 106.7 MB |
| Events in quadrant A | 3,191,287 | 734,319 |
| Events in quadrant B | 3,141,574 | 759,957 |
| Events in quadrant C | 3,291,398 | 724,673 |
| Events in quadrant D | 3,759,655 | 702,955 |
| Mode M9 | |||
|---|---|---|---|
| Quadrant | BADHDUFLAG | Total packets | Discarded packets |
| A | 0 | 16 | 0 |
| B | 0 | 17 | 0 |
| C | 0 | 17 | 0 |
| D | 0 | 17 | 0 |
| Mode M0 | |||
|---|---|---|---|
| Quadrant | BADHDUFLAG | Total packets | Discarded packets |
| A | 0 | 13885 | 2 |
| B | 0 | 13758 | 2 |
| C | 0 | 14145 | 3 |
| D | 0 | 15986 | 2 |
| Mode SS | |||
|---|---|---|---|
| Quadrant | BADHDUFLAG | Total packets | Discarded packets |
| A | 0 | 136 | 0 |
| B | 0 | 136 | 0 |
| C | 0 | 136 | 0 |
| D | 0 | 136 | 0 |
| Quadrant | Total seconds | Saturated seconds | Saturation percentage |
|---|---|---|---|
| A | 6682 | 16 | 0.239449% |
| B | 6682 | 27 | 0.404071% |
| C | 6681 | 88 | 1.317168% |
| D | 6681 | 78 | 1.167490% |
Noise dominated data is calculated using 1-second bins in cleaned event files. If a bin has >2000 counts, and if more than 50% of those come from <1% of pixels, then it is considered to be noise-dominated and hence unusable.
| Quadrant | # 1 sec bins | Bins with >0 counts | Bins with >2000 counts | High rate bins dominated by noise | Noise dominated (total time) | Noise dominated (detector-on time) | Marked lightcurve |
|---|---|---|---|---|---|---|---|
| A | 7607 | 6683 | 0 | 0 | 0.00% | 0.00% | 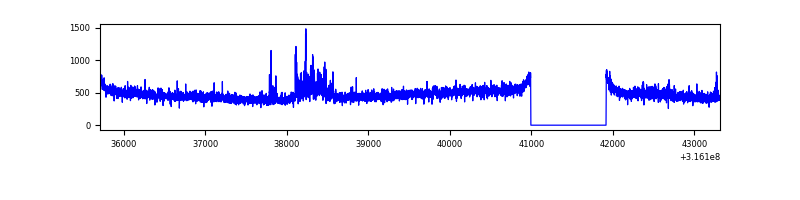 |
| B | 7607 | 6683 | 1 | 1 | 0.01% | 0.01% | 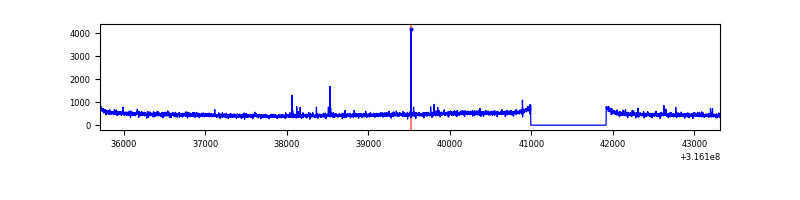 |
| C | 7606 | 6682 | 11 | 11 | 0.14% | 0.16% | 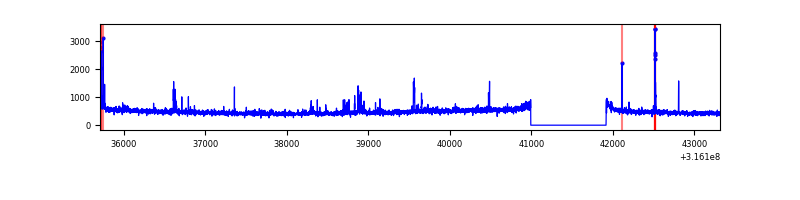 |
| D | 7606 | 6682 | 35 | 35 | 0.46% | 0.52% | 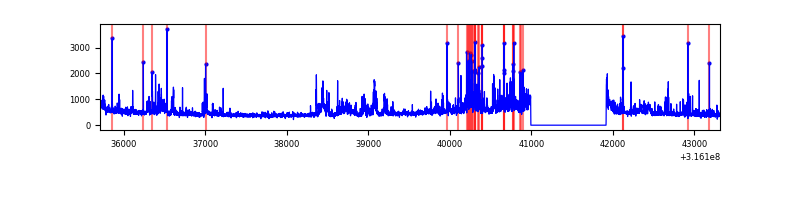 |
Top three noisy pixels from each quadrant. If the there are fewer than three noisy pixels in the level2.evt file, extra rows are filled as -1
| Pixel properties | Quadrant properties | ||||||
|---|---|---|---|---|---|---|---|
| Quadrant | DetID | PixID | Counts | Sigma | Mean | Median | Sigma |
| A | 6 | 16 | 152697 | 971.89 | 788 | 770 | 156.3 |
| A | 13 | 254 | 9165 | 53.7 | 788 | 770 | 156.3 |
| A | 3 | 137 | 6727 | 38.11 | 788 | 770 | 156.3 |
| B | 12 | 111 | 17969 | 115.02 | 796 | 776 | 149.5 |
| B | 11 | 111 | 15612 | 99.25 | 796 | 776 | 149.5 |
| B | 14 | 111 | 13954 | 88.16 | 796 | 776 | 149.5 |
| C | 14 | 238 | 121636 | 684.82 | 765 | 769 | 176.5 |
| C | 0 | 10 | 97439 | 547.72 | 765 | 769 | 176.5 |
| C | 0 | 207 | 61016 | 341.35 | 765 | 769 | 176.5 |
| D | 1 | 52 | 573416 | 3111.04 | 765 | 743 | 184.1 |
| D | 12 | 233 | 132395 | 715.2 | 765 | 743 | 184.1 |
| D | 13 | 153 | 48114 | 257.34 | 765 | 743 | 184.1 |
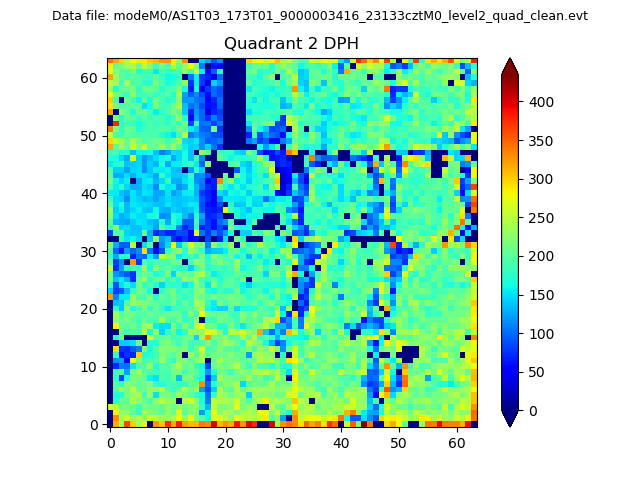
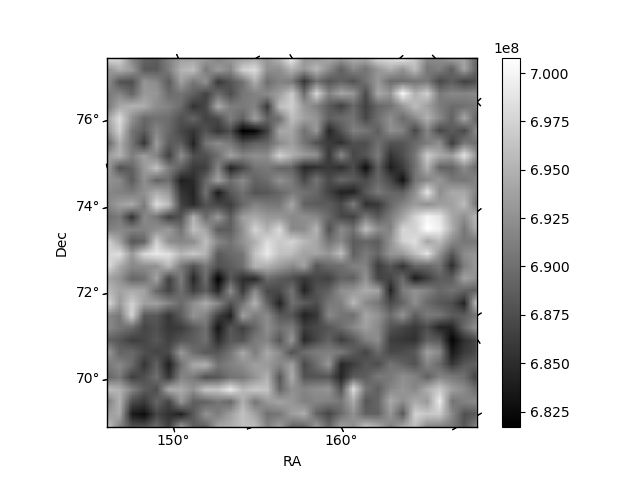
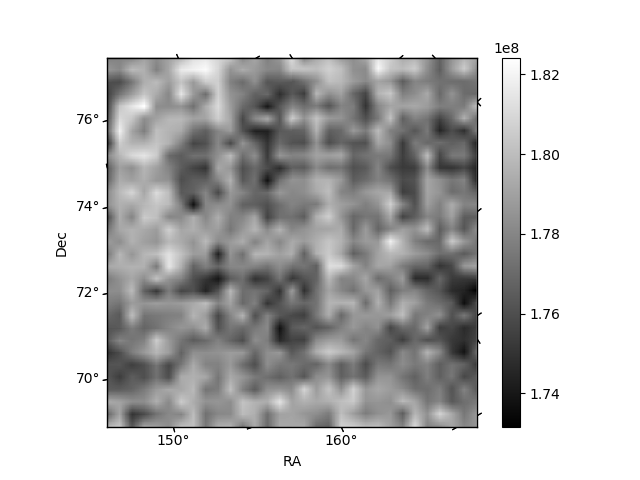
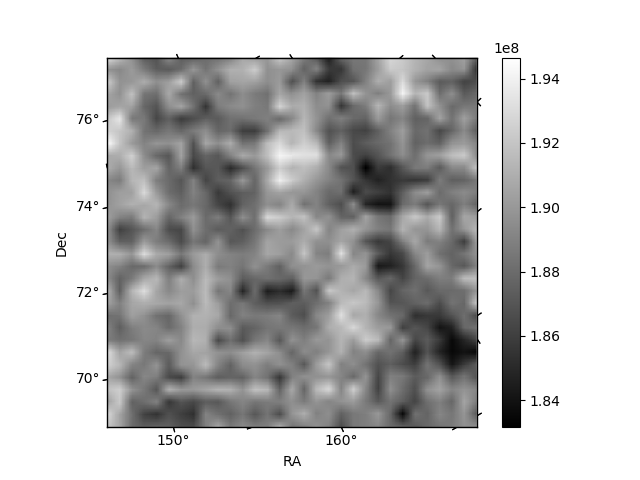
Histogram calculated using DETX and DETY for each event in the final _common_clean file
| Quadrant A | 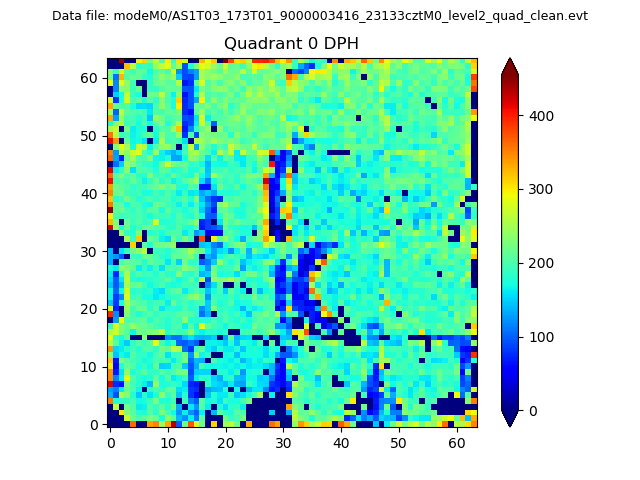 |
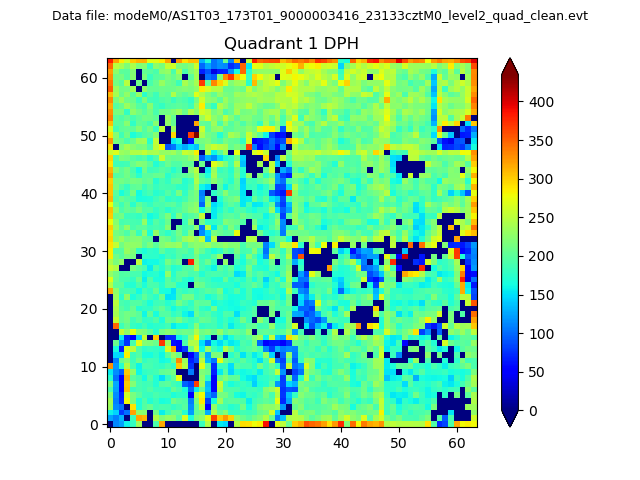 |
Quadrant B |
|---|---|---|---|
| Quadrant D | 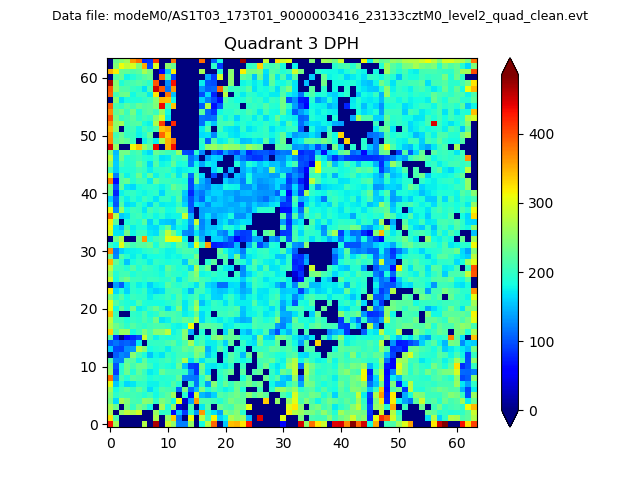 |
 |
Quadrant C |
| Plot type | Count rate plots | Images |
|---|---|---|
| Comparison with Poisson distribution Blue bars denote a histogram of data divided into 1 sec bins. Red curve is a Poisson curve with rate = median count rate of data. |
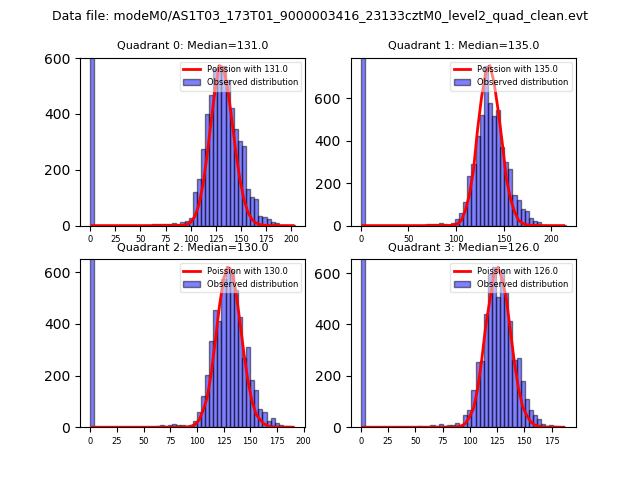 |
 |
| Quadrant-wise count rates Data is divided into 100 sec bins |
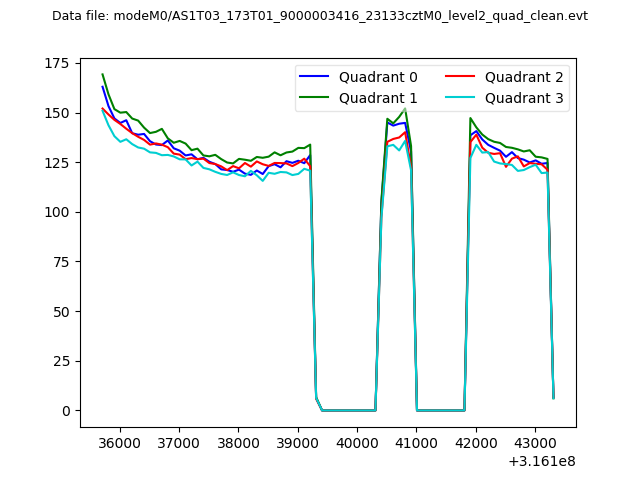 |
|
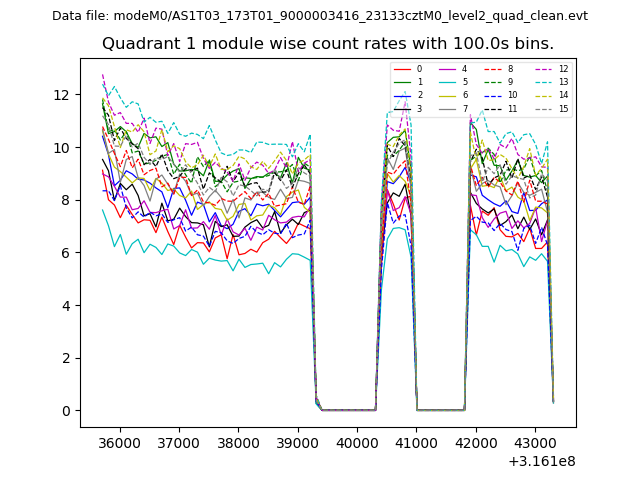
| Module-wise count rates for Quadrant A Data is divided into 100 sec bins |
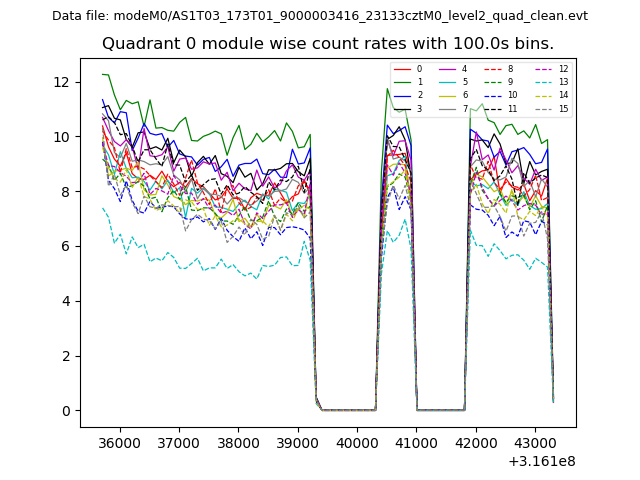 |
 |
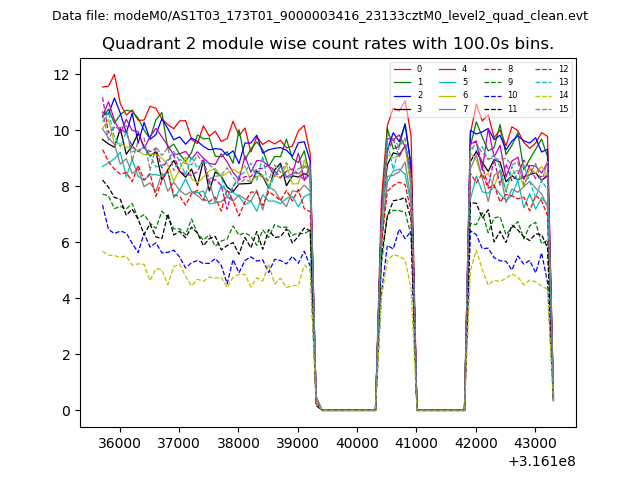
| Module-wise count rates for Quadrant B Data is divided into 100 sec bins |
 |
 |
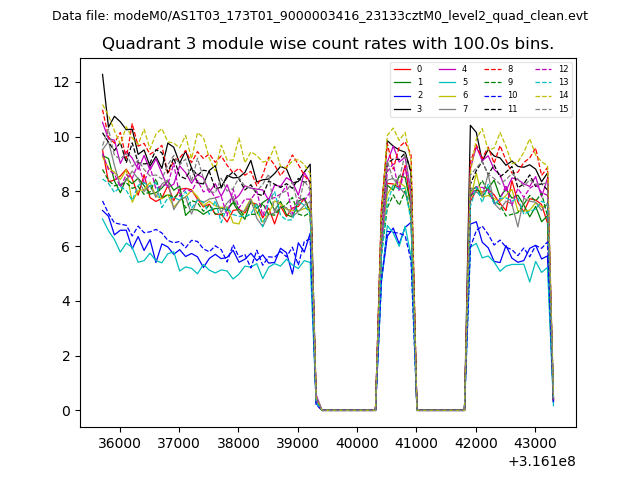
| Module-wise count rates for Quadrant C Data is divided into 100 sec bins |
 |
 |
| Module-wise count rates for Quadrant D Data is divided into 100 sec bins |
 |
 |
| Parameter | Plot |
|---|---|
| CZT HV Monitor |  |
| D_VDD | 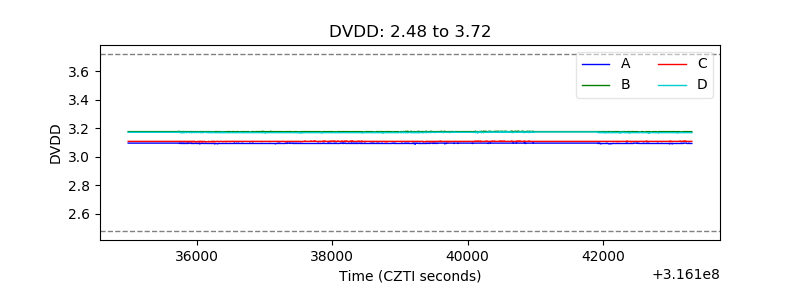 |
| Temperature 1 | 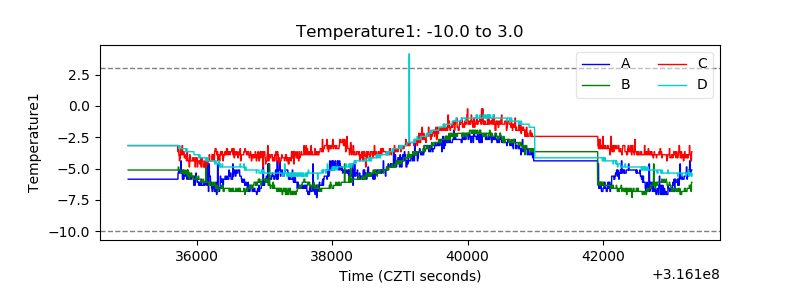 |
| Veto HV Monitor | 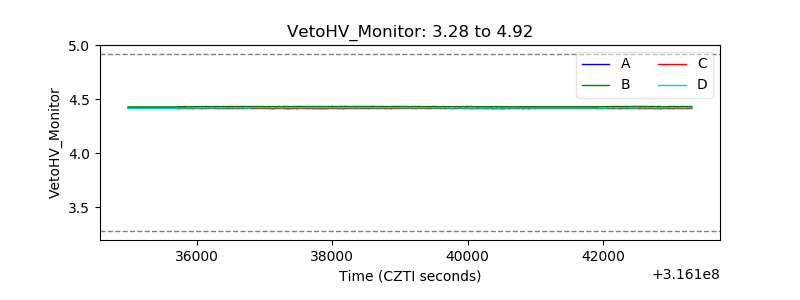 |
| Veto LLD | 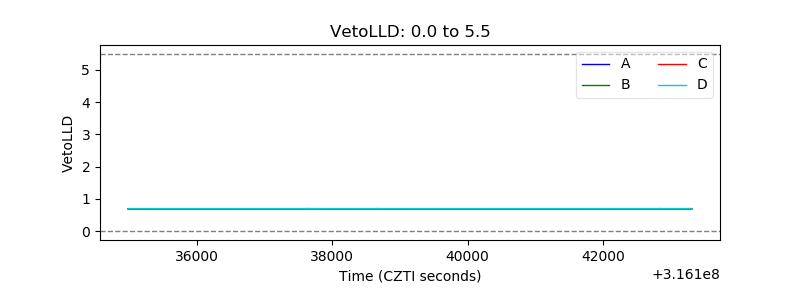 |
| Alpha Counter | 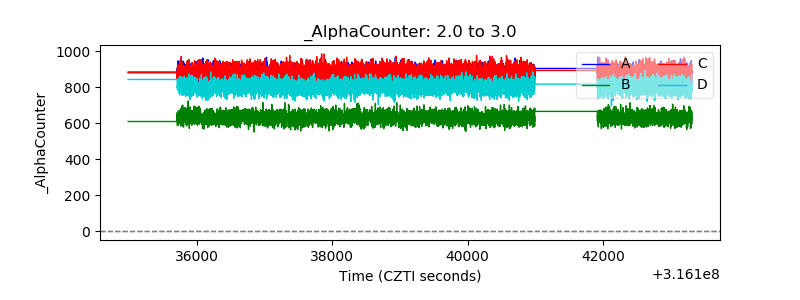 |
| _CPM_Rate |  |
| CZT Counter | 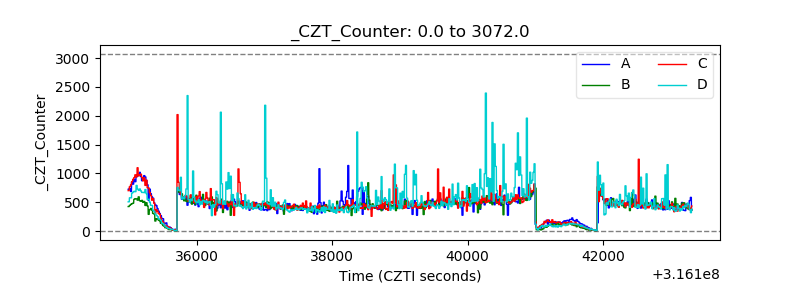 |
| +2.5 Volts monitor | 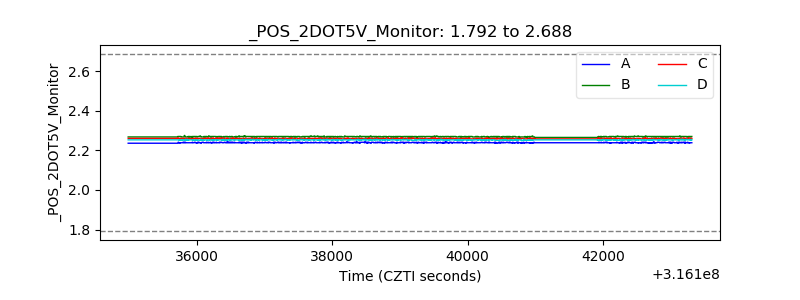 |
| +5 Volts monitor |  |
| _ROLL_ROT | 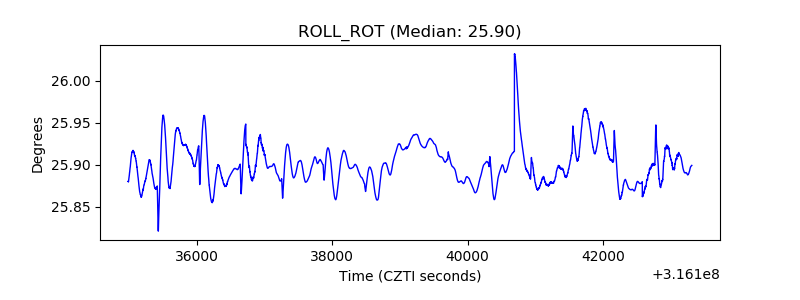 |
| _Roll_DEC | 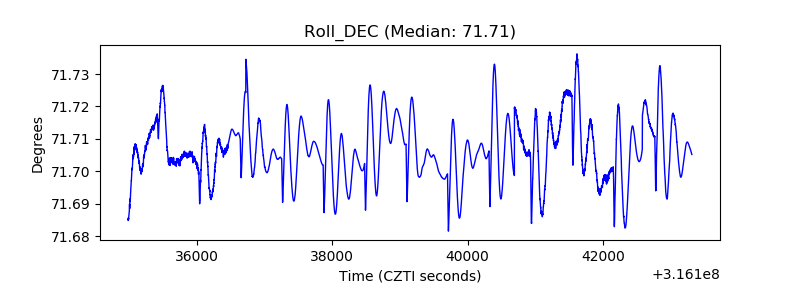 |
| _Roll_RA | 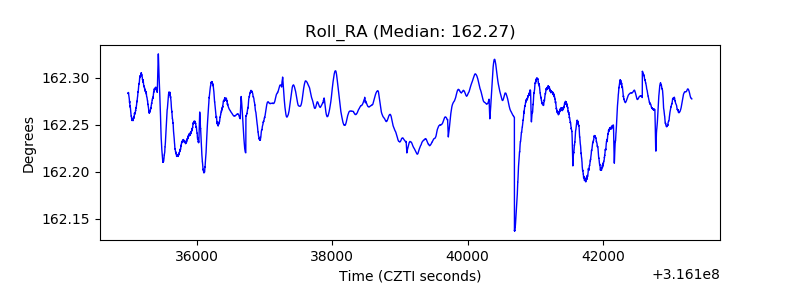 |
| Veto Counter | 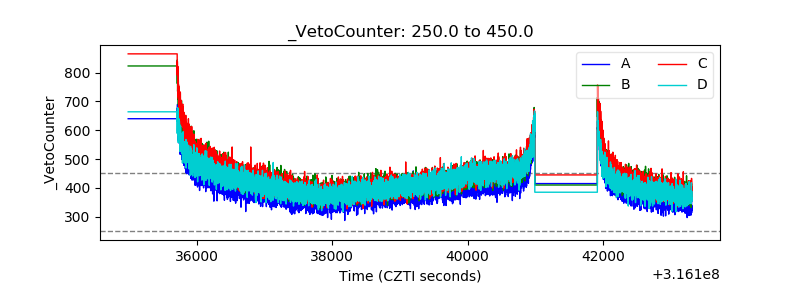 |