| Param | Original file | Final file |
|---|---|---|
| Filename | modeM0/AS1T03_173T01_9000003416_23135cztM0_level2.evt | modeM0/AS1T03_173T01_9000003416_23135cztM0_level2_quad_clean.evt |
| Size (bytes) | 603,264,960 | 133,905,600 |
| Size | 575.3 MB | 127.7 MB |
| Events in quadrant A | 3,790,823 | 887,061 |
| Events in quadrant B | 3,900,686 | 906,620 |
| Events in quadrant C | 3,896,695 | 871,479 |
| Events in quadrant D | 6,130,794 | 826,011 |
| Mode M9 | |||
|---|---|---|---|
| Quadrant | BADHDUFLAG | Total packets | Discarded packets |
| A | 0 | 5 | 0 |
| B | 0 | 5 | 0 |
| C | 0 | 5 | 0 |
| D | 0 | 5 | 0 |
| Mode M0 | |||
|---|---|---|---|
| Quadrant | BADHDUFLAG | Total packets | Discarded packets |
| A | 0 | 16949 | 1 |
| B | 0 | 17134 | 1 |
| C | 0 | 17022 | 1 |
| D | 0 | 23879 | 1 |
| Mode SS | |||
|---|---|---|---|
| Quadrant | BADHDUFLAG | Total packets | Discarded packets |
| A | 0 | 164 | 0 |
| B | 0 | 164 | 0 |
| C | 0 | 164 | 0 |
| D | 0 | 164 | 0 |
| Quadrant | Total seconds | Saturated seconds | Saturation percentage |
|---|---|---|---|
| A | 8117 | 204 | 2.513244% |
| B | 8117 | 271 | 3.338672% |
| C | 8118 | 193 | 2.377433% |
| D | 8118 | 739 | 9.103227% |
Noise dominated data is calculated using 1-second bins in cleaned event files. If a bin has >2000 counts, and if more than 50% of those come from <1% of pixels, then it is considered to be noise-dominated and hence unusable.
| Quadrant | # 1 sec bins | Bins with >0 counts | Bins with >2000 counts | High rate bins dominated by noise | Noise dominated (total time) | Noise dominated (detector-on time) | Marked lightcurve |
|---|---|---|---|---|---|---|---|
| A | 8562 | 8120 | 0 | 0 | 0.00% | 0.00% | 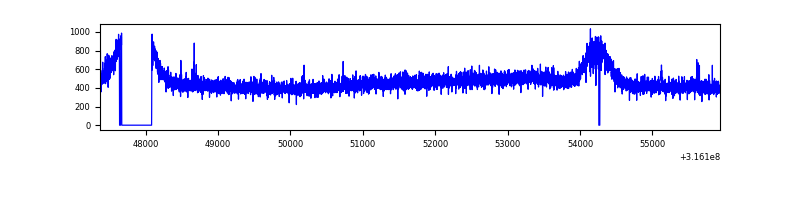 |
| B | 8562 | 8120 | 2 | 2 | 0.02% | 0.02% | 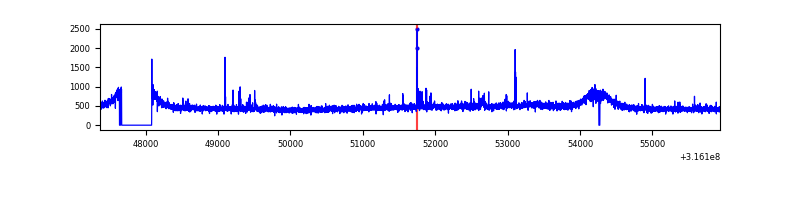 |
| C | 8563 | 8121 | 0 | 0 | 0.00% | 0.00% | 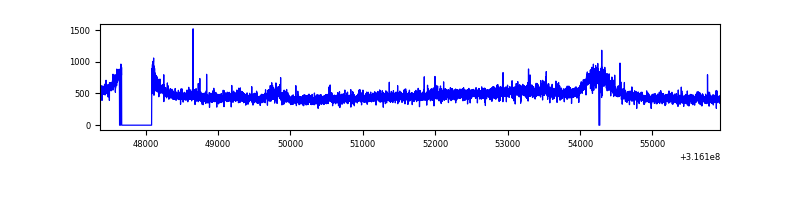 |
| D | 8563 | 8121 | 556 | 556 | 6.49% | 6.85% | 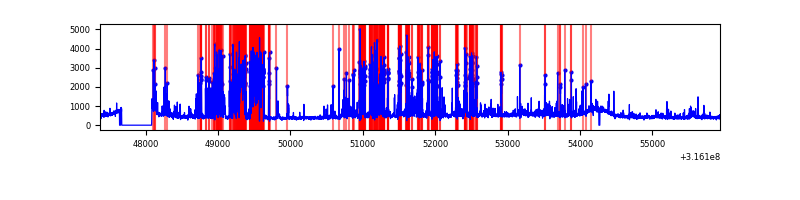 |
Top three noisy pixels from each quadrant. If the there are fewer than three noisy pixels in the level2.evt file, extra rows are filled as -1
| Pixel properties | Quadrant properties | ||||||
|---|---|---|---|---|---|---|---|
| Quadrant | DetID | PixID | Counts | Sigma | Mean | Median | Sigma |
| A | 6 | 16 | 26688 | 129.35 | 976 | 952 | 199.0 |
| A | 13 | 254 | 12108 | 56.07 | 976 | 952 | 199.0 |
| A | 3 | 137 | 9070 | 40.8 | 976 | 952 | 199.0 |
| B | 12 | 111 | 23383 | 118.97 | 978 | 948 | 188.6 |
| B | 11 | 111 | 20510 | 103.74 | 978 | 948 | 188.6 |
| B | 14 | 111 | 18289 | 91.96 | 978 | 948 | 188.6 |
| C | 14 | 238 | 147236 | 668.75 | 937 | 943 | 218.8 |
| C | 8 | 208 | 38581 | 172.05 | 937 | 943 | 218.8 |
| C | 0 | 207 | 25534 | 112.41 | 937 | 943 | 218.8 |
| D | 1 | 52 | 1212282 | 5425.42 | 921 | 892 | 223.3 |
| D | 1 | 239 | 1010792 | 4523.01 | 921 | 892 | 223.3 |
| D | 10 | 103 | 272472 | 1216.32 | 921 | 892 | 223.3 |
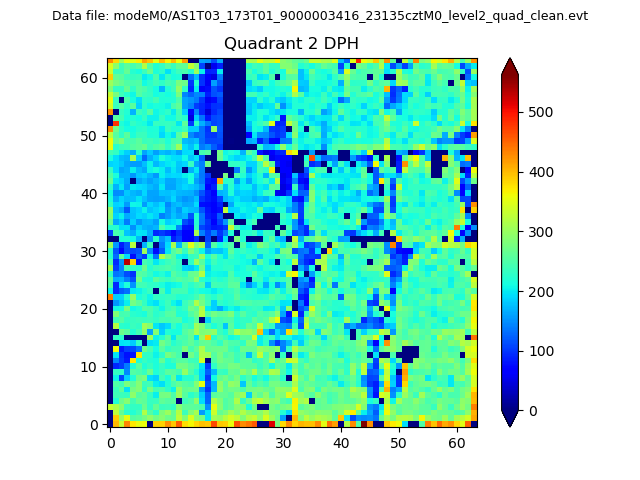
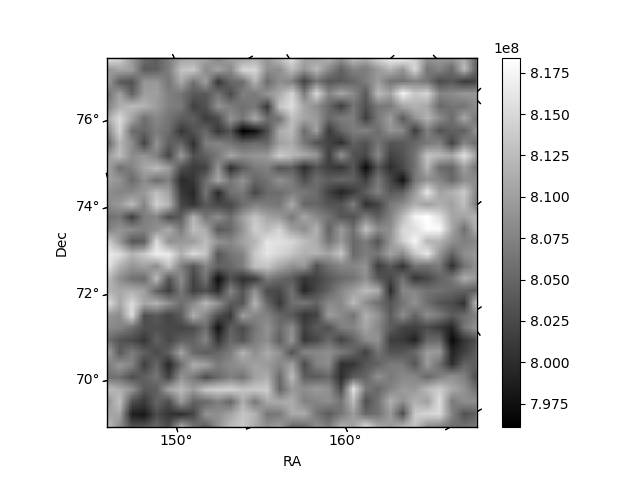
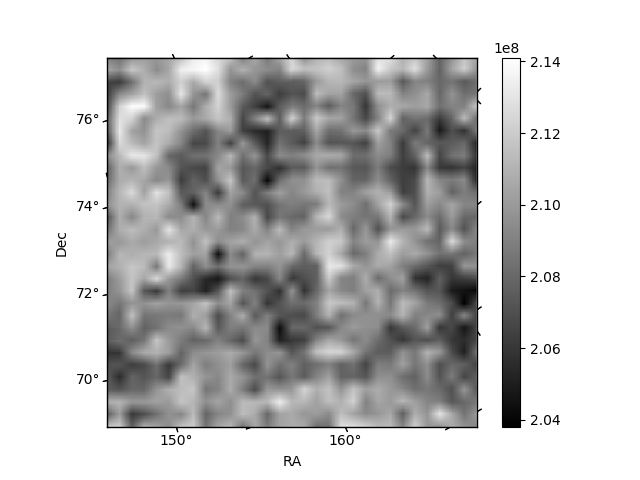
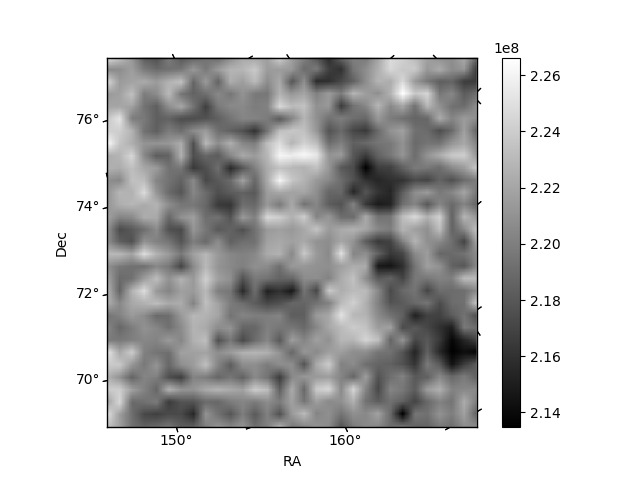
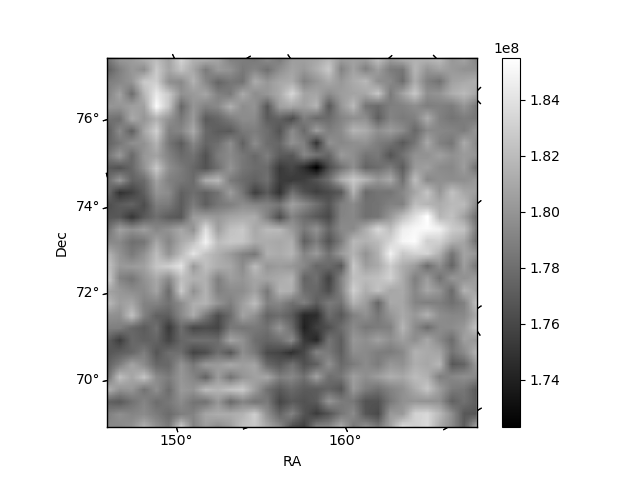
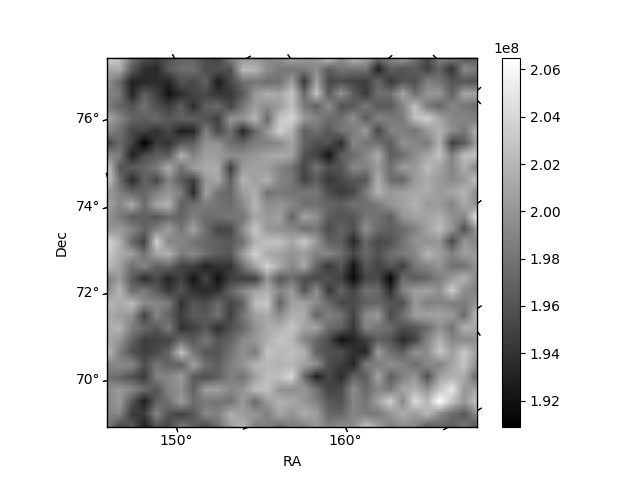
Histogram calculated using DETX and DETY for each event in the final _common_clean file
| Quadrant A | 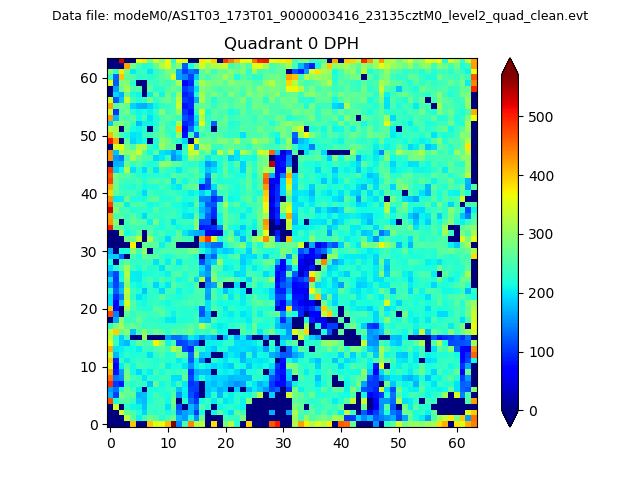 |
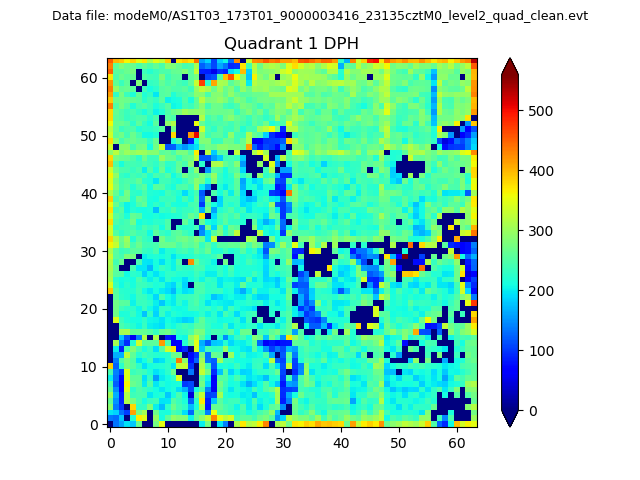 |
Quadrant B |
|---|---|---|---|
| Quadrant D | 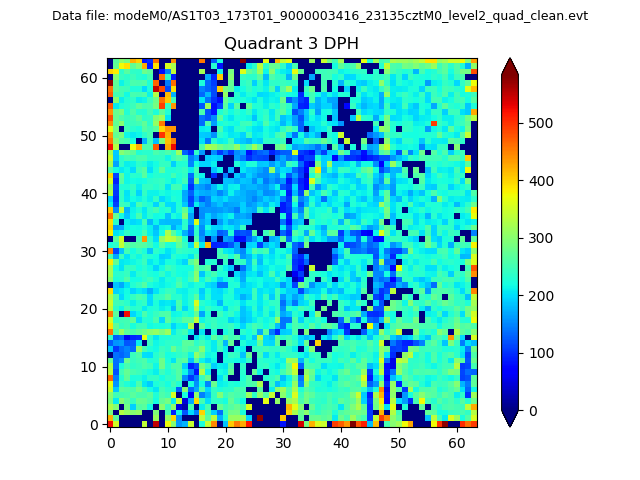 |
 |
Quadrant C |
| Plot type | Count rate plots | Images |
|---|---|---|
| Comparison with Poisson distribution Blue bars denote a histogram of data divided into 1 sec bins. Red curve is a Poisson curve with rate = median count rate of data. |
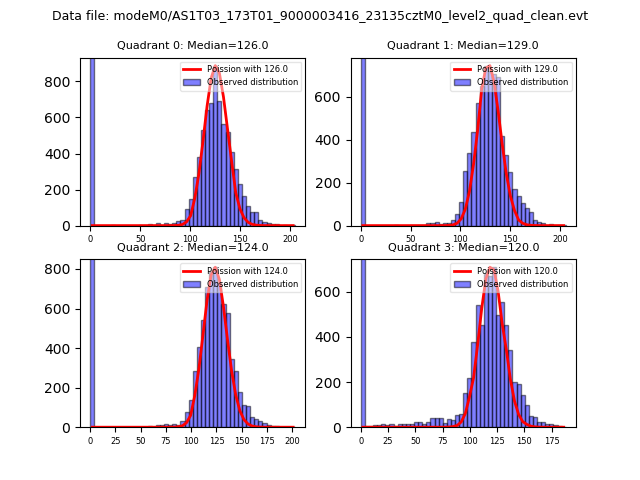 |
 |
| Quadrant-wise count rates Data is divided into 100 sec bins |
 |
|
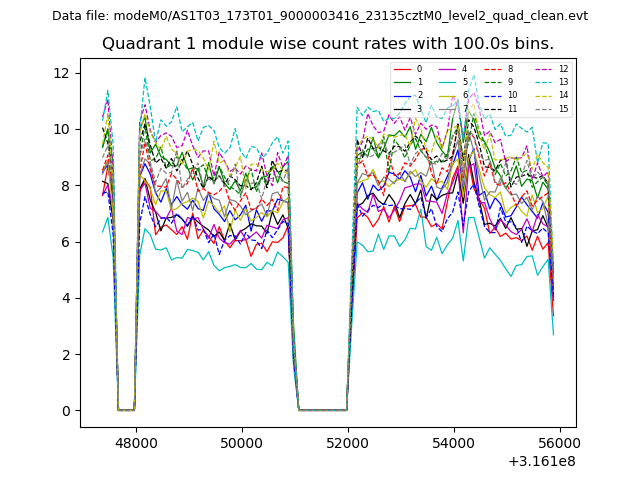
| Module-wise count rates for Quadrant A Data is divided into 100 sec bins |
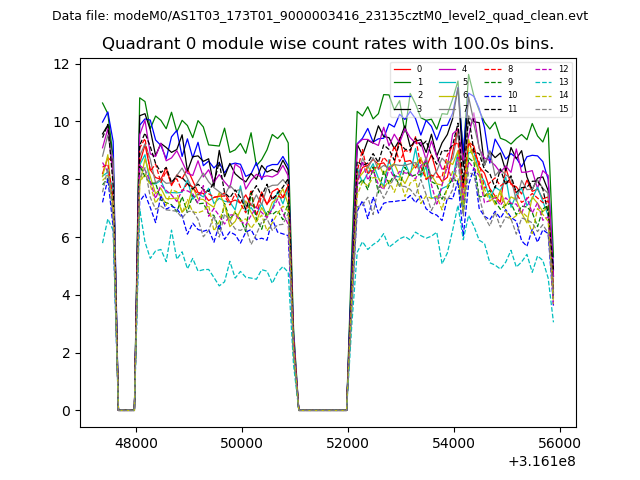 |
 |
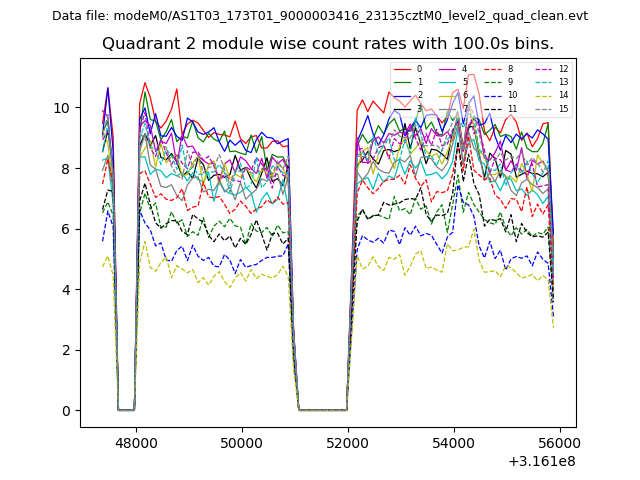
| Module-wise count rates for Quadrant B Data is divided into 100 sec bins |
 |
 |
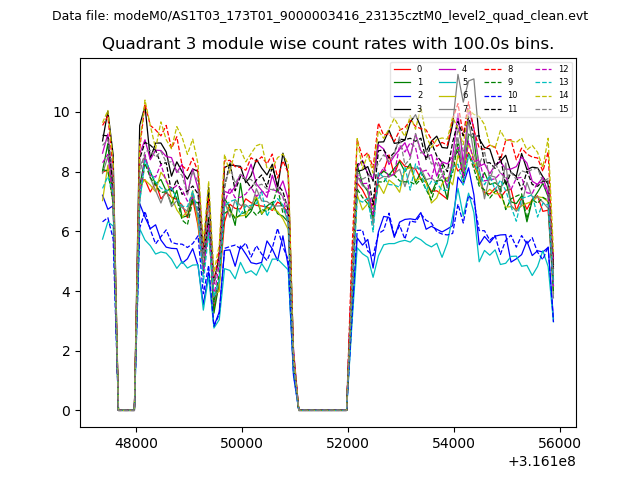
| Module-wise count rates for Quadrant C Data is divided into 100 sec bins |
 |
 |
| Module-wise count rates for Quadrant D Data is divided into 100 sec bins |
 |
 |
| Parameter | Plot |
|---|---|
| CZT HV Monitor | 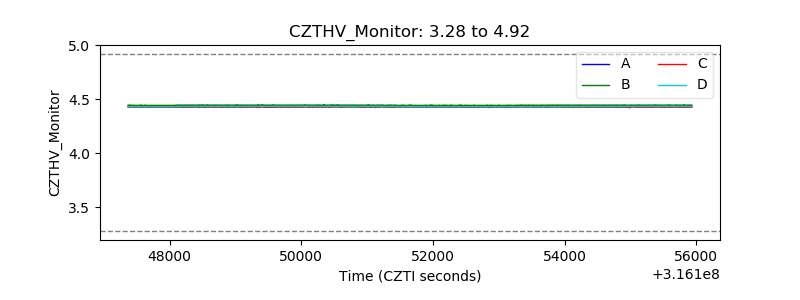 |
| D_VDD | 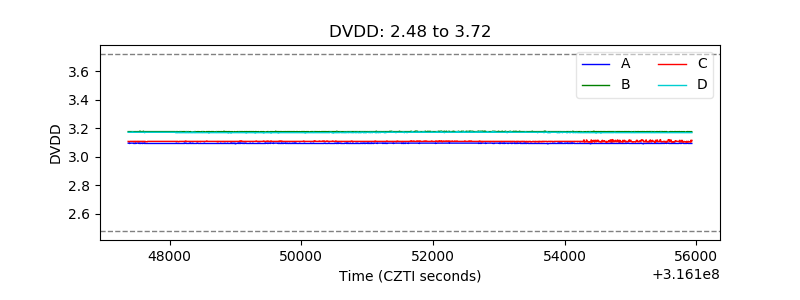 |
| Temperature 1 | 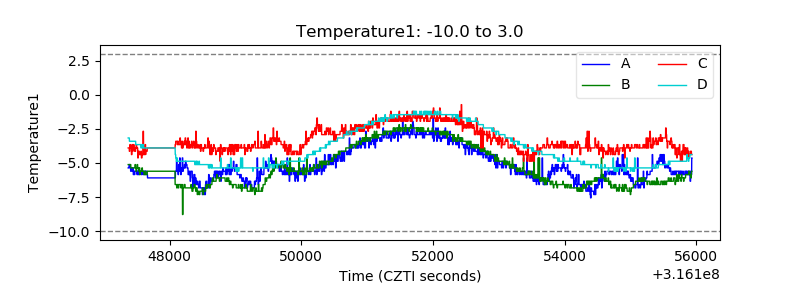 |
| Veto HV Monitor | 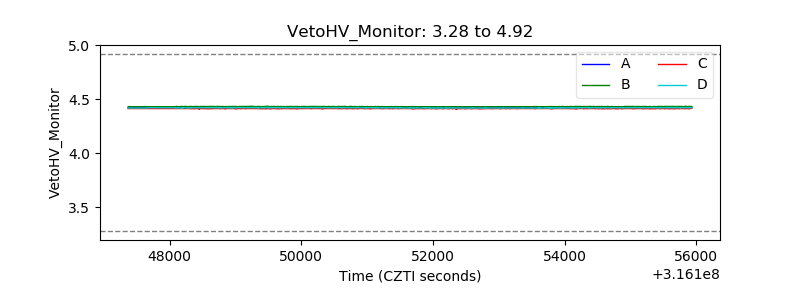 |
| Veto LLD | 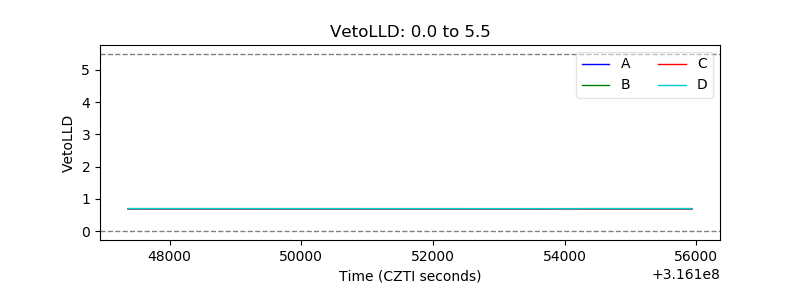 |
| Alpha Counter | 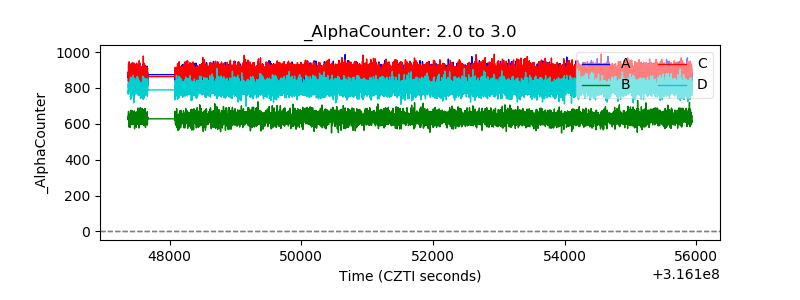 |
| _CPM_Rate | 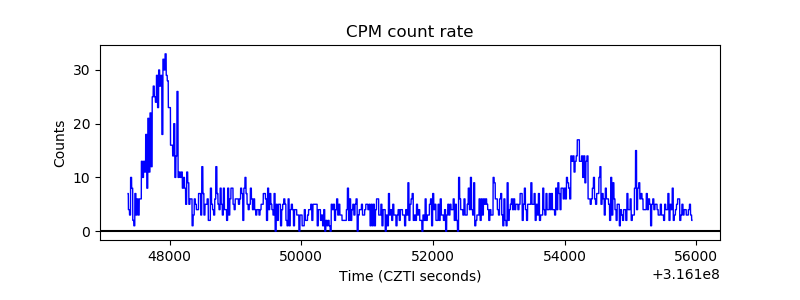 |
| CZT Counter | 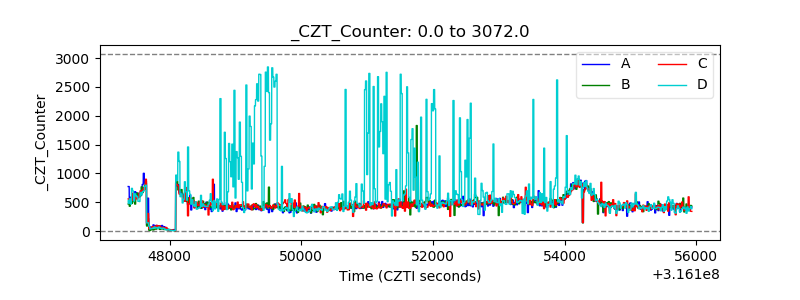 |
| +2.5 Volts monitor | 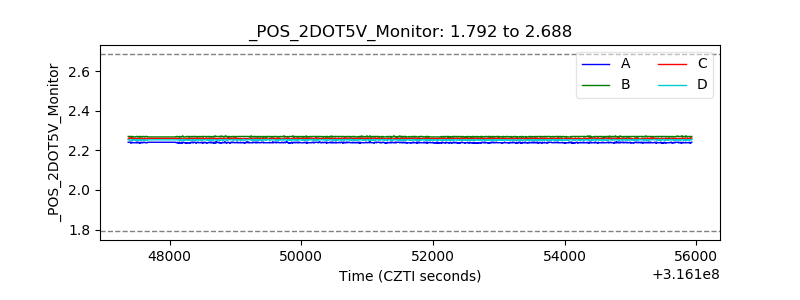 |
| +5 Volts monitor |  |
| _ROLL_ROT | 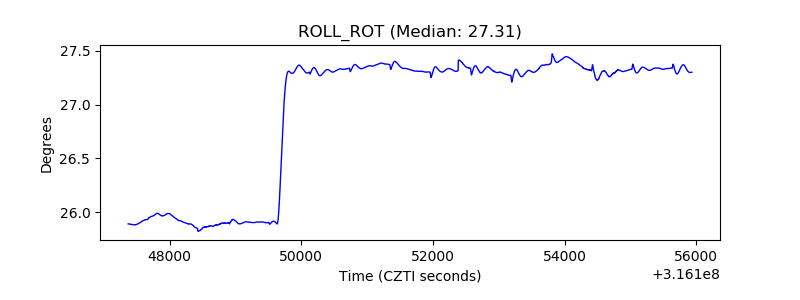 |
| _Roll_DEC | 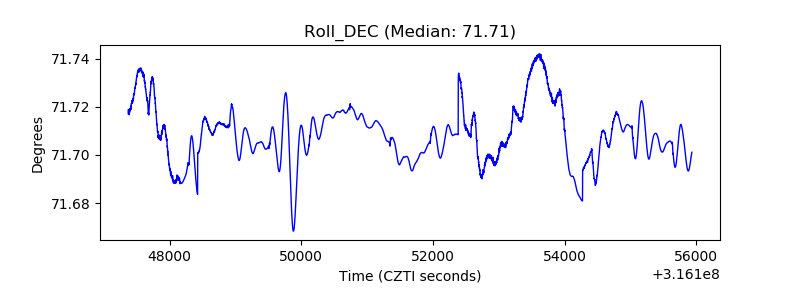 |
| _Roll_RA | 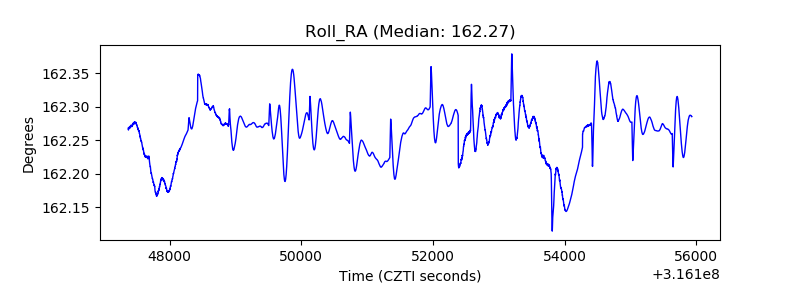 |
| Veto Counter | 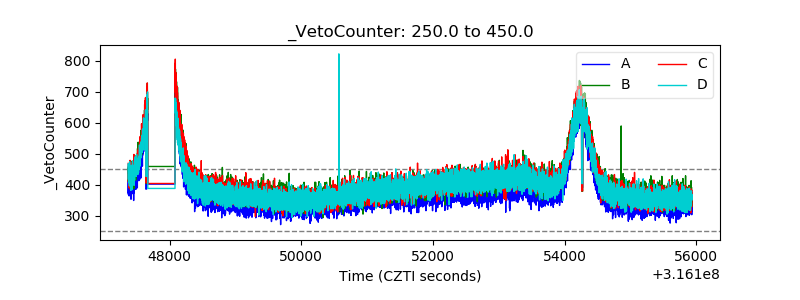 |