| Param | Original file | Final file |
|---|---|---|
| Filename | modeM0/AS1T03_173T01_9000003416_23139cztM0_level2.evt | modeM0/AS1T03_173T01_9000003416_23139cztM0_level2_quad_clean.evt |
| Size (bytes) | 1,232,487,360 | 266,872,320 |
| Size | 1.1 GB | 254.5 MB |
| Events in quadrant A | 8,275,931 | 1,732,331 |
| Events in quadrant B | 8,581,151 | 1,762,676 |
| Events in quadrant C | 8,603,609 | 1,684,957 |
| Events in quadrant D | 10,630,257 | 1,645,594 |
| Mode M9 | |||
|---|---|---|---|
| Quadrant | BADHDUFLAG | Total packets | Discarded packets |
| A | 0 | 18 | 0 |
| B | 0 | 18 | 0 |
| C | 0 | 18 | 0 |
| D | 0 | 18 | 0 |
| Mode M0 | |||
|---|---|---|---|
| Quadrant | BADHDUFLAG | Total packets | Discarded packets |
| A | 0 | 36873 | 4 |
| B | 0 | 37369 | 3 |
| C | 0 | 37349 | 3 |
| D | 0 | 44149 | 3 |
| Mode SS | |||
|---|---|---|---|
| Quadrant | BADHDUFLAG | Total packets | Discarded packets |
| A | 0 | 370 | 0 |
| B | 0 | 370 | 0 |
| C | 0 | 370 | 0 |
| D | 0 | 370 | 0 |
| Quadrant | Total seconds | Saturated seconds | Saturation percentage |
|---|---|---|---|
| A | 18249 | 172 | 0.942517% |
| B | 18249 | 194 | 1.063072% |
| C | 18249 | 224 | 1.227465% |
| D | 18249 | 742 | 4.065976% |
Noise dominated data is calculated using 1-second bins in cleaned event files. If a bin has >2000 counts, and if more than 50% of those come from <1% of pixels, then it is considered to be noise-dominated and hence unusable.
| Quadrant | # 1 sec bins | Bins with >0 counts | Bins with >2000 counts | High rate bins dominated by noise | Noise dominated (total time) | Noise dominated (detector-on time) | Marked lightcurve |
|---|---|---|---|---|---|---|---|
| A | 20154 | 18251 | 0 | 0 | 0.00% | 0.00% | 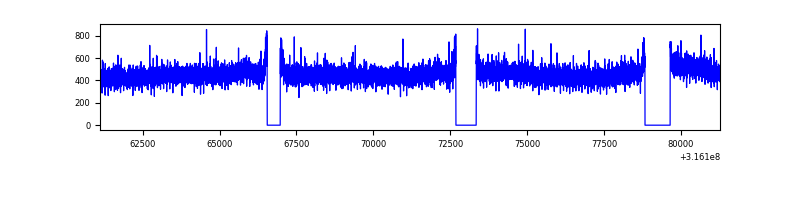 |
| B | 20154 | 18251 | 7 | 7 | 0.03% | 0.04% | 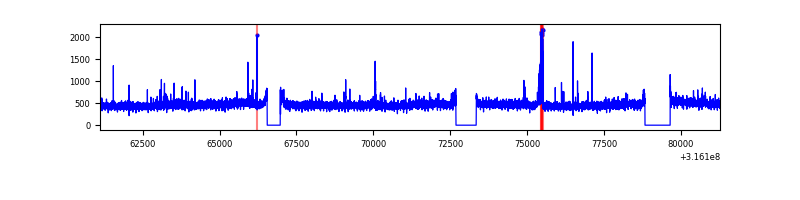 |
| C | 20154 | 18251 | 10 | 10 | 0.05% | 0.05% | 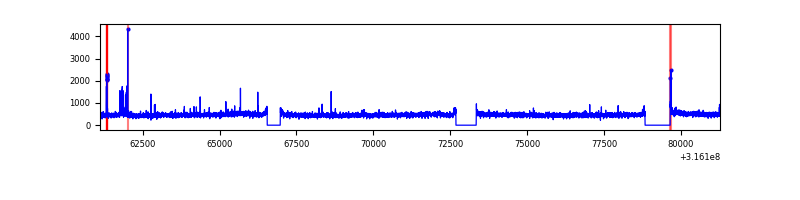 |
| D | 20154 | 18251 | 562 | 562 | 2.79% | 3.08% | 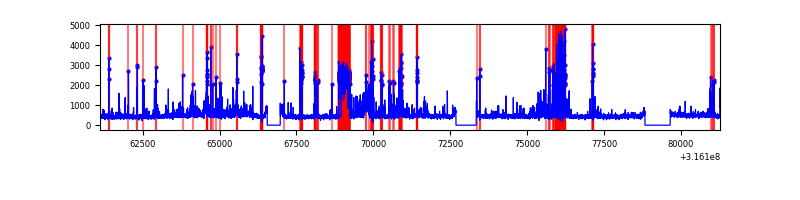 |
Top three noisy pixels from each quadrant. If the there are fewer than three noisy pixels in the level2.evt file, extra rows are filled as -1
| Pixel properties | Quadrant properties | ||||||
|---|---|---|---|---|---|---|---|
| Quadrant | DetID | PixID | Counts | Sigma | Mean | Median | Sigma |
| A | 13 | 254 | 24820 | 52.98 | 2142 | 2096 | 428.9 |
| A | 6 | 16 | 20860 | 43.75 | 2142 | 2096 | 428.9 |
| A | 3 | 137 | 19335 | 40.2 | 2142 | 2096 | 428.9 |
| B | 0 | 190 | 152183 | 368.47 | 2137 | 2081 | 407.4 |
| B | 12 | 111 | 50308 | 118.39 | 2137 | 2081 | 407.4 |
| B | 0 | 189 | 46317 | 108.59 | 2137 | 2081 | 407.4 |
| C | 14 | 238 | 325582 | 678.28 | 2050 | 2059 | 477.0 |
| C | 0 | 10 | 141689 | 292.74 | 2050 | 2059 | 477.0 |
| C | 7 | 247 | 72874 | 148.47 | 2050 | 2059 | 477.0 |
| D | 1 | 52 | 1572592 | 3139.03 | 2058 | 1993 | 500.3 |
| D | 1 | 239 | 518003 | 1031.31 | 2058 | 1993 | 500.3 |
| D | 13 | 153 | 262730 | 521.11 | 2058 | 1993 | 500.3 |
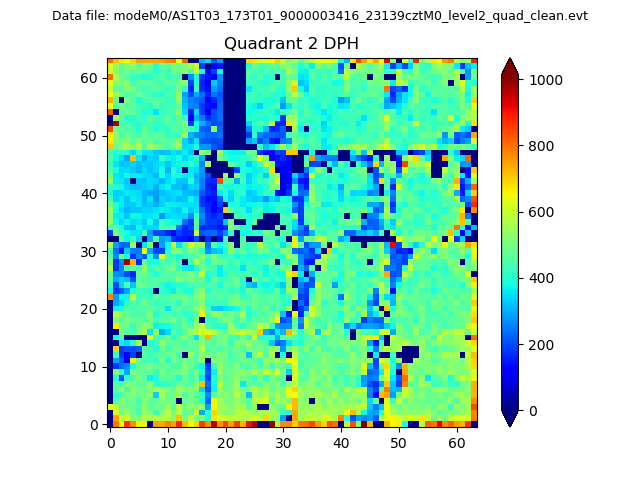
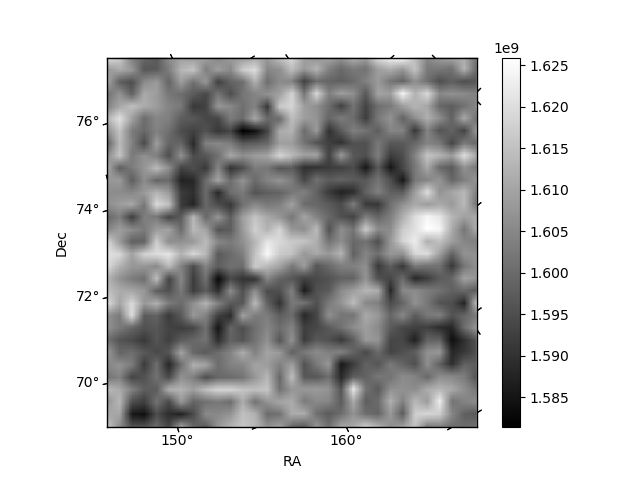
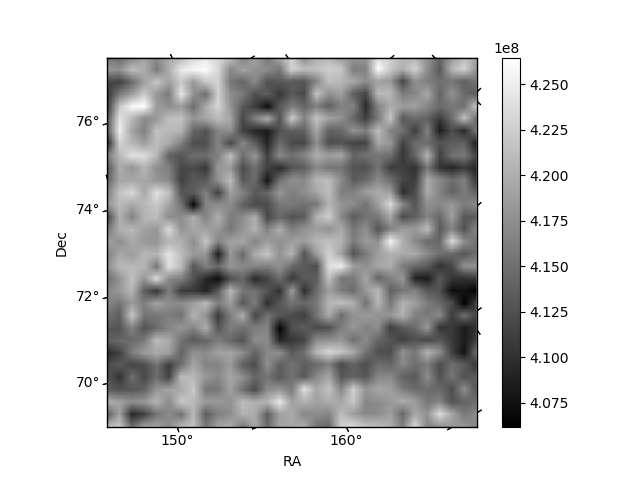
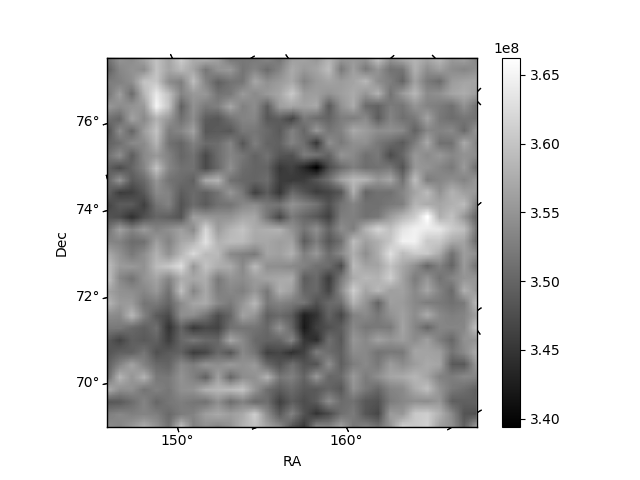
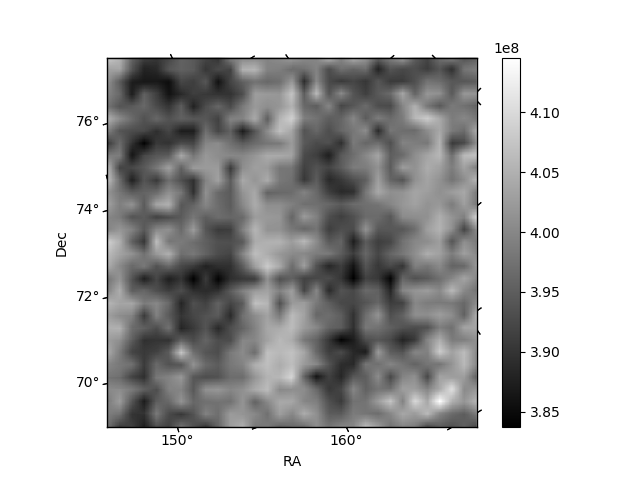
Histogram calculated using DETX and DETY for each event in the final _common_clean file
| Quadrant A | 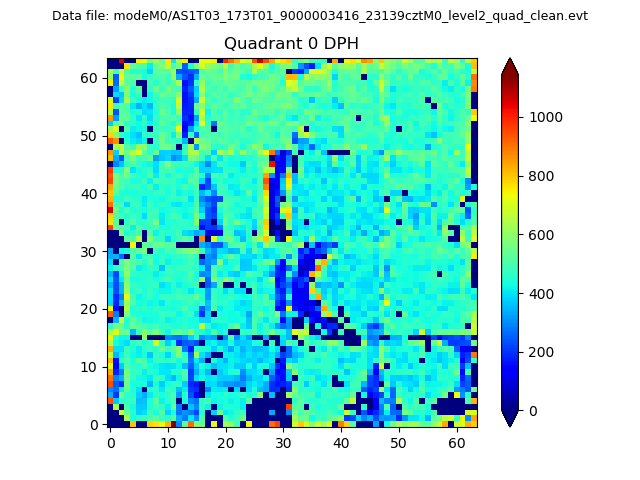 |
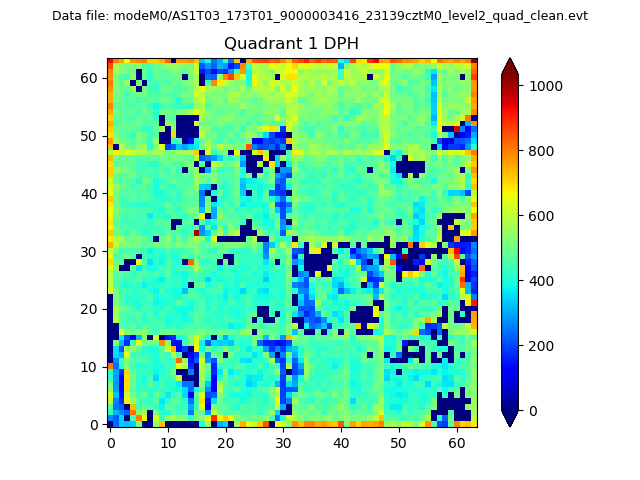 |
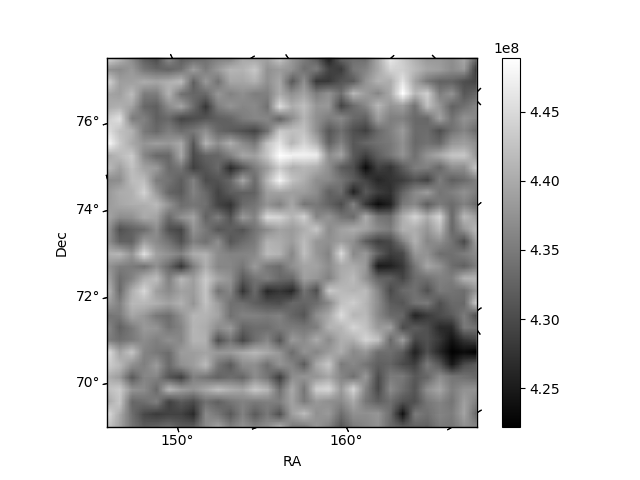
Quadrant B |
|---|---|---|---|
| Quadrant D | 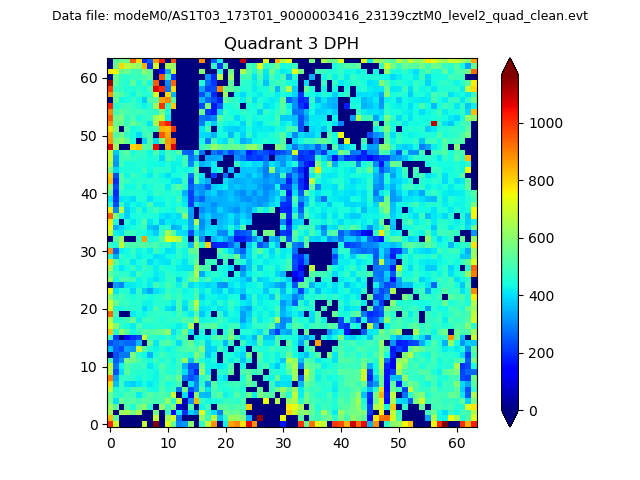 |
 |
Quadrant C |
| Plot type | Count rate plots | Images |
|---|---|---|
| Comparison with Poisson distribution Blue bars denote a histogram of data divided into 1 sec bins. Red curve is a Poisson curve with rate = median count rate of data. |
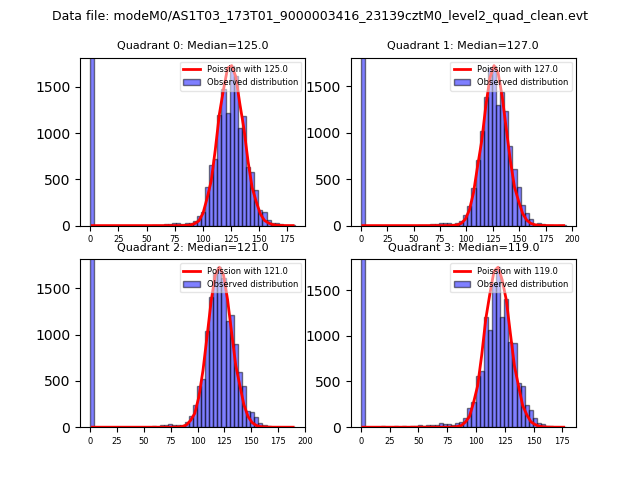 |
 |
| Quadrant-wise count rates Data is divided into 100 sec bins |
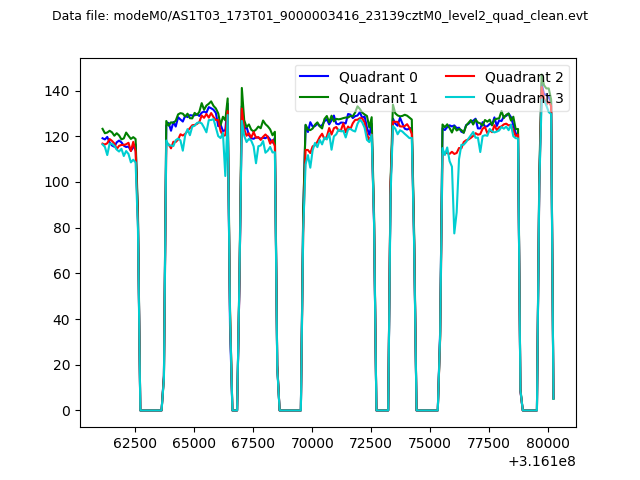 |
|
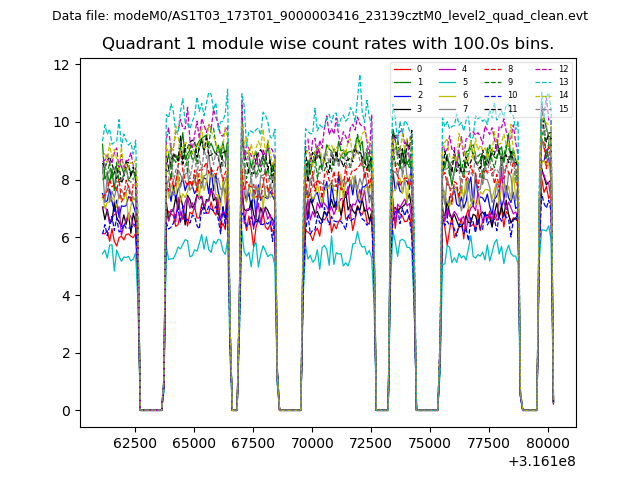
| Module-wise count rates for Quadrant A Data is divided into 100 sec bins |
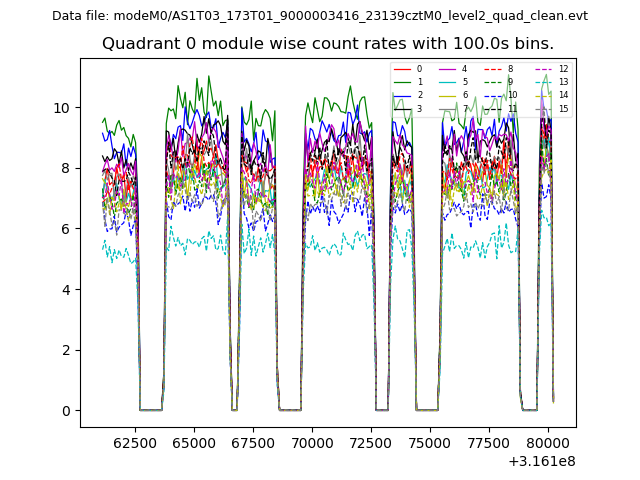 |
 |
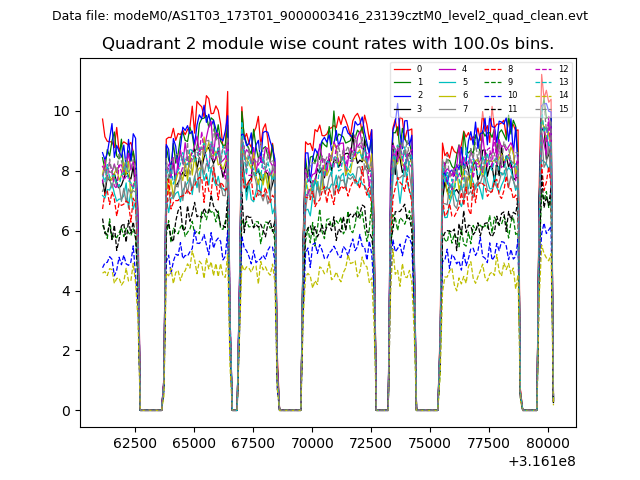
| Module-wise count rates for Quadrant B Data is divided into 100 sec bins |
 |
 |
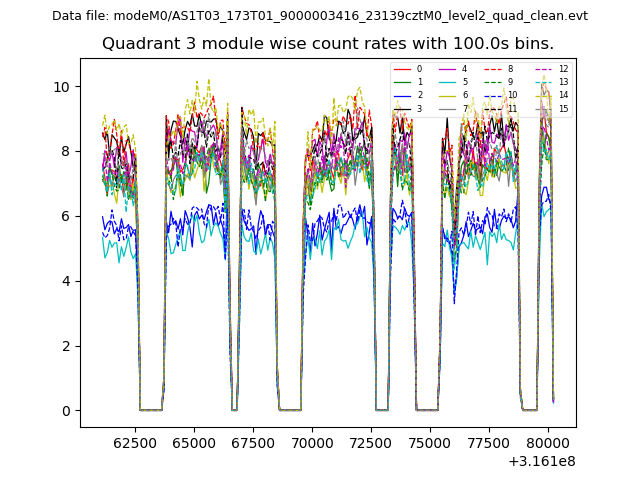
| Module-wise count rates for Quadrant C Data is divided into 100 sec bins |
 |
 |
| Module-wise count rates for Quadrant D Data is divided into 100 sec bins |
 |
 |
| Parameter | Plot |
|---|---|
| CZT HV Monitor | 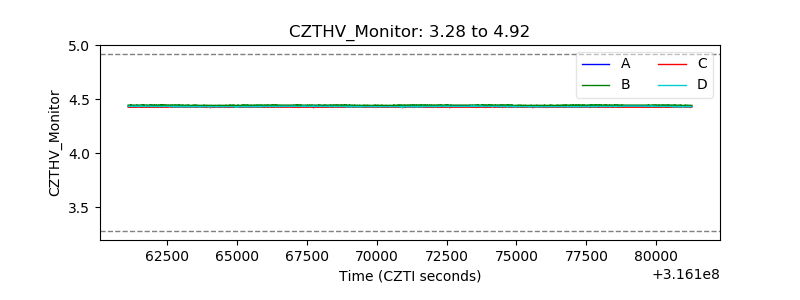 |
| D_VDD | 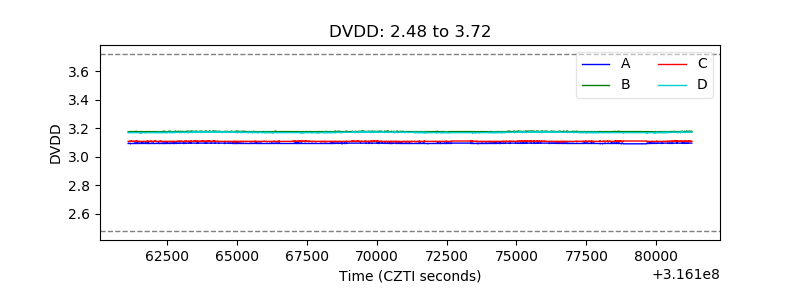 |
| Temperature 1 | 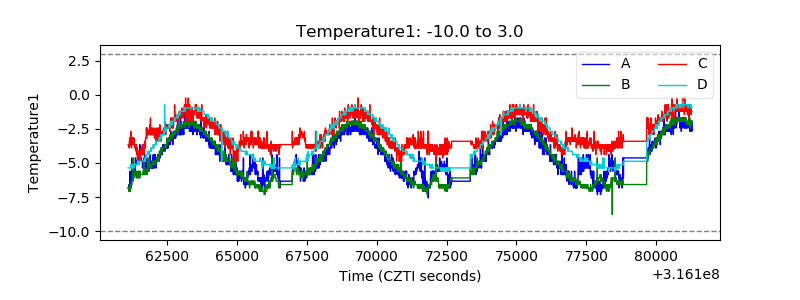 |
| Veto HV Monitor | 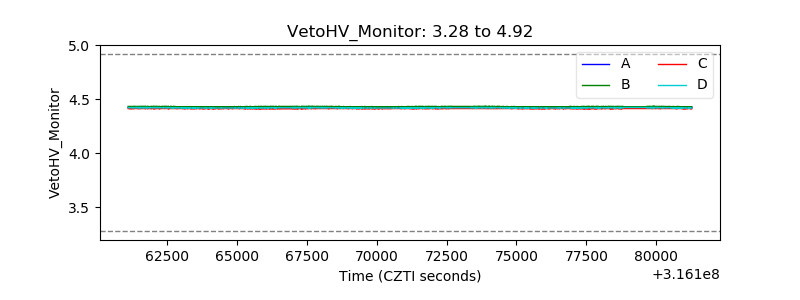 |
| Veto LLD | 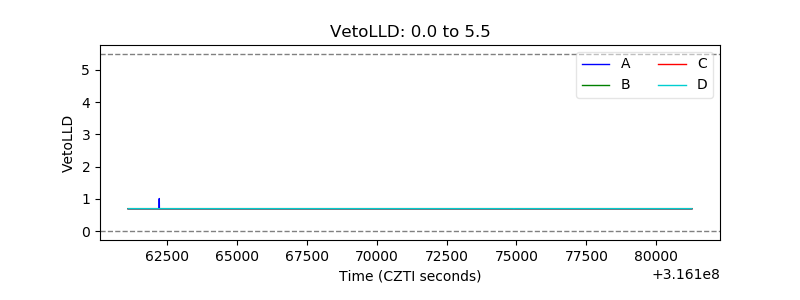 |
| Alpha Counter | 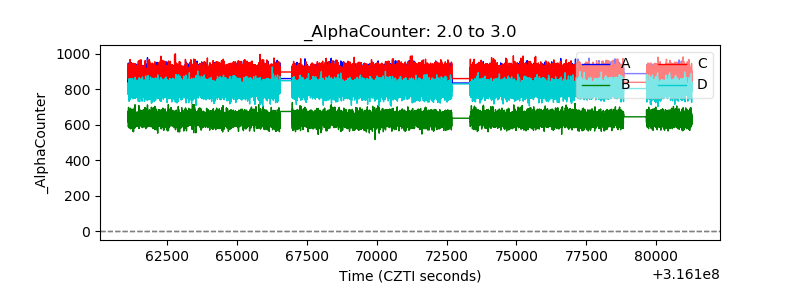 |
| _CPM_Rate | 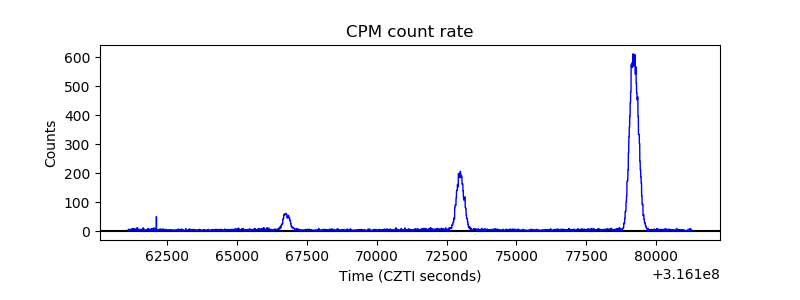 |
| CZT Counter | 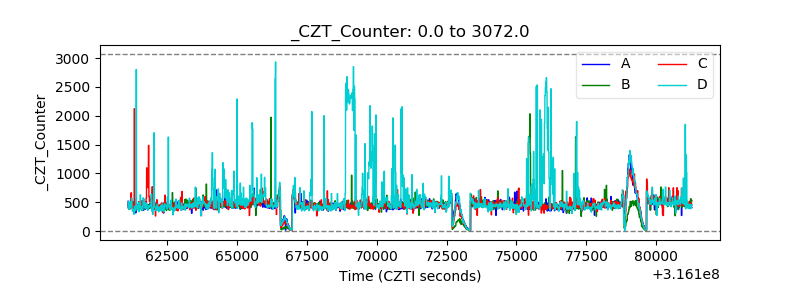 |
| +2.5 Volts monitor |  |
| +5 Volts monitor |  |
| _ROLL_ROT |  |
| _Roll_DEC | 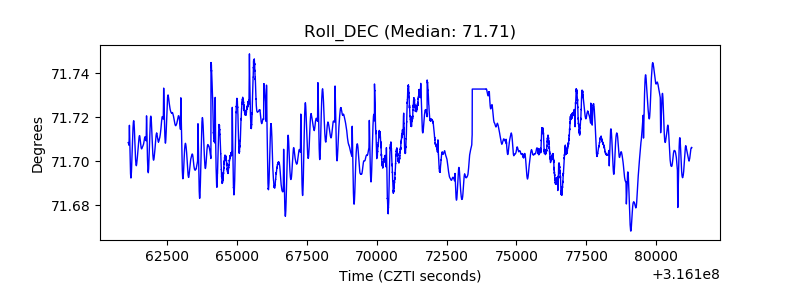 |
| _Roll_RA | 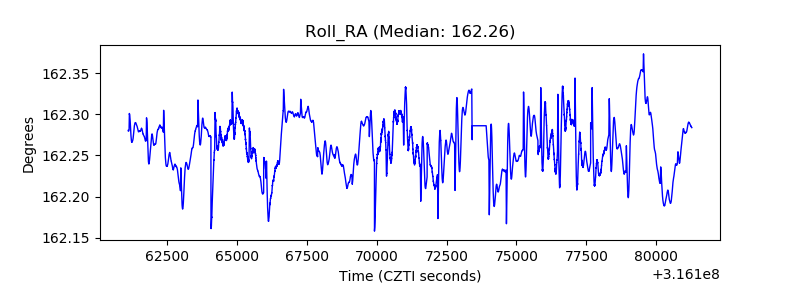 |
| Veto Counter | 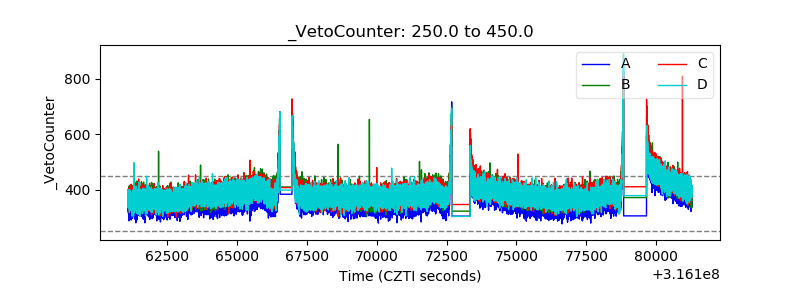 |