| Param | Original file | Final file |
|---|---|---|
| Filename | modeM0/AS1T03_173T01_9000003416_23140cztM0_level2.evt | modeM0/AS1T03_173T01_9000003416_23140cztM0_level2_quad_clean.evt |
| Size (bytes) | 459,803,520 | 92,128,320 |
| Size | 438.5 MB | 87.9 MB |
| Events in quadrant A | 3,261,738 | 590,553 |
| Events in quadrant B | 3,295,105 | 596,296 |
| Events in quadrant C | 3,470,682 | 564,557 |
| Events in quadrant D | 3,434,528 | 563,801 |
| Mode M9 | |||
|---|---|---|---|
| Quadrant | BADHDUFLAG | Total packets | Discarded packets |
| A | 0 | 10 | 0 |
| B | 0 | 10 | 0 |
| C | 0 | 10 | 0 |
| D | 0 | 10 | 0 |
| Mode M0 | |||
|---|---|---|---|
| Quadrant | BADHDUFLAG | Total packets | Discarded packets |
| A | 0 | 14101 | 2 |
| B | 0 | 14139 | 2 |
| C | 0 | 14625 | 2 |
| D | 0 | 14829 | 2 |
| Mode SS | |||
|---|---|---|---|
| Quadrant | BADHDUFLAG | Total packets | Discarded packets |
| A | 0 | 138 | 0 |
| B | 0 | 138 | 0 |
| C | 0 | 138 | 0 |
| D | 0 | 138 | 0 |
| Quadrant | Total seconds | Saturated seconds | Saturation percentage |
|---|---|---|---|
| A | 6813 | 50 | 0.733891% |
| B | 6814 | 65 | 0.953918% |
| C | 6814 | 146 | 2.142647% |
| D | 6814 | 77 | 1.130026% |
Noise dominated data is calculated using 1-second bins in cleaned event files. If a bin has >2000 counts, and if more than 50% of those come from <1% of pixels, then it is considered to be noise-dominated and hence unusable.
| Quadrant | # 1 sec bins | Bins with >0 counts | Bins with >2000 counts | High rate bins dominated by noise | Noise dominated (total time) | Noise dominated (detector-on time) | Marked lightcurve |
|---|---|---|---|---|---|---|---|
| A | 7818 | 6813 | 0 | 0 | 0.00% | 0.00% | 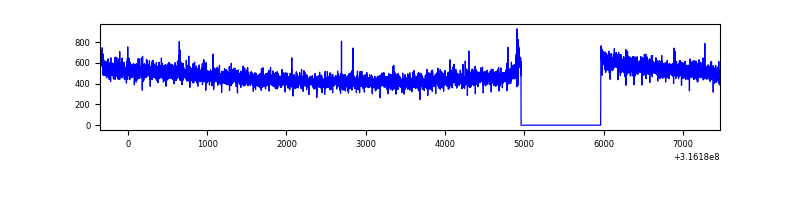 |
| B | 7819 | 6814 | 0 | 0 | 0.00% | 0.00% | 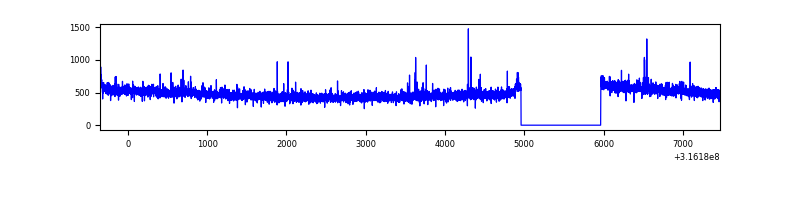 |
| C | 7819 | 6814 | 28 | 28 | 0.36% | 0.41% | 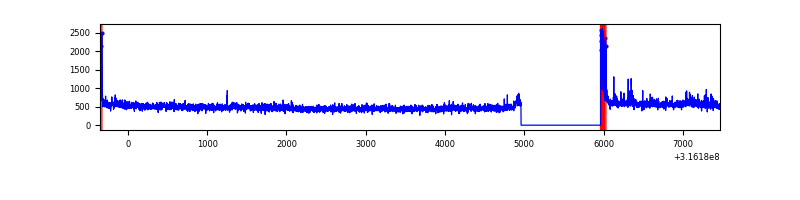 |
| D | 7819 | 6814 | 23 | 23 | 0.29% | 0.34% | 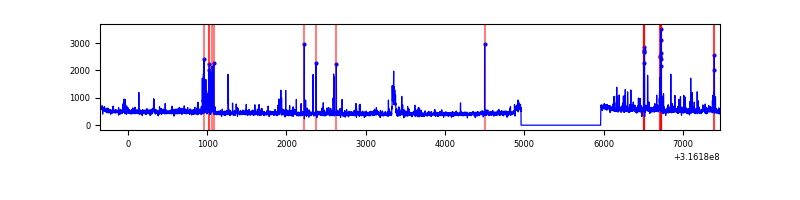 |
Top three noisy pixels from each quadrant. If the there are fewer than three noisy pixels in the level2.evt file, extra rows are filled as -1
| Pixel properties | Quadrant properties | ||||||
|---|---|---|---|---|---|---|---|
| Quadrant | DetID | PixID | Counts | Sigma | Mean | Median | Sigma |
| A | 6 | 16 | 33269 | 193.04 | 837 | 819 | 168.1 |
| A | 13 | 254 | 10340 | 56.64 | 837 | 819 | 168.1 |
| A | 0 | 226 | 7385 | 39.06 | 837 | 819 | 168.1 |
| B | 12 | 111 | 18778 | 112.72 | 831 | 806 | 159.4 |
| B | 0 | 189 | 17496 | 104.68 | 831 | 806 | 159.4 |
| B | 11 | 111 | 16781 | 100.19 | 831 | 806 | 159.4 |
| C | 14 | 238 | 127047 | 678.16 | 796 | 801 | 186.2 |
| C | 0 | 10 | 124099 | 662.32 | 796 | 801 | 186.2 |
| C | 7 | 247 | 61429 | 325.68 | 796 | 801 | 186.2 |
| D | 12 | 233 | 111124 | 560.16 | 811 | 785 | 197.0 |
| D | 1 | 52 | 94628 | 476.42 | 811 | 785 | 197.0 |
| D | 13 | 153 | 40121 | 199.7 | 811 | 785 | 197.0 |
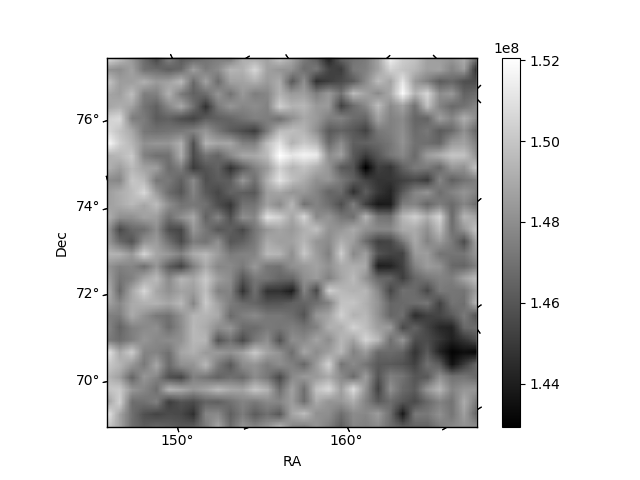
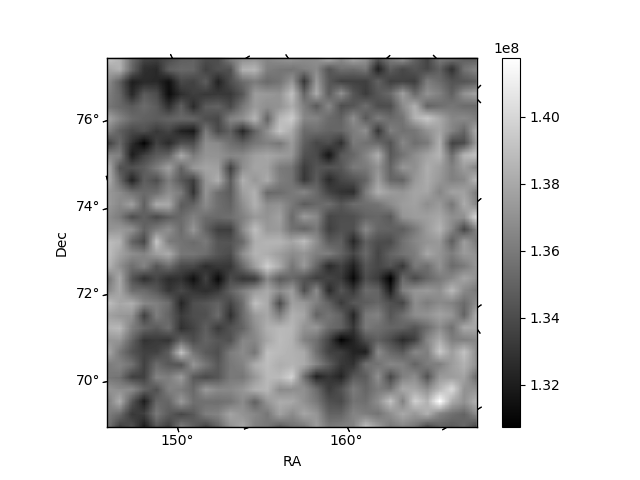
Histogram calculated using DETX and DETY for each event in the final _common_clean file
| Quadrant A | 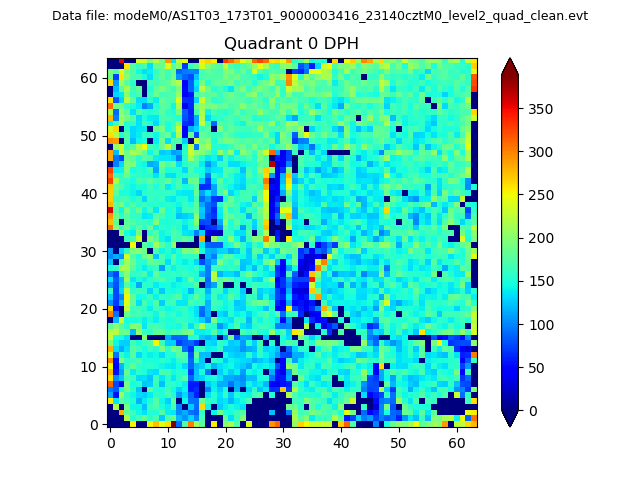 |
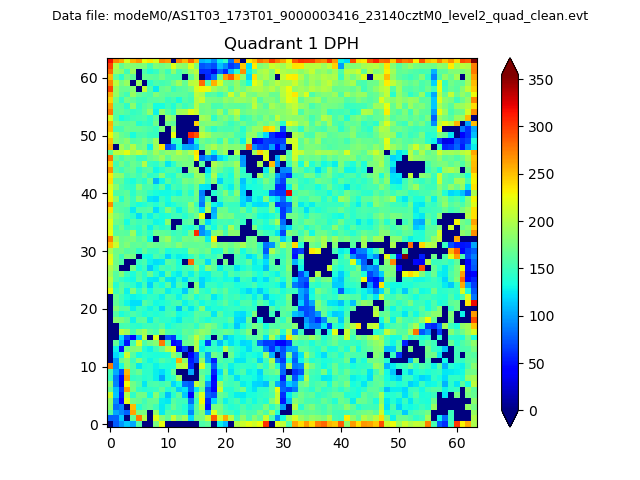 |
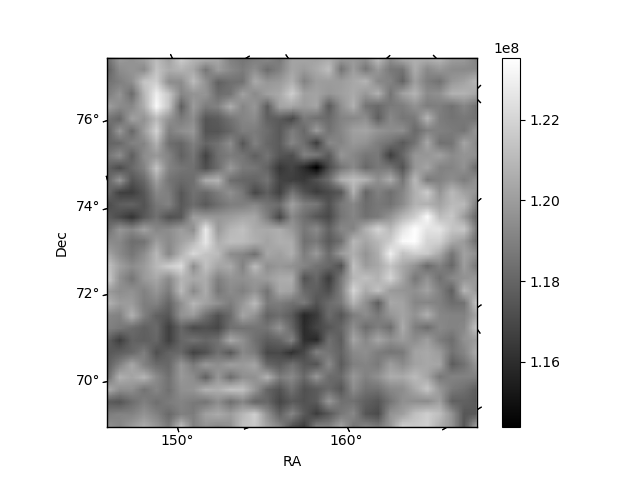
Quadrant B |
|---|---|---|---|
| Quadrant D | 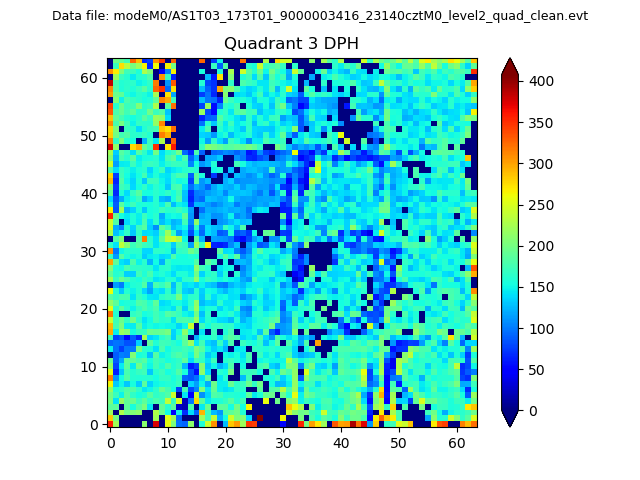 |
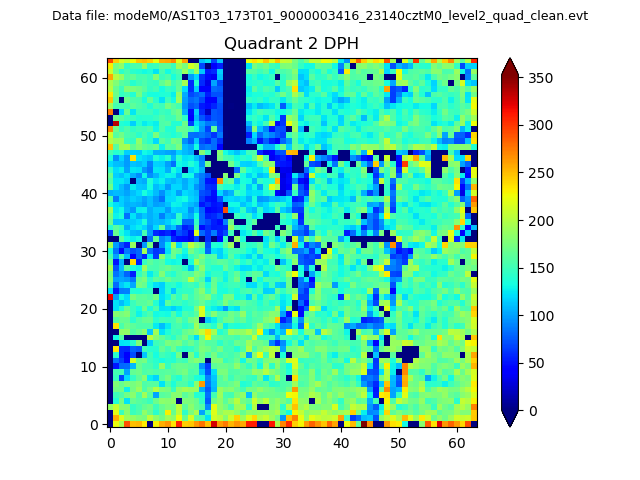 |
Quadrant C |
| Plot type | Count rate plots | Images |
|---|---|---|
| Comparison with Poisson distribution Blue bars denote a histogram of data divided into 1 sec bins. Red curve is a Poisson curve with rate = median count rate of data. |
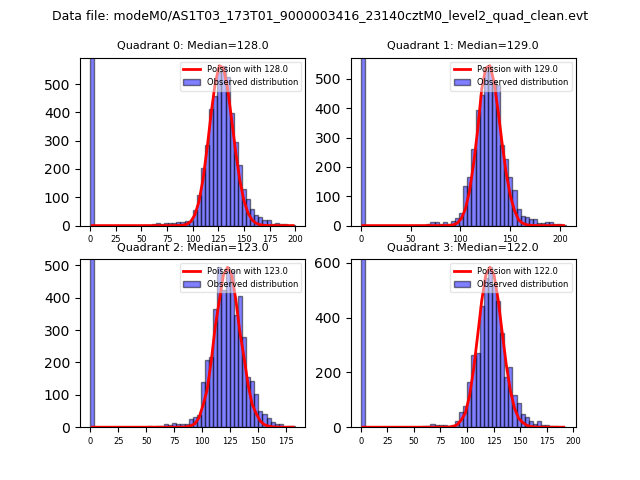 |
 |
| Quadrant-wise count rates Data is divided into 100 sec bins |
 |
|
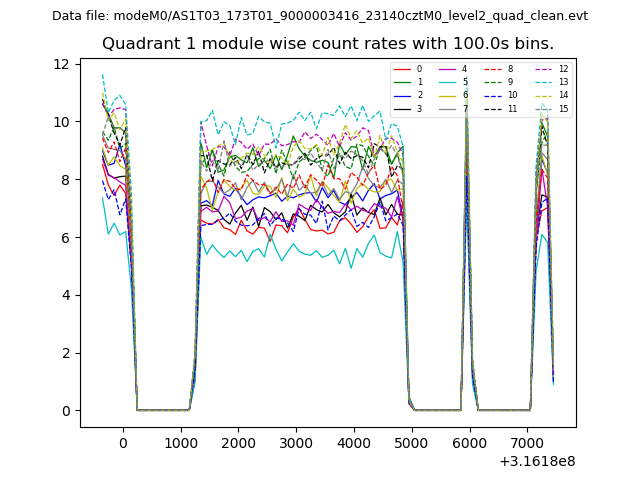
| Module-wise count rates for Quadrant A Data is divided into 100 sec bins |
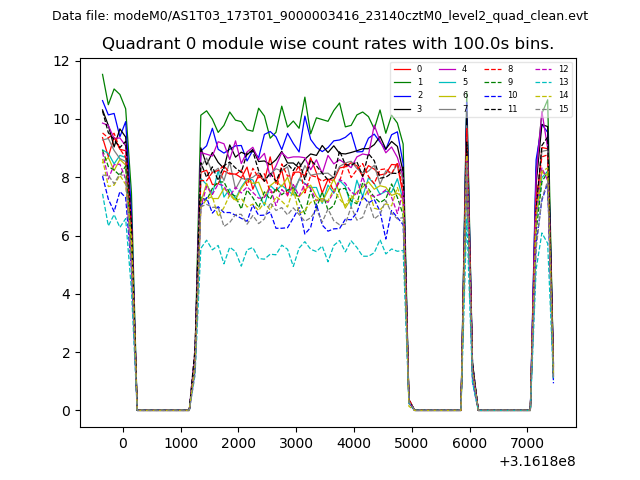 |
 |
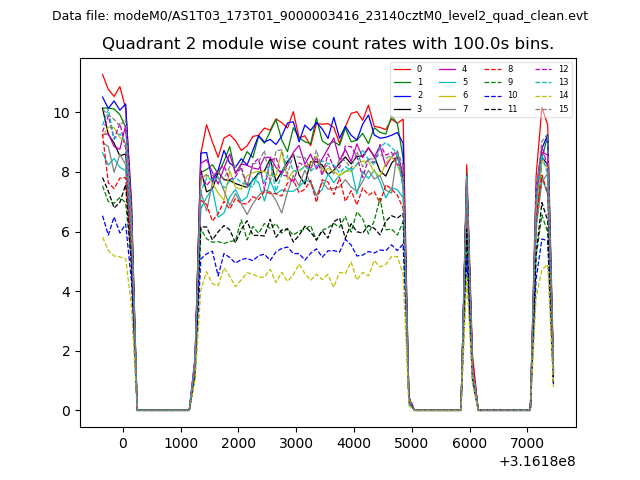
| Module-wise count rates for Quadrant B Data is divided into 100 sec bins |
 |
 |
| Module-wise count rates for Quadrant C Data is divided into 100 sec bins |
 |
 |
| Module-wise count rates for Quadrant D Data is divided into 100 sec bins |
 |
 |
| Parameter | Plot |
|---|---|
| CZT HV Monitor | 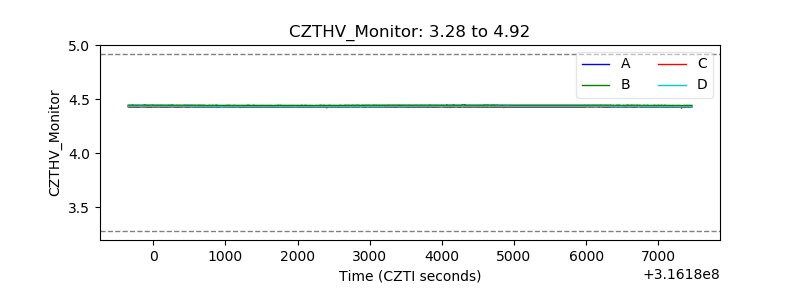 |
| D_VDD | 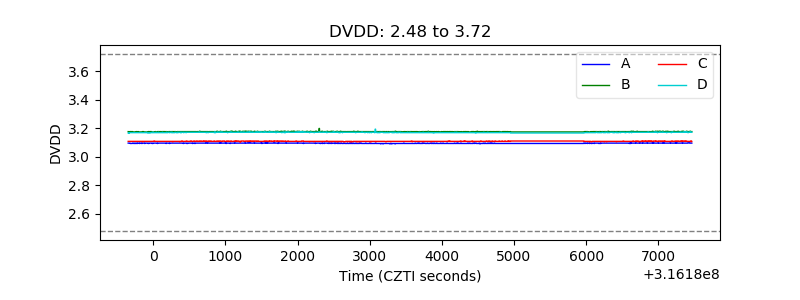 |
| Temperature 1 | 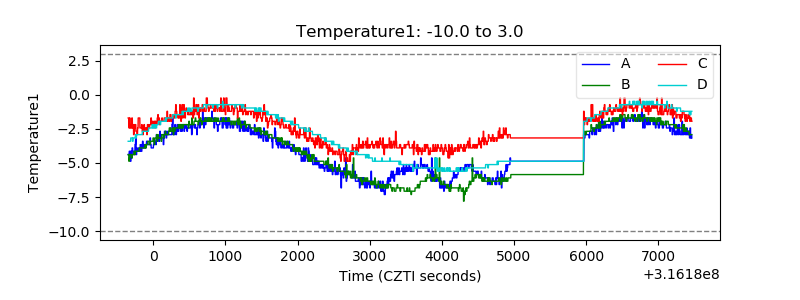 |
| Veto HV Monitor | 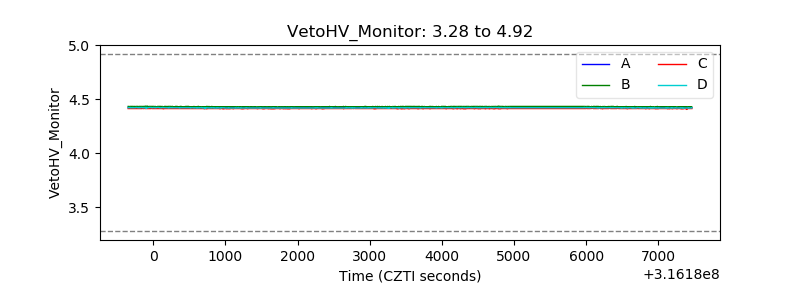 |
| Veto LLD | 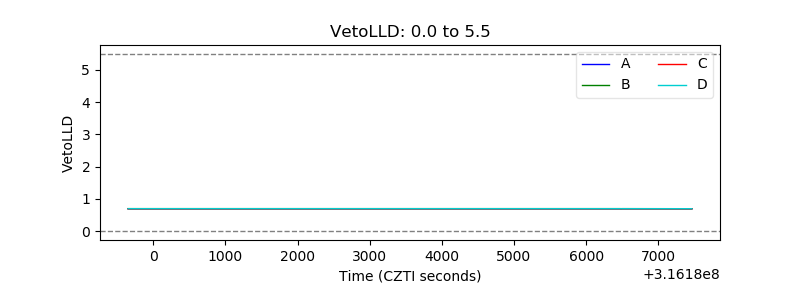 |
| Alpha Counter |  |
| _CPM_Rate | 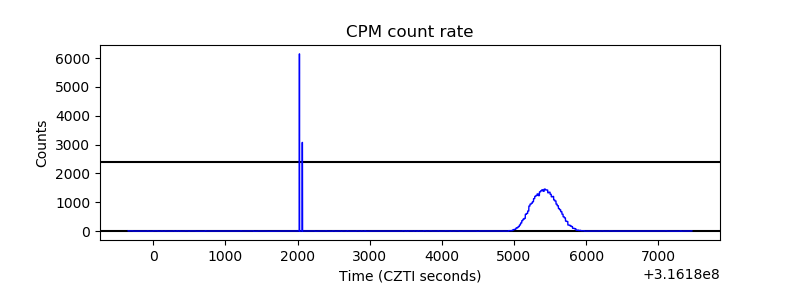 |
| CZT Counter | 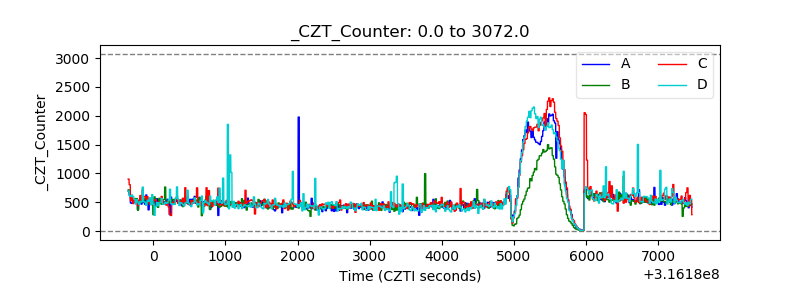 |
| +2.5 Volts monitor |  |
| +5 Volts monitor |  |
| _ROLL_ROT | 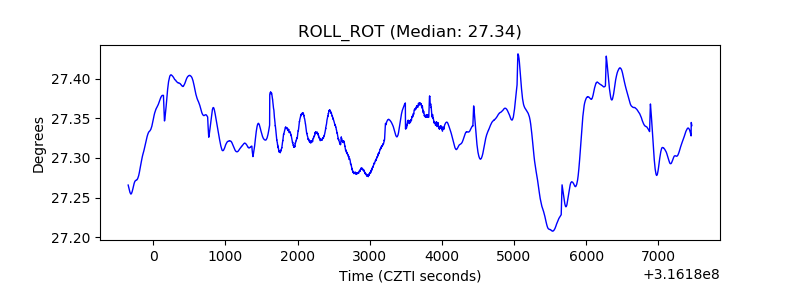 |
| _Roll_DEC |  |
| _Roll_RA | 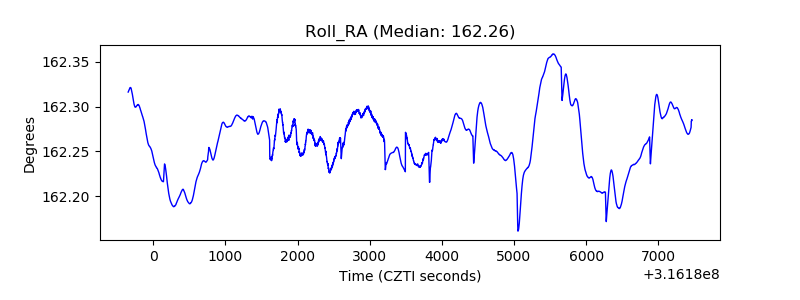 |
| Veto Counter | 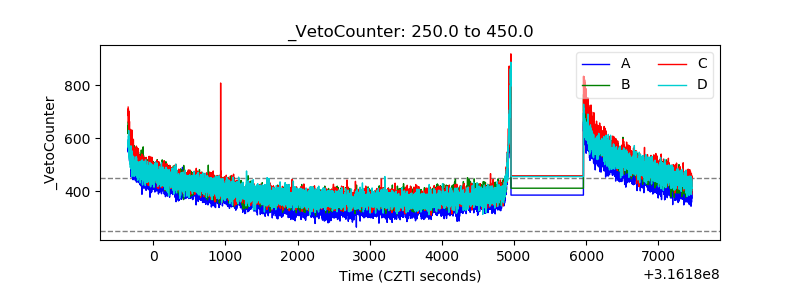 |