| Param | Original file | Final file |
|---|---|---|
| Filename | modeM0/AS1T03_173T01_9000003416_23142cztM0_level2.evt | modeM0/AS1T03_173T01_9000003416_23142cztM0_level2_quad_clean.evt |
| Size (bytes) | 442,774,080 | 91,753,920 |
| Size | 422.3 MB | 87.5 MB |
| Events in quadrant A | 3,046,723 | 596,273 |
| Events in quadrant B | 3,089,286 | 603,906 |
| Events in quadrant C | 3,394,339 | 576,148 |
| Events in quadrant D | 3,456,819 | 568,826 |
| Mode M9 | |||
|---|---|---|---|
| Quadrant | BADHDUFLAG | Total packets | Discarded packets |
| A | 0 | 11 | 0 |
| B | 0 | 11 | 0 |
| C | 0 | 11 | 0 |
| D | 0 | 11 | 0 |
| Mode M0 | |||
|---|---|---|---|
| Quadrant | BADHDUFLAG | Total packets | Discarded packets |
| A | 0 | 13179 | 1 |
| B | 0 | 13289 | 1 |
| C | 0 | 14250 | 1 |
| D | 0 | 14596 | 1 |
| Mode SS | |||
|---|---|---|---|
| Quadrant | BADHDUFLAG | Total packets | Discarded packets |
| A | 0 | 128 | 0 |
| B | 0 | 128 | 0 |
| C | 0 | 128 | 0 |
| D | 0 | 128 | 0 |
| Quadrant | Total seconds | Saturated seconds | Saturation percentage |
|---|---|---|---|
| A | 6204 | 46 | 0.741457% |
| B | 6205 | 57 | 0.918614% |
| C | 6205 | 149 | 2.401289% |
| D | 6205 | 127 | 2.046737% |
Noise dominated data is calculated using 1-second bins in cleaned event files. If a bin has >2000 counts, and if more than 50% of those come from <1% of pixels, then it is considered to be noise-dominated and hence unusable.
| Quadrant | # 1 sec bins | Bins with >0 counts | Bins with >2000 counts | High rate bins dominated by noise | Noise dominated (total time) | Noise dominated (detector-on time) | Marked lightcurve |
|---|---|---|---|---|---|---|---|
| A | 7359 | 6204 | 0 | 0 | 0.00% | 0.00% | 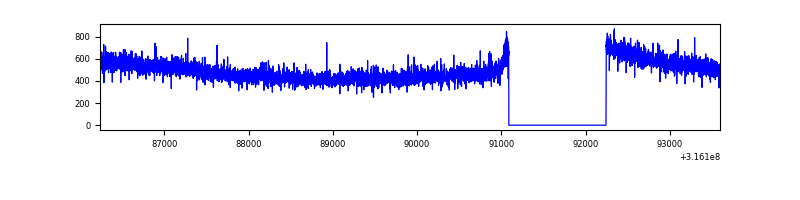 |
| B | 7360 | 6205 | 0 | 0 | 0.00% | 0.00% | 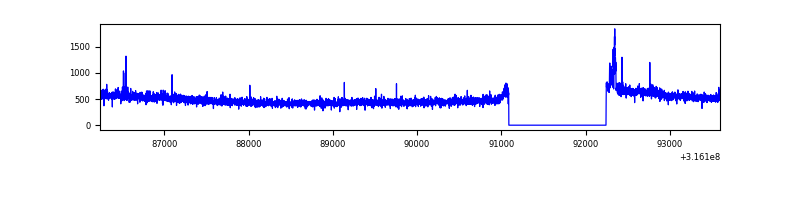 |
| C | 7360 | 6205 | 28 | 28 | 0.38% | 0.45% | 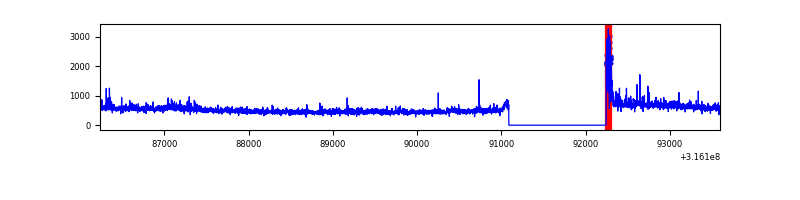 |
| D | 7360 | 6205 | 69 | 69 | 0.94% | 1.11% | 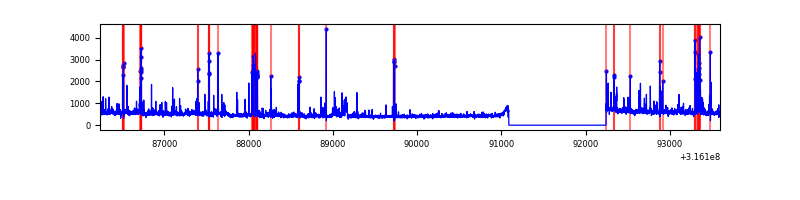 |
Top three noisy pixels from each quadrant. If the there are fewer than three noisy pixels in the level2.evt file, extra rows are filled as -1
| Pixel properties | Quadrant properties | ||||||
|---|---|---|---|---|---|---|---|
| Quadrant | DetID | PixID | Counts | Sigma | Mean | Median | Sigma |
| A | 6 | 16 | 36801 | 230.96 | 781 | 765 | 156.0 |
| A | 13 | 254 | 9848 | 58.21 | 781 | 765 | 156.0 |
| A | 0 | 226 | 6829 | 38.87 | 781 | 765 | 156.0 |
| B | 0 | 190 | 45498 | 307.89 | 776 | 757 | 145.3 |
| B | 12 | 111 | 16861 | 110.82 | 776 | 757 | 145.3 |
| B | 11 | 111 | 14834 | 96.87 | 776 | 757 | 145.3 |
| C | 0 | 10 | 168506 | 962.34 | 749 | 755 | 174.3 |
| C | 14 | 238 | 119593 | 681.74 | 749 | 755 | 174.3 |
| C | 8 | 208 | 89528 | 509.26 | 749 | 755 | 174.3 |
| D | 12 | 233 | 238999 | 1319.22 | 759 | 739 | 180.6 |
| D | 1 | 52 | 163742 | 902.53 | 759 | 739 | 180.6 |
| D | 13 | 153 | 46367 | 252.64 | 759 | 739 | 180.6 |
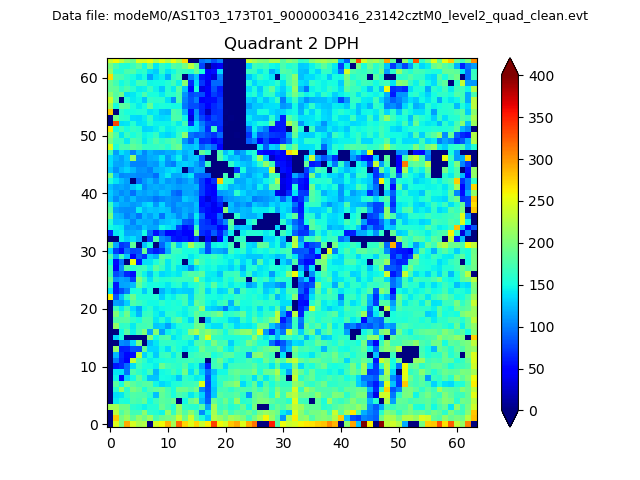
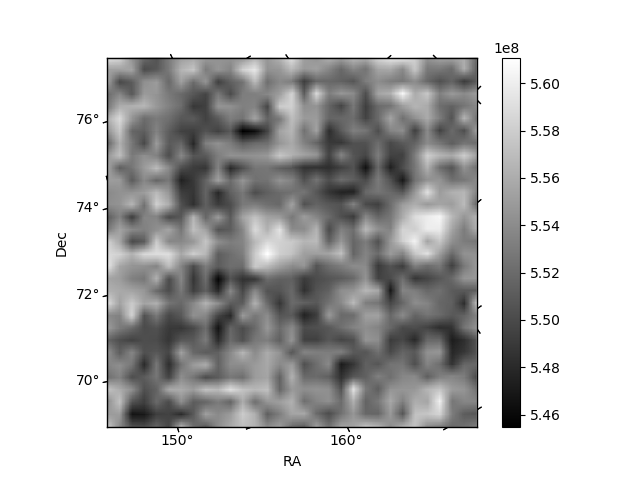
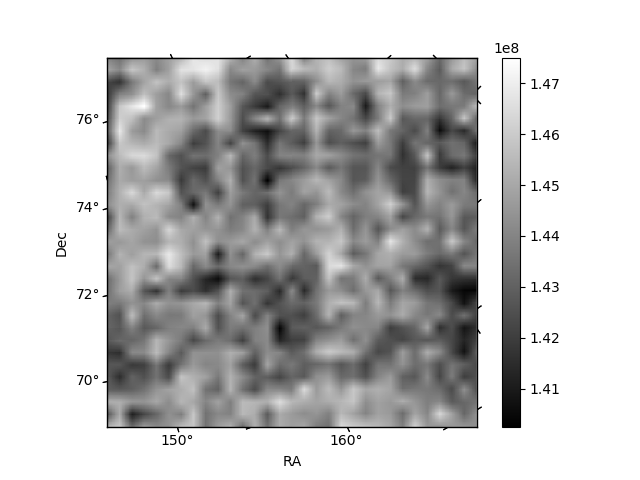
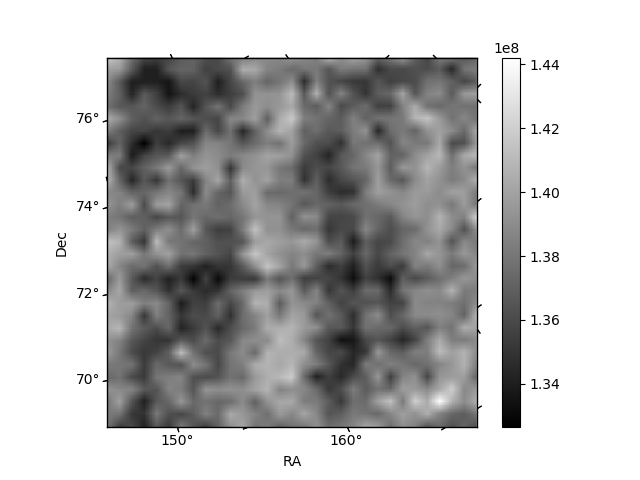
Histogram calculated using DETX and DETY for each event in the final _common_clean file
| Quadrant A | 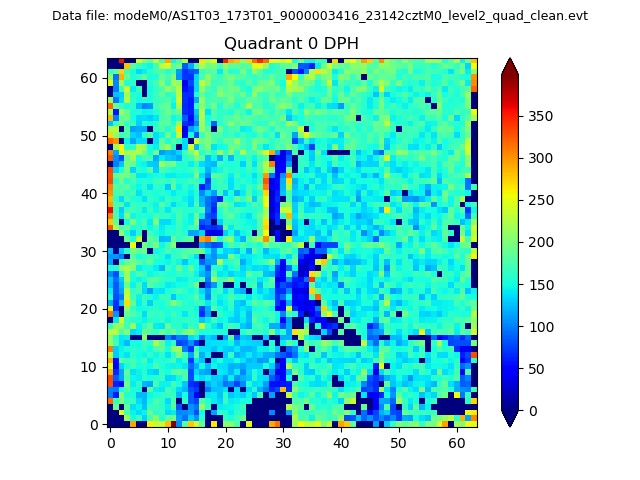 |
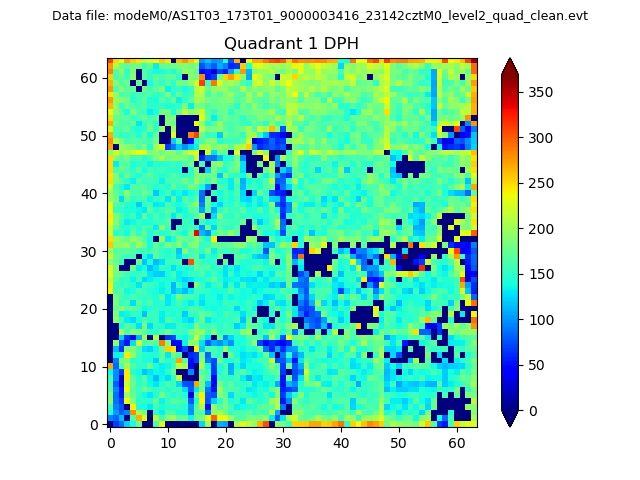 |
Quadrant B |
|---|---|---|---|
| Quadrant D | 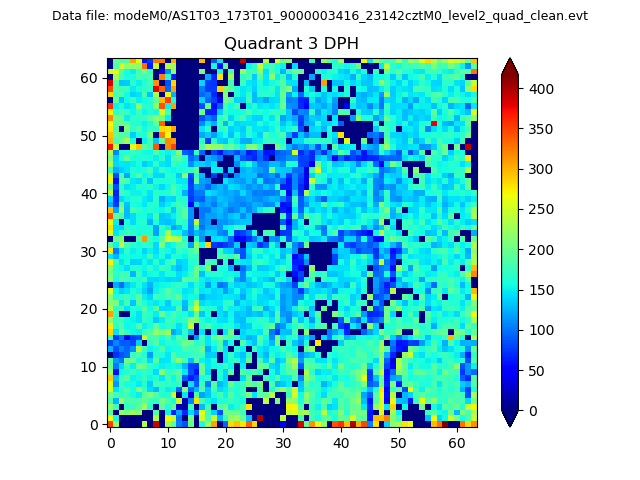 |
 |
Quadrant C |
| Plot type | Count rate plots | Images |
|---|---|---|
| Comparison with Poisson distribution Blue bars denote a histogram of data divided into 1 sec bins. Red curve is a Poisson curve with rate = median count rate of data. |
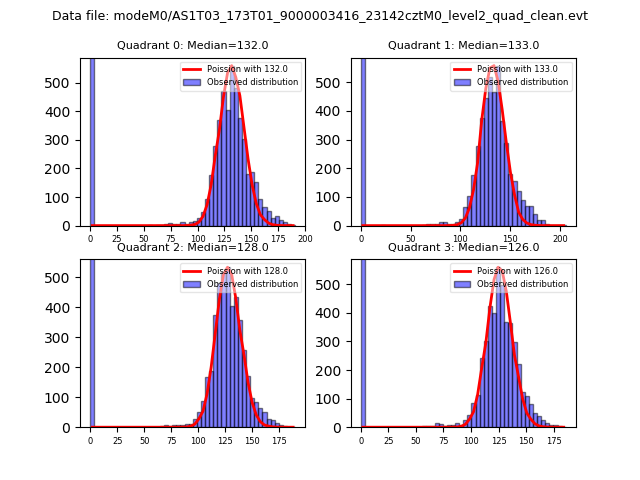 |
 |
| Quadrant-wise count rates Data is divided into 100 sec bins |
 |
|
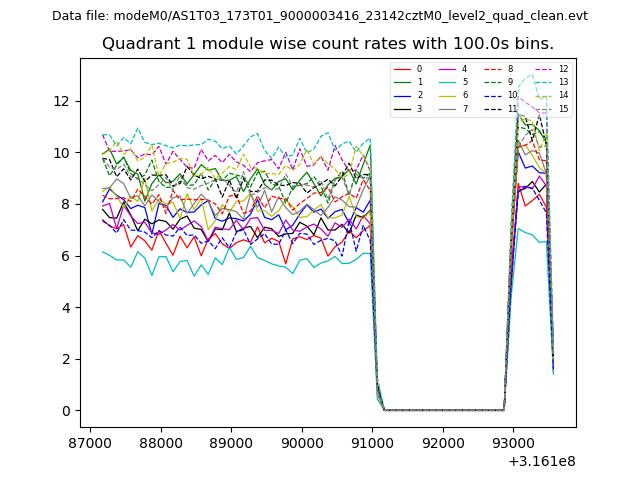
| Module-wise count rates for Quadrant A Data is divided into 100 sec bins |
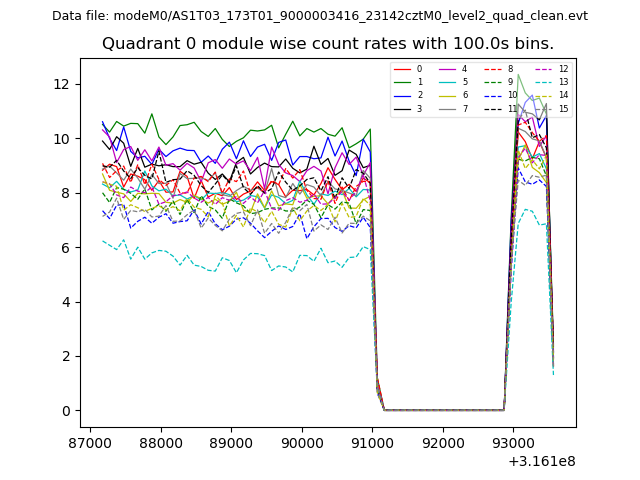 |
 |
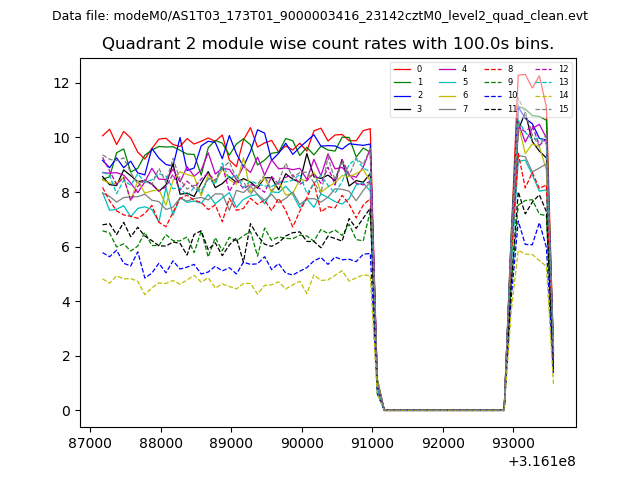
| Module-wise count rates for Quadrant B Data is divided into 100 sec bins |
 |
 |
| Module-wise count rates for Quadrant C Data is divided into 100 sec bins |
 |
 |
| Module-wise count rates for Quadrant D Data is divided into 100 sec bins |
 |
 |
| Parameter | Plot |
|---|---|
| CZT HV Monitor | 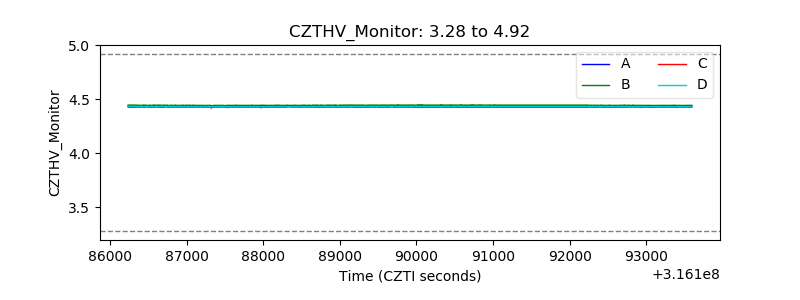 |
| D_VDD | 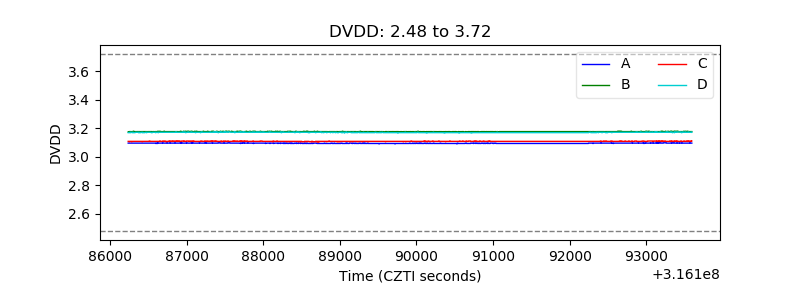 |
| Temperature 1 | 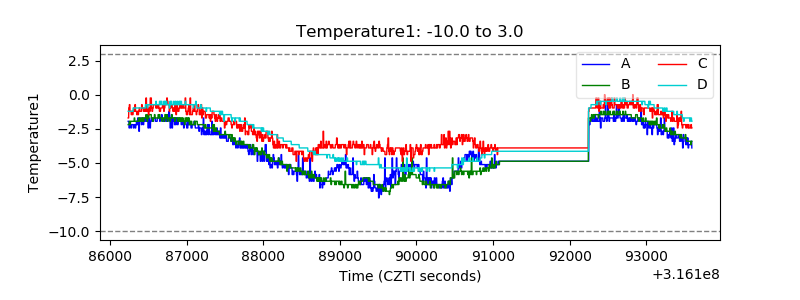 |
| Veto HV Monitor | 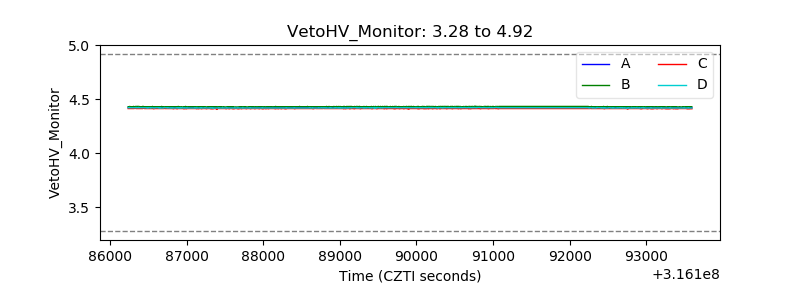 |
| Veto LLD | 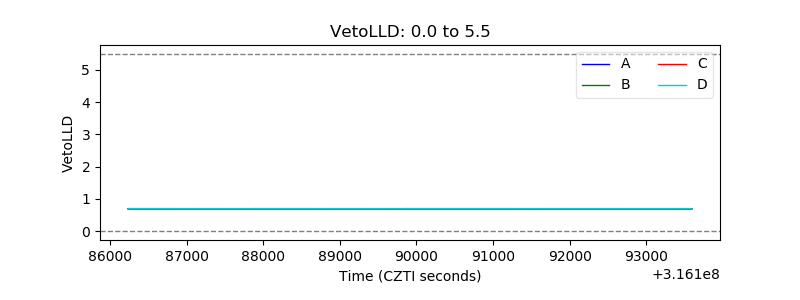 |
| Alpha Counter |  |
| _CPM_Rate | 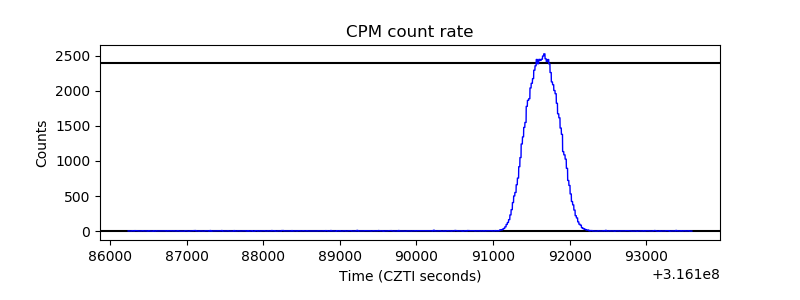 |
| CZT Counter | 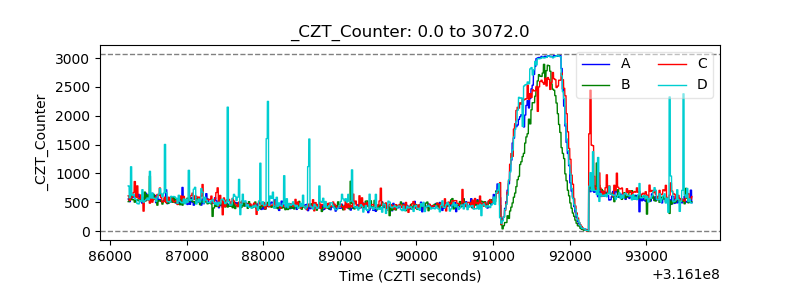 |
| +2.5 Volts monitor |  |
| +5 Volts monitor |  |
| _ROLL_ROT | 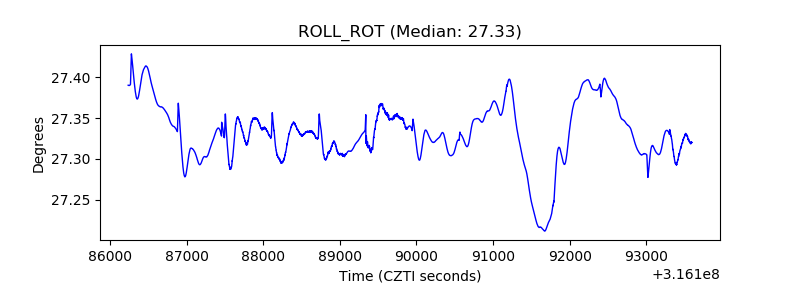 |
| _Roll_DEC | 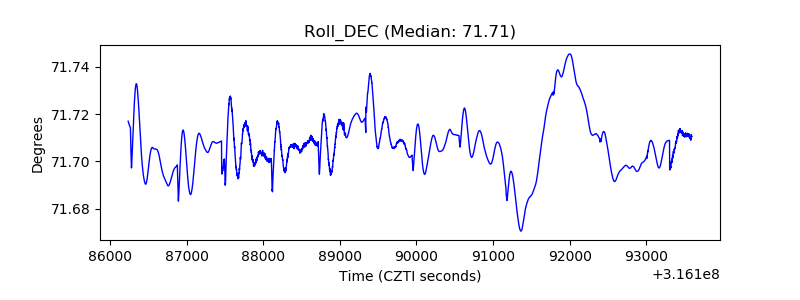 |
| _Roll_RA | 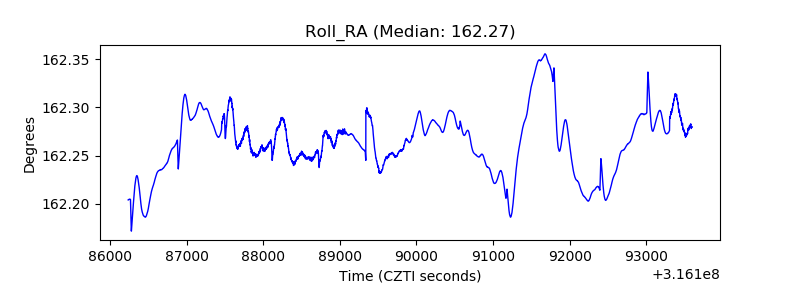 |
| Veto Counter | 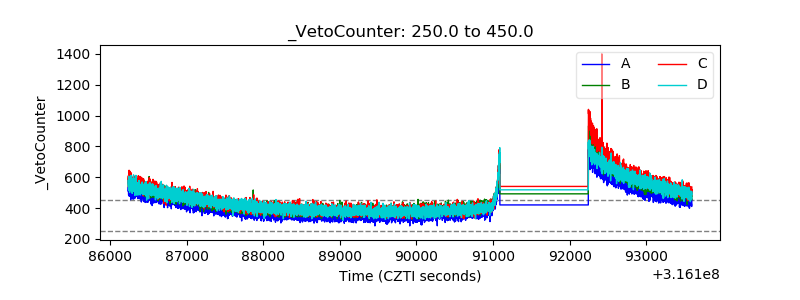 |