| Param | Original file | Final file |
|---|---|---|
| Filename | modeM0/AS1T03_173T01_9000003416_23143cztM0_level2.evt | modeM0/AS1T03_173T01_9000003416_23143cztM0_level2_quad_clean.evt |
| Size (bytes) | 474,678,720 | 108,671,040 |
| Size | 452.7 MB | 103.6 MB |
| Events in quadrant A | 3,150,491 | 721,317 |
| Events in quadrant B | 3,241,793 | 739,598 |
| Events in quadrant C | 3,814,089 | 707,237 |
| Events in quadrant D | 3,749,755 | 691,763 |
| Mode M9 | |||
|---|---|---|---|
| Quadrant | BADHDUFLAG | Total packets | Discarded packets |
| A | 0 | 14 | 0 |
| B | 0 | 15 | 0 |
| C | 0 | 15 | 0 |
| D | 0 | 15 | 0 |
| Mode M0 | |||
|---|---|---|---|
| Quadrant | BADHDUFLAG | Total packets | Discarded packets |
| A | 0 | 13687 | 3 |
| B | 0 | 13850 | 2 |
| C | 0 | 15655 | 2 |
| D | 0 | 15567 | 2 |
| Mode SS | |||
|---|---|---|---|
| Quadrant | BADHDUFLAG | Total packets | Discarded packets |
| A | 0 | 124 | 0 |
| B | 0 | 124 | 0 |
| C | 0 | 124 | 0 |
| D | 0 | 124 | 0 |
| Quadrant | Total seconds | Saturated seconds | Saturation percentage |
|---|---|---|---|
| A | 6186 | 69 | 1.115422% |
| B | 6186 | 84 | 1.357905% |
| C | 6186 | 262 | 4.235370% |
| D | 6186 | 167 | 2.699644% |
Noise dominated data is calculated using 1-second bins in cleaned event files. If a bin has >2000 counts, and if more than 50% of those come from <1% of pixels, then it is considered to be noise-dominated and hence unusable.
| Quadrant | # 1 sec bins | Bins with >0 counts | Bins with >2000 counts | High rate bins dominated by noise | Noise dominated (total time) | Noise dominated (detector-on time) | Marked lightcurve |
|---|---|---|---|---|---|---|---|
| A | 7436 | 6186 | 0 | 0 | 0.00% | 0.00% | 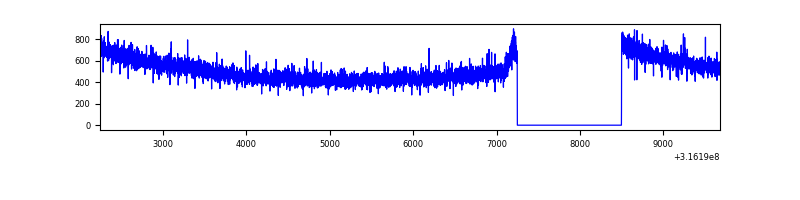 |
| B | 7436 | 6186 | 0 | 0 | 0.00% | 0.00% | 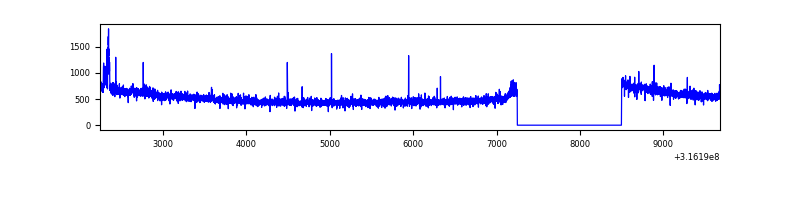 |
| C | 7436 | 6186 | 90 | 90 | 1.21% | 1.45% | 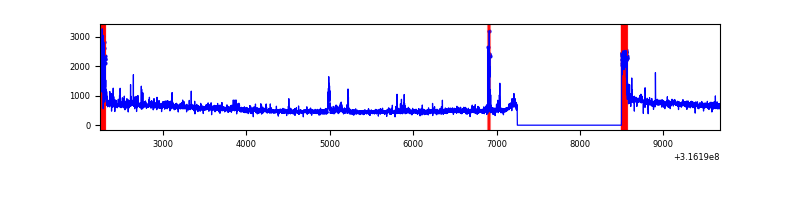 |
| D | 7436 | 6186 | 82 | 82 | 1.10% | 1.33% | 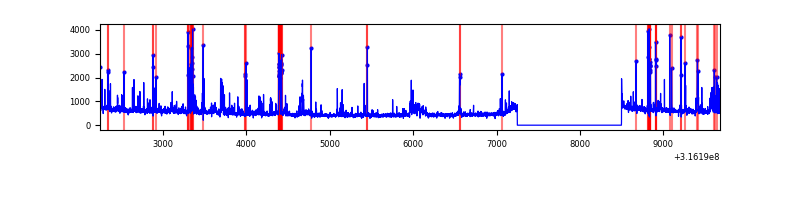 |
Top three noisy pixels from each quadrant. If the there are fewer than three noisy pixels in the level2.evt file, extra rows are filled as -1
| Pixel properties | Quadrant properties | ||||||
|---|---|---|---|---|---|---|---|
| Quadrant | DetID | PixID | Counts | Sigma | Mean | Median | Sigma |
| A | 13 | 254 | 9617 | 54.5 | 815 | 799 | 161.8 |
| A | 6 | 16 | 8007 | 44.55 | 815 | 799 | 161.8 |
| A | 0 | 226 | 7049 | 38.63 | 815 | 799 | 161.8 |
| B | 0 | 190 | 46425 | 304.02 | 815 | 797 | 150.1 |
| B | 12 | 111 | 16833 | 106.85 | 815 | 797 | 150.1 |
| B | 11 | 111 | 14964 | 94.39 | 815 | 797 | 150.1 |
| C | 0 | 10 | 384124 | 2140.59 | 782 | 788 | 179.1 |
| C | 8 | 208 | 152283 | 845.96 | 782 | 788 | 179.1 |
| C | 14 | 238 | 123814 | 686.99 | 782 | 788 | 179.1 |
| D | 12 | 233 | 207739 | 1074.99 | 801 | 780 | 192.5 |
| D | 1 | 52 | 129348 | 667.81 | 801 | 780 | 192.5 |
| D | 10 | 230 | 101546 | 523.4 | 801 | 780 | 192.5 |
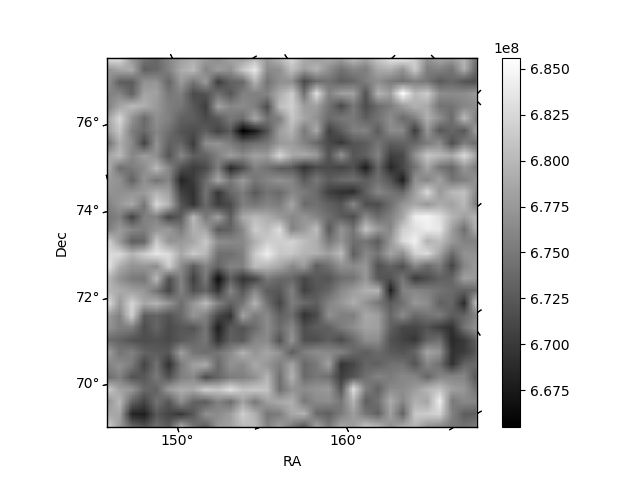
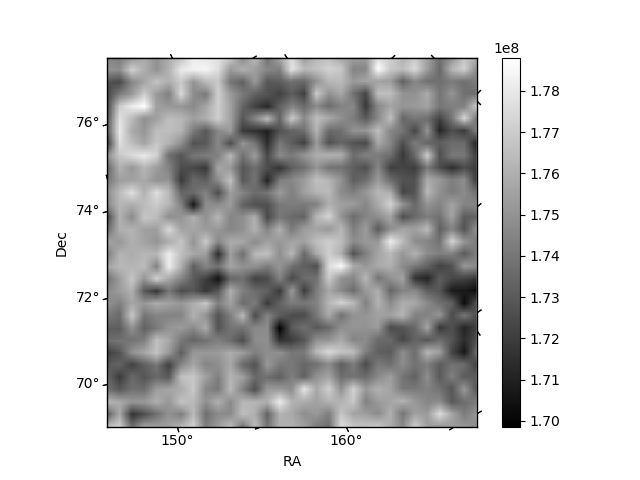
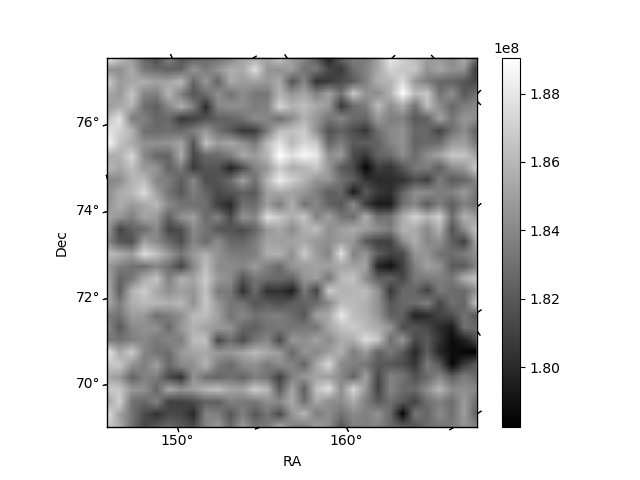
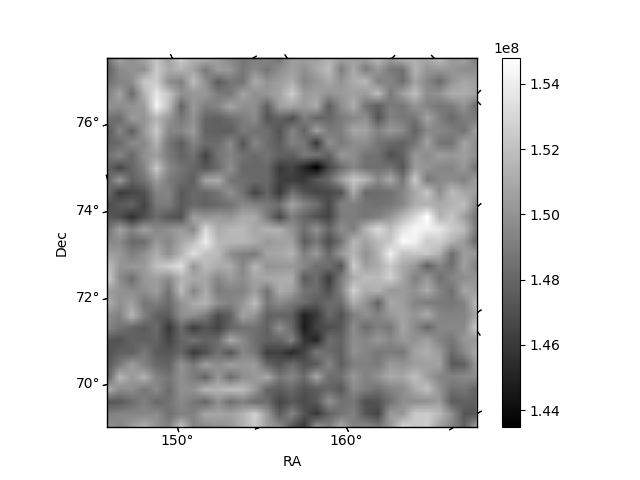
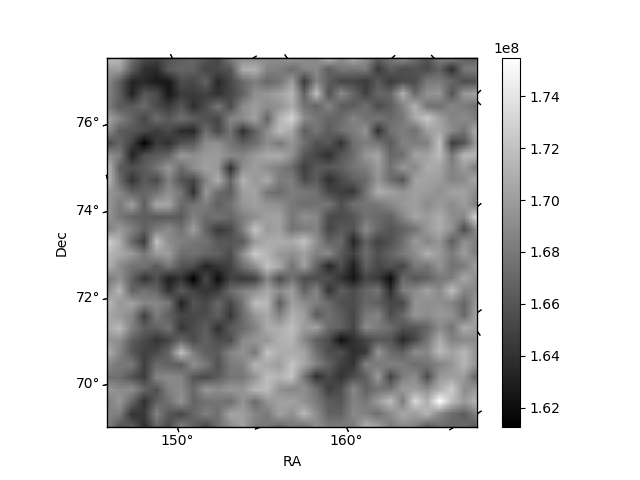
Histogram calculated using DETX and DETY for each event in the final _common_clean file
| Quadrant A | 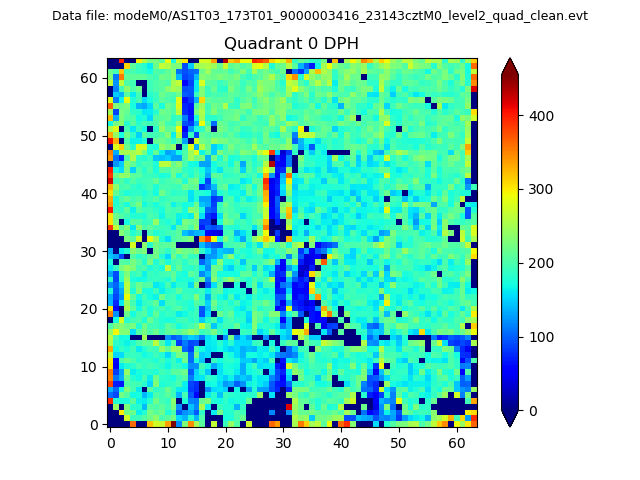 |
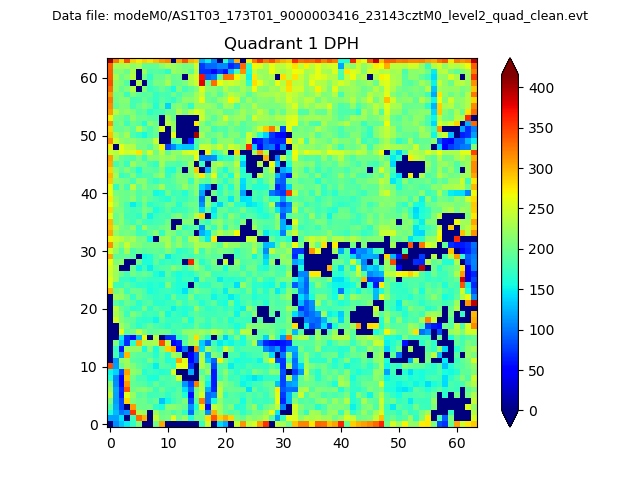 |
Quadrant B |
|---|---|---|---|
| Quadrant D | 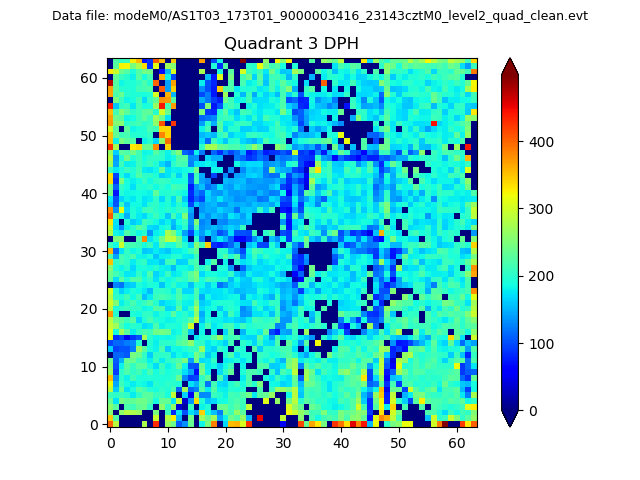 |
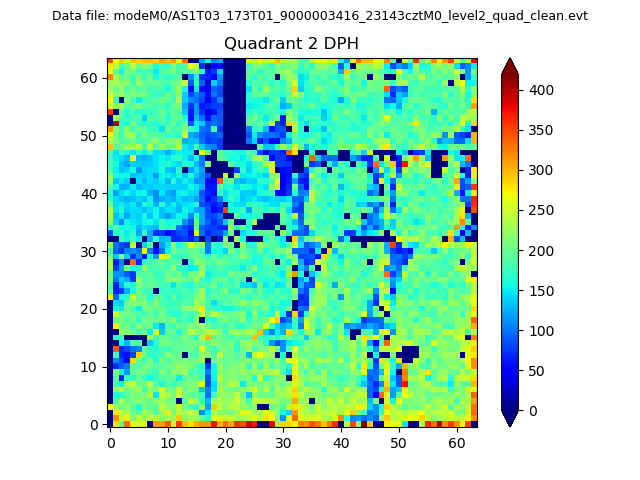 |
Quadrant C |
| Plot type | Count rate plots | Images |
|---|---|---|
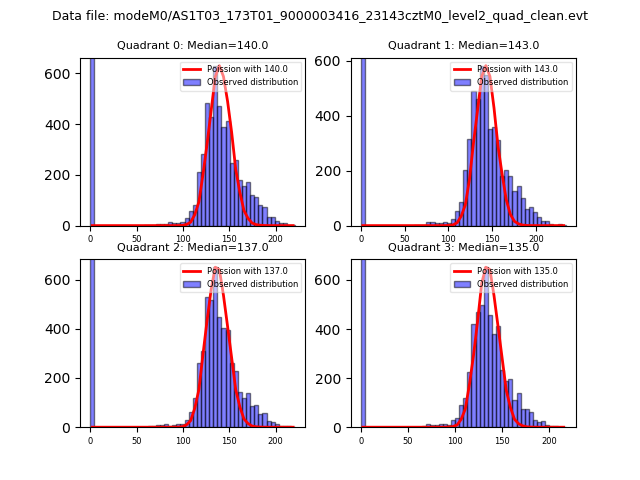
| Comparison with Poisson distribution Blue bars denote a histogram of data divided into 1 sec bins. Red curve is a Poisson curve with rate = median count rate of data. |
 |
 |
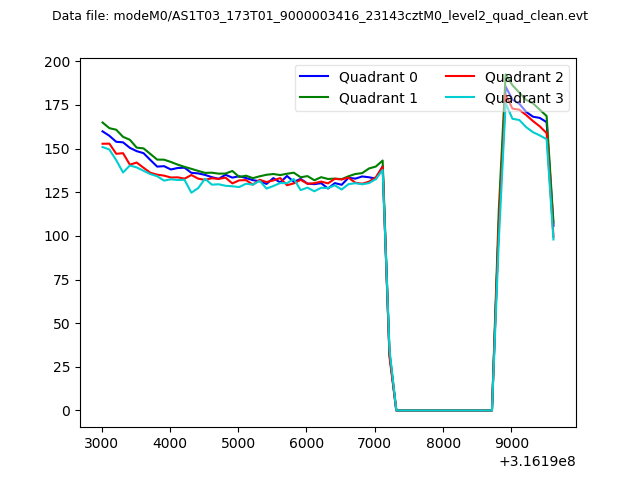
| Quadrant-wise count rates Data is divided into 100 sec bins |
 |
|
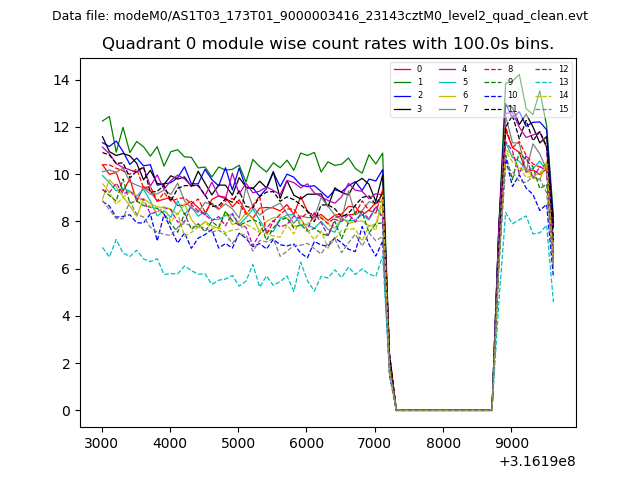
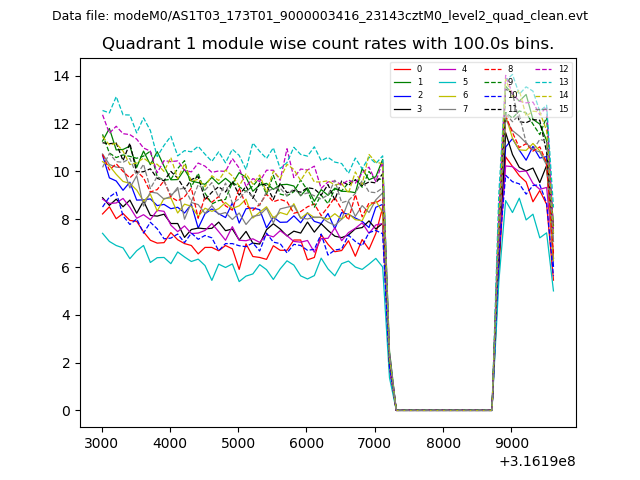
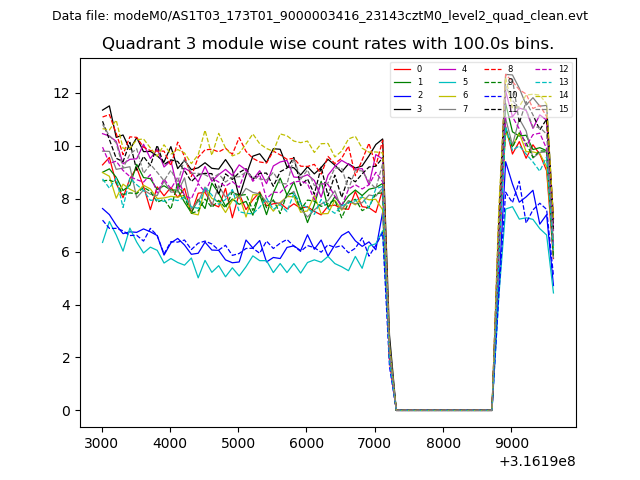
| Module-wise count rates for Quadrant A Data is divided into 100 sec bins |
 |
 |
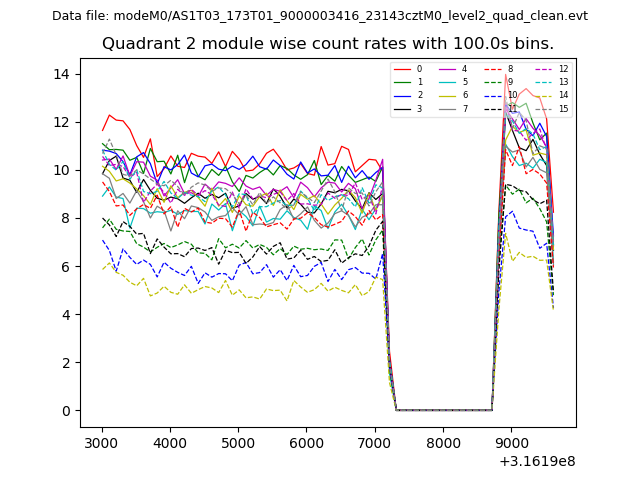
| Module-wise count rates for Quadrant B Data is divided into 100 sec bins |
 |
 |
| Module-wise count rates for Quadrant C Data is divided into 100 sec bins |
 |
 |
| Module-wise count rates for Quadrant D Data is divided into 100 sec bins |
 |
 |
| Parameter | Plot |
|---|---|
| CZT HV Monitor | 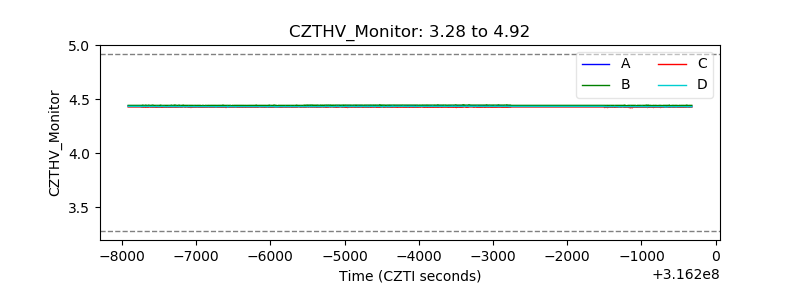 |
| D_VDD | 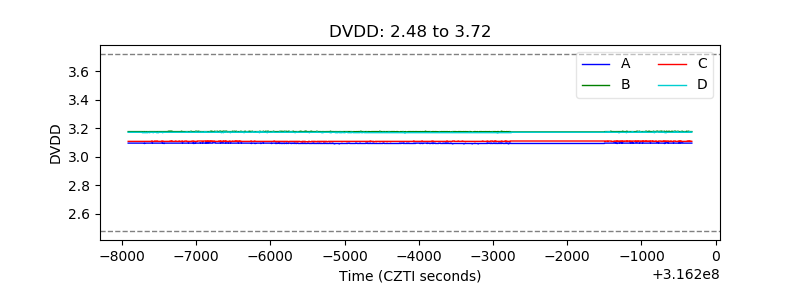 |
| Temperature 1 | 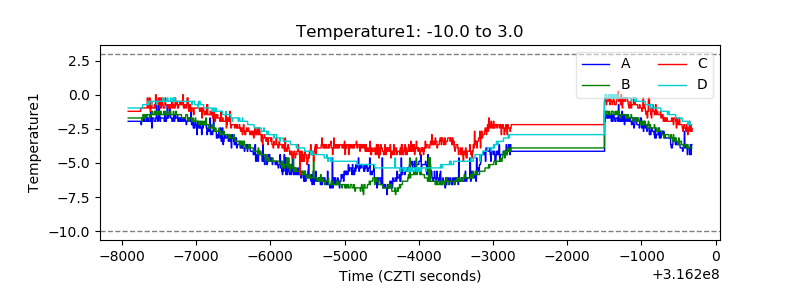 |
| Veto HV Monitor | 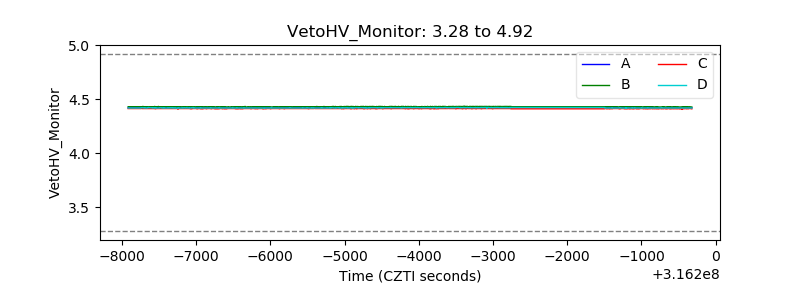 |
| Veto LLD | 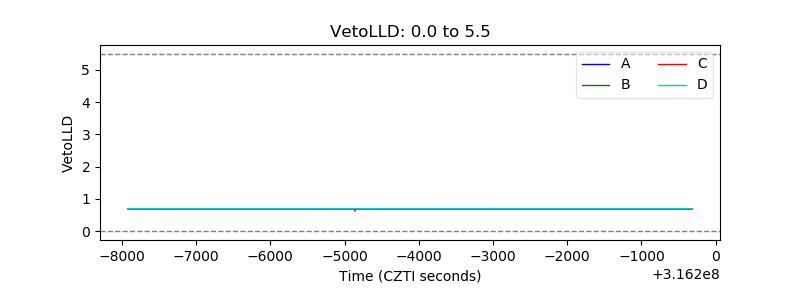 |
| Alpha Counter |  |
| _CPM_Rate |  |
| CZT Counter | 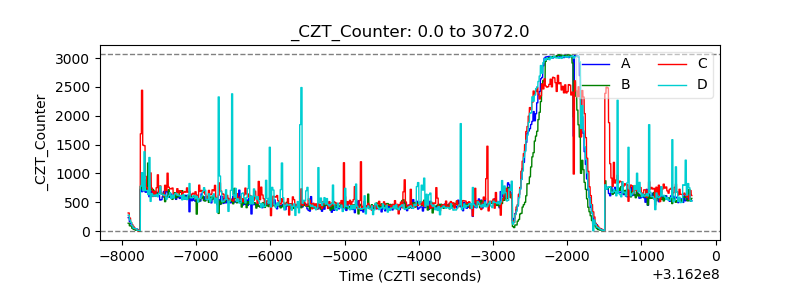 |
| +2.5 Volts monitor |  |
| +5 Volts monitor |  |
| _ROLL_ROT | 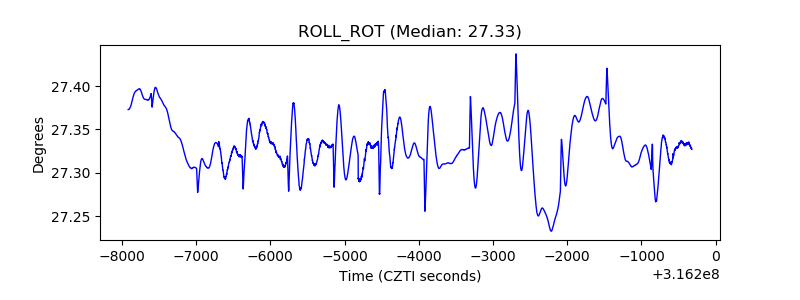 |
| _Roll_DEC | 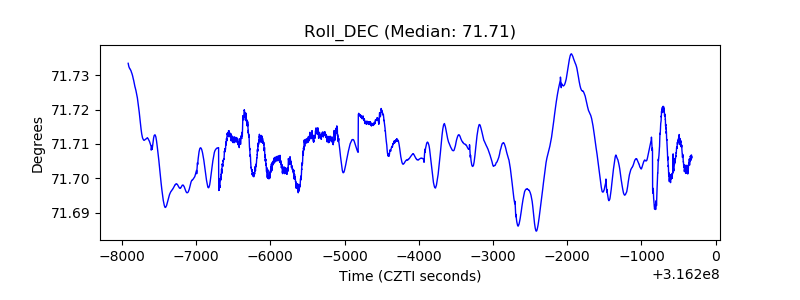 |
| _Roll_RA | 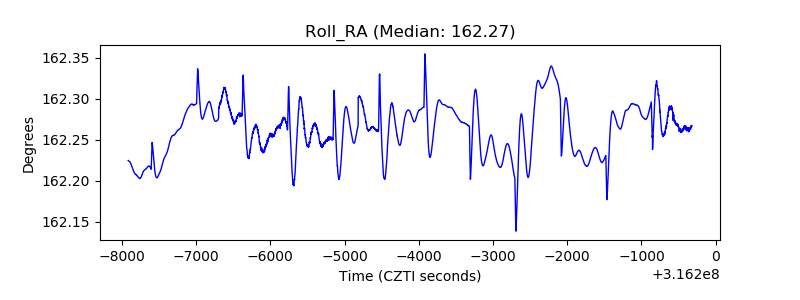 |
| Veto Counter | 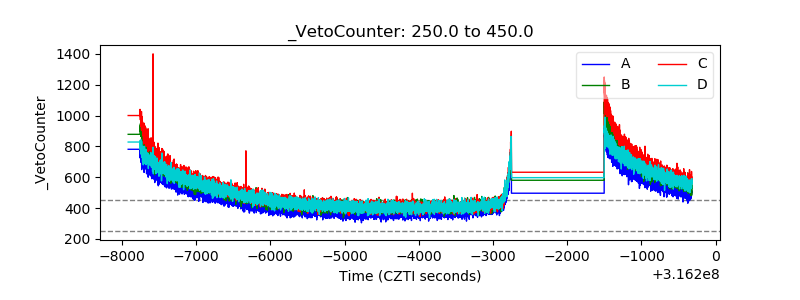 |