| Param | Original file | Final file |
|---|---|---|
| Filename | modeM0/AS1T03_173T01_9000003416_23145cztM0_level2.evt | modeM0/AS1T03_173T01_9000003416_23145cztM0_level2_quad_clean.evt |
| Size (bytes) | 414,550,080 | 117,535,680 |
| Size | 395.3 MB | 112.1 MB |
| Events in quadrant A | 2,732,430 | 801,132 |
| Events in quadrant B | 2,867,170 | 833,024 |
| Events in quadrant C | 3,330,958 | 779,832 |
| Events in quadrant D | 3,259,354 | 770,324 |
| Mode M9 | |||
|---|---|---|---|
| Quadrant | BADHDUFLAG | Total packets | Discarded packets |
| A | 0 | 13 | 0 |
| B | 0 | 14 | 0 |
| C | 0 | 14 | 0 |
| D | 0 | 14 | 0 |
| Mode M0 | |||
|---|---|---|---|
| Quadrant | BADHDUFLAG | Total packets | Discarded packets |
| A | 0 | 11728 | 2 |
| B | 0 | 12066 | 2 |
| C | 0 | 13398 | 2 |
| D | 0 | 13409 | 2 |
| Mode SS | |||
|---|---|---|---|
| Quadrant | BADHDUFLAG | Total packets | Discarded packets |
| A | 0 | 110 | 0 |
| B | 0 | 110 | 0 |
| C | 0 | 110 | 0 |
| D | 0 | 110 | 0 |
| Quadrant | Total seconds | Saturated seconds | Saturation percentage |
|---|---|---|---|
| A | 5362 | 67 | 1.249534% |
| B | 5362 | 90 | 1.678478% |
| C | 5362 | 261 | 4.867587% |
| D | 5362 | 131 | 2.443118% |
Noise dominated data is calculated using 1-second bins in cleaned event files. If a bin has >2000 counts, and if more than 50% of those come from <1% of pixels, then it is considered to be noise-dominated and hence unusable.
| Quadrant | # 1 sec bins | Bins with >0 counts | Bins with >2000 counts | High rate bins dominated by noise | Noise dominated (total time) | Noise dominated (detector-on time) | Marked lightcurve |
|---|---|---|---|---|---|---|---|
| A | 6722 | 5363 | 0 | 0 | 0.00% | 0.00% | 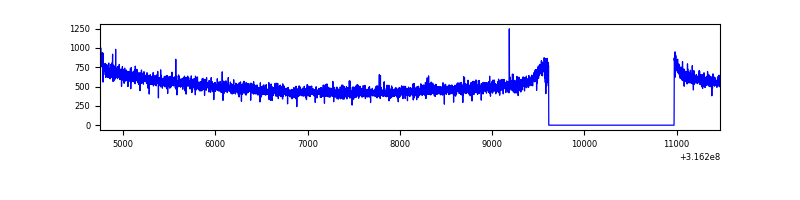 |
| B | 6722 | 5363 | 2 | 2 | 0.03% | 0.04% | 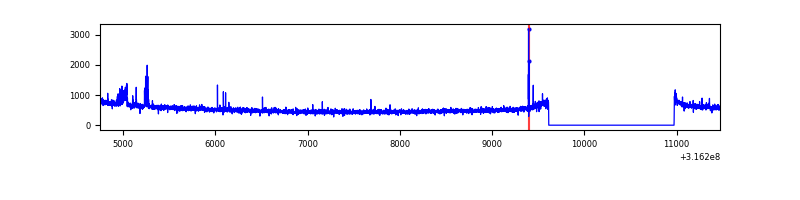 |
| C | 6722 | 5362 | 111 | 111 | 1.65% | 2.07% | 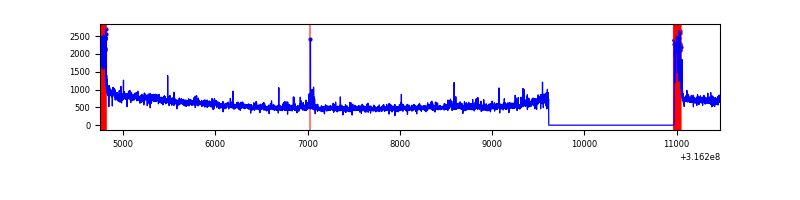 |
| D | 6722 | 5363 | 29 | 29 | 0.43% | 0.54% | 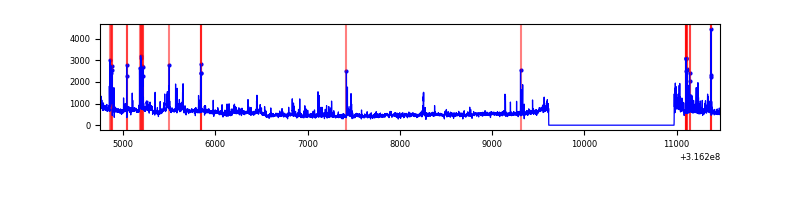 |
Top three noisy pixels from each quadrant. If the there are fewer than three noisy pixels in the level2.evt file, extra rows are filled as -1
| Pixel properties | Quadrant properties | ||||||
|---|---|---|---|---|---|---|---|
| Quadrant | DetID | PixID | Counts | Sigma | Mean | Median | Sigma |
| A | 13 | 254 | 8625 | 56.6 | 707 | 695 | 140.1 |
| A | 6 | 16 | 7526 | 48.76 | 707 | 695 | 140.1 |
| A | 0 | 226 | 6109 | 38.64 | 707 | 695 | 140.1 |
| B | 0 | 190 | 53412 | 403.35 | 716 | 698 | 130.7 |
| B | 12 | 111 | 14626 | 106.57 | 716 | 698 | 130.7 |
| B | 11 | 111 | 12885 | 93.25 | 716 | 698 | 130.7 |
| C | 0 | 10 | 381774 | 2429.78 | 682 | 686 | 156.8 |
| C | 8 | 208 | 150615 | 955.93 | 682 | 686 | 156.8 |
| C | 14 | 238 | 109699 | 695.05 | 682 | 686 | 156.8 |
| D | 1 | 52 | 356688 | 2125.9 | 698 | 680 | 167.5 |
| D | 12 | 233 | 115354 | 684.77 | 698 | 680 | 167.5 |
| D | 13 | 153 | 42298 | 248.52 | 698 | 680 | 167.5 |
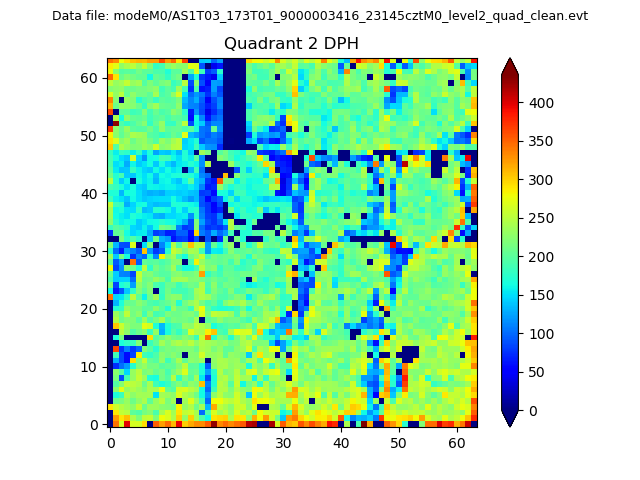
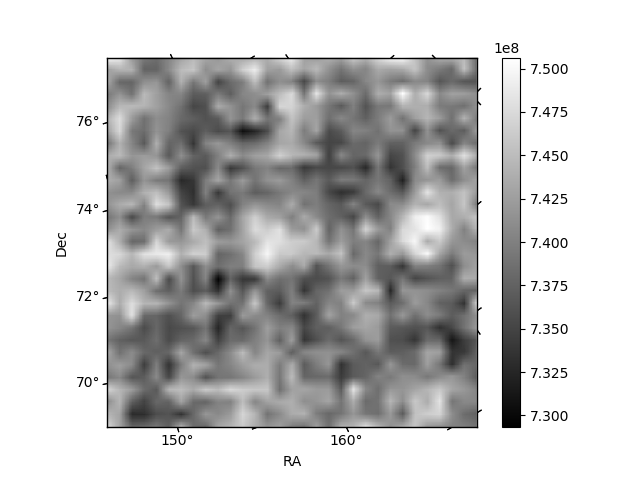
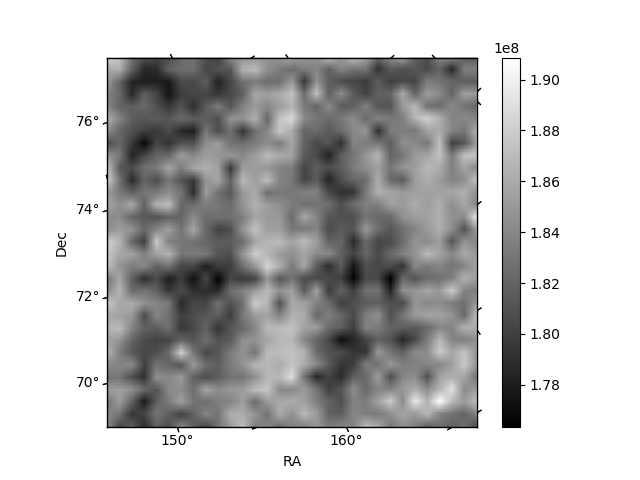
Histogram calculated using DETX and DETY for each event in the final _common_clean file
| Quadrant A | 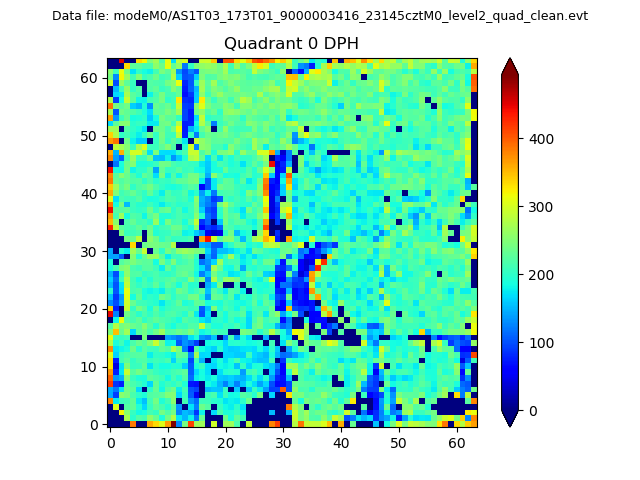 |
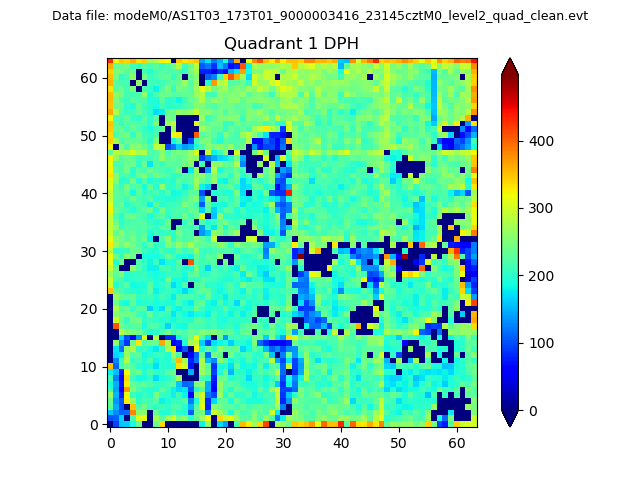 |
Quadrant B |
|---|---|---|---|
| Quadrant D | 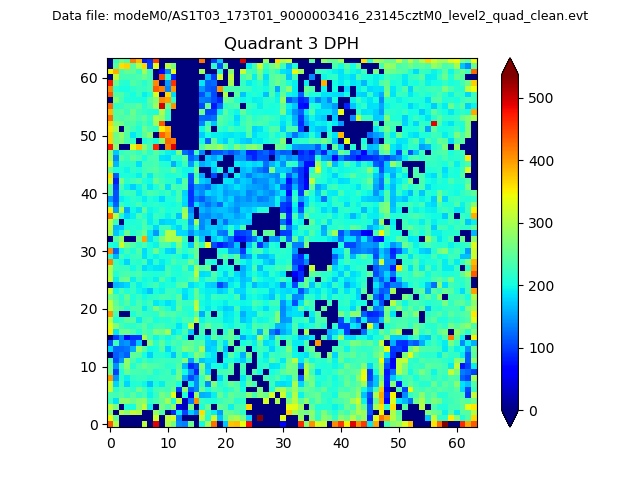 |
 |
Quadrant C |
| Plot type | Count rate plots | Images |
|---|---|---|
| Comparison with Poisson distribution Blue bars denote a histogram of data divided into 1 sec bins. Red curve is a Poisson curve with rate = median count rate of data. |
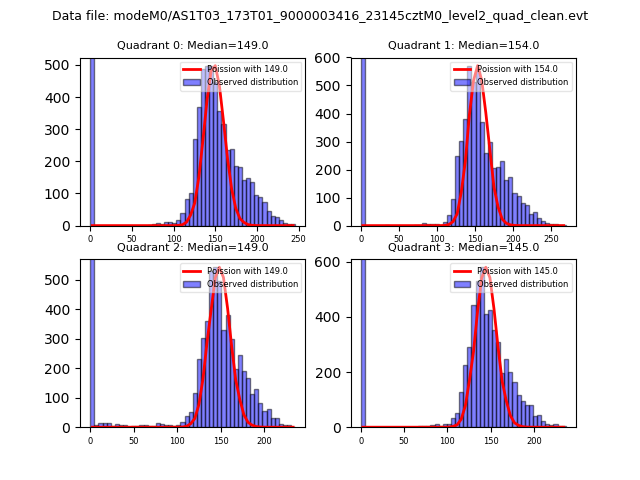 |
 |
| Quadrant-wise count rates Data is divided into 100 sec bins |
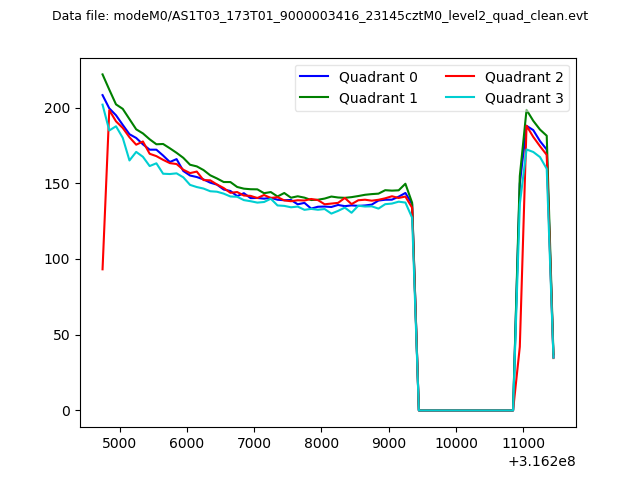 |
|
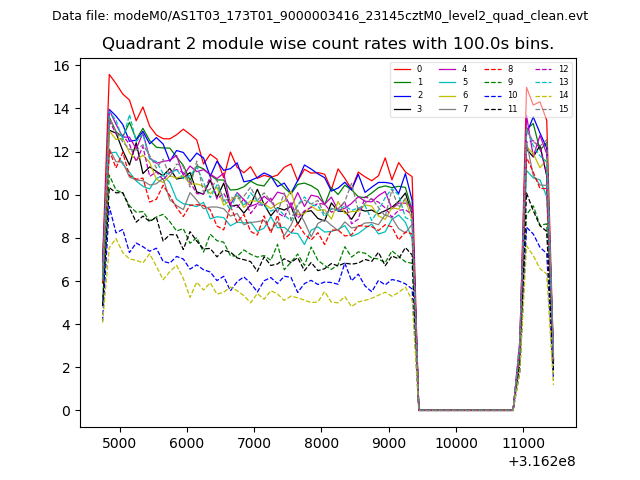
| Module-wise count rates for Quadrant A Data is divided into 100 sec bins |
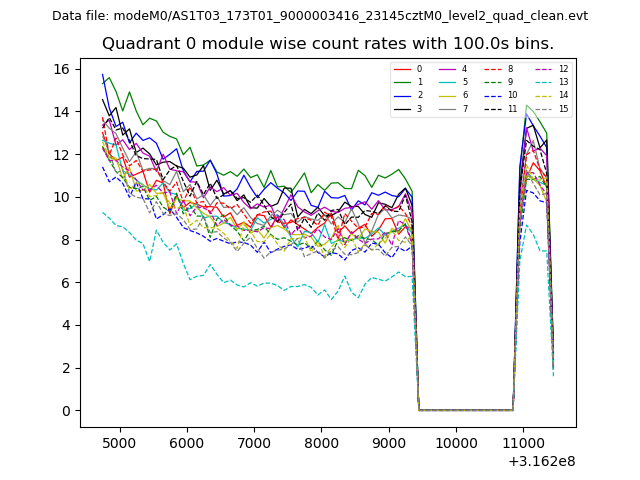 |
 |
| Module-wise count rates for Quadrant B Data is divided into 100 sec bins |
 |
 |
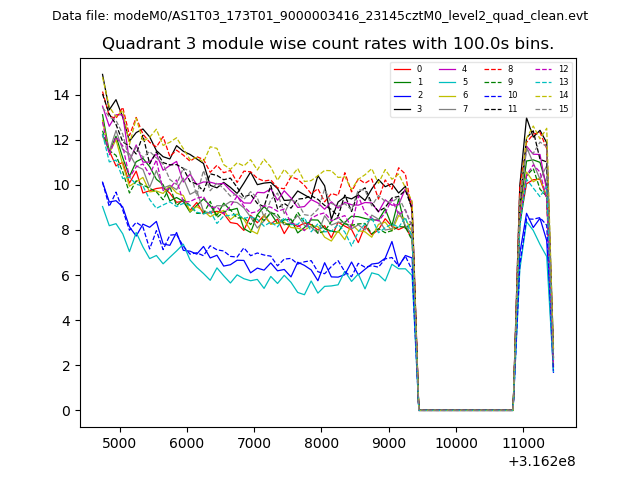
| Module-wise count rates for Quadrant C Data is divided into 100 sec bins |
 |
 |
| Module-wise count rates for Quadrant D Data is divided into 100 sec bins |
 |
 |
| Parameter | Plot |
|---|---|
| CZT HV Monitor | 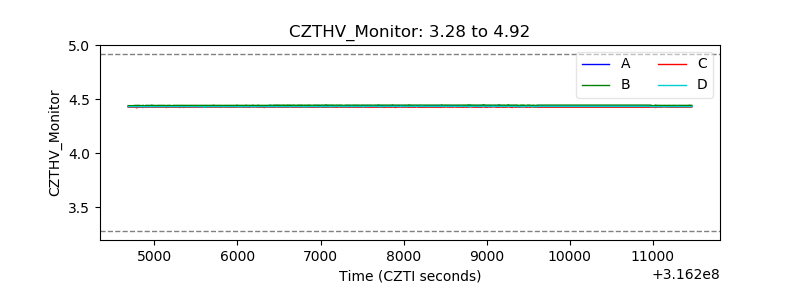 |
| D_VDD | 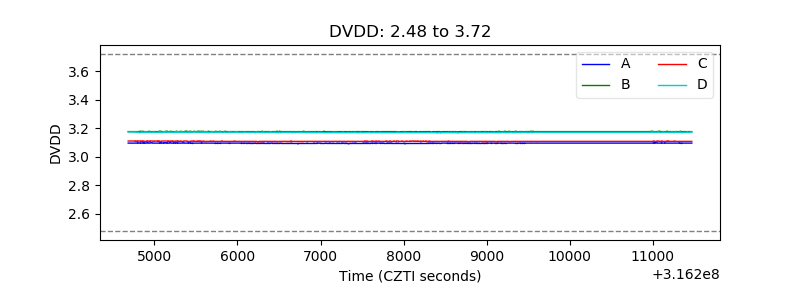 |
| Temperature 1 | 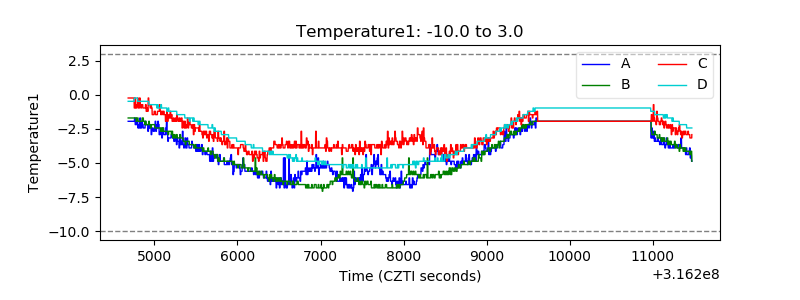 |
| Veto HV Monitor | 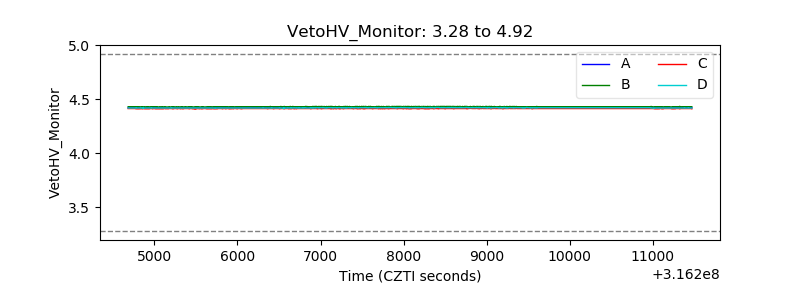 |
| Veto LLD | 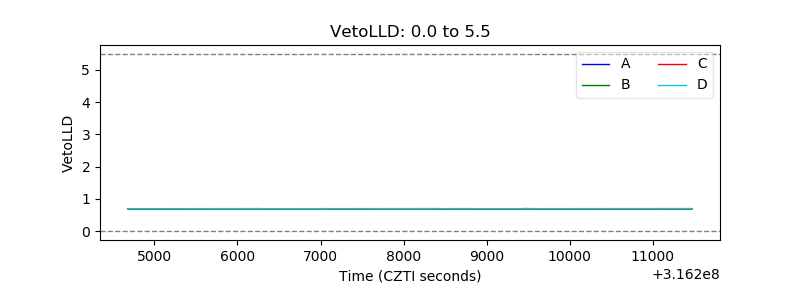 |
| Alpha Counter | 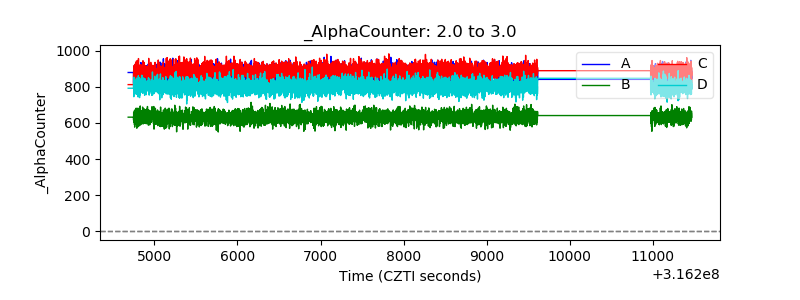 |
| _CPM_Rate |  |
| CZT Counter | 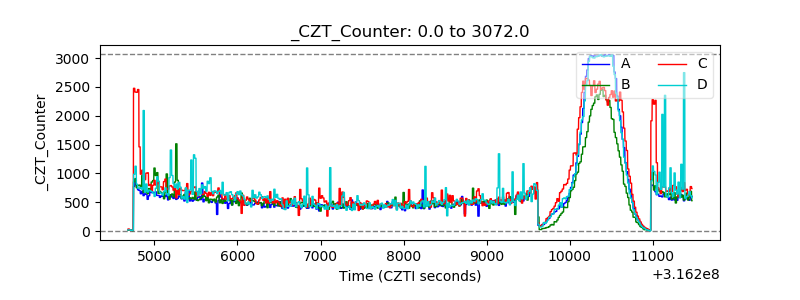 |
| +2.5 Volts monitor |  |
| +5 Volts monitor |  |
| _ROLL_ROT | 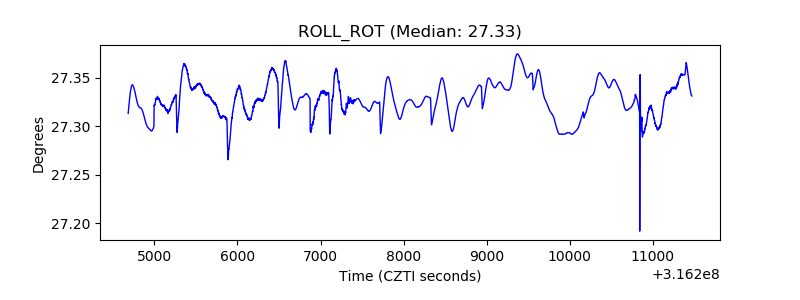 |
| _Roll_DEC | 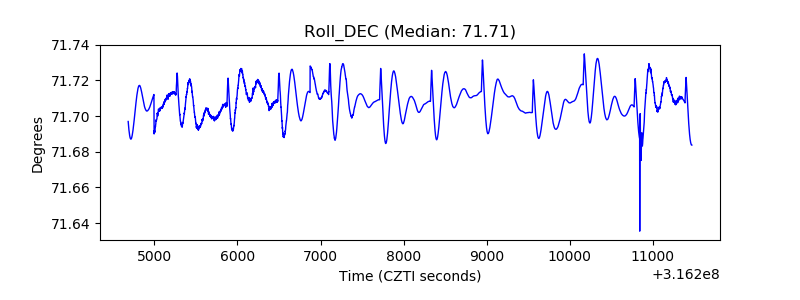 |
| _Roll_RA | 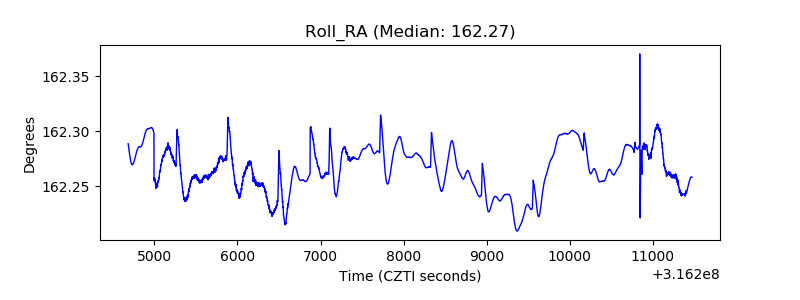 |
| Veto Counter | 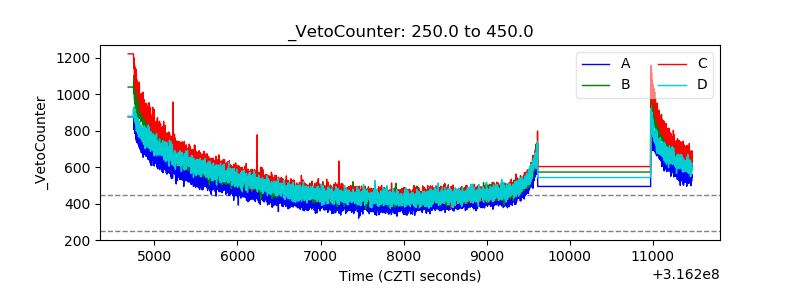 |