| Param | Original file | Final file |
|---|---|---|
| Filename | modeM0/AS1T03_173T01_9000003416_23146cztM0_level2.evt | modeM0/AS1T03_173T01_9000003416_23146cztM0_level2_quad_clean.evt |
| Size (bytes) | 50,621,760 | 12,948,480 |
| Size | 48.3 MB | 12.3 MB |
| Events in quadrant A | 307,385 | 90,718 |
| Events in quadrant B | 322,231 | 94,940 |
| Events in quadrant C | 456,761 | 78,887 |
| Events in quadrant D | 409,555 | 84,469 |
| Mode M9 | |||
|---|---|---|---|
| Quadrant | BADHDUFLAG | Total packets | Discarded packets |
| A | 0 | 6 | 0 |
| B | 0 | 7 | 0 |
| C | 0 | 7 | 0 |
| D | 0 | 7 | 0 |
| Mode M0 | |||
|---|---|---|---|
| Quadrant | BADHDUFLAG | Total packets | Discarded packets |
| A | 0 | 1262 | 1 |
| B | 0 | 1347 | 1 |
| C | 0 | 1772 | 1 |
| D | 0 | 1589 | 1 |
| Mode SS | |||
|---|---|---|---|
| Quadrant | BADHDUFLAG | Total packets | Discarded packets |
| A | 0 | 10 | 0 |
| B | 0 | 10 | 0 |
| C | 0 | 10 | 0 |
| D | 0 | 10 | 0 |
| Quadrant | Total seconds | Saturated seconds | Saturation percentage |
|---|---|---|---|
| A | 497 | 1 | 0.201207% |
| B | 497 | 6 | 1.207243% |
| C | 497 | 76 | 15.291751% |
| D | 497 | 33 | 6.639839% |
Noise dominated data is calculated using 1-second bins in cleaned event files. If a bin has >2000 counts, and if more than 50% of those come from <1% of pixels, then it is considered to be noise-dominated and hence unusable.
| Quadrant | # 1 sec bins | Bins with >0 counts | Bins with >2000 counts | High rate bins dominated by noise | Noise dominated (total time) | Noise dominated (detector-on time) | Marked lightcurve |
|---|---|---|---|---|---|---|---|
| A | 497 | 497 | 0 | 0 | 0.00% | 0.00% | 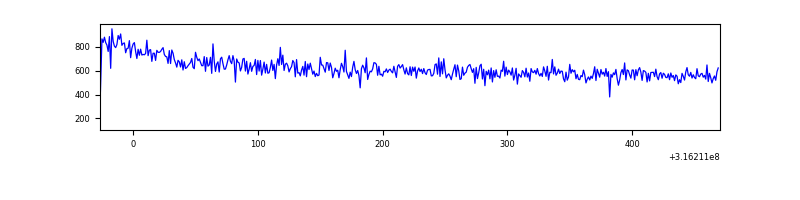 |
| B | 497 | 497 | 0 | 0 | 0.00% | 0.00% | 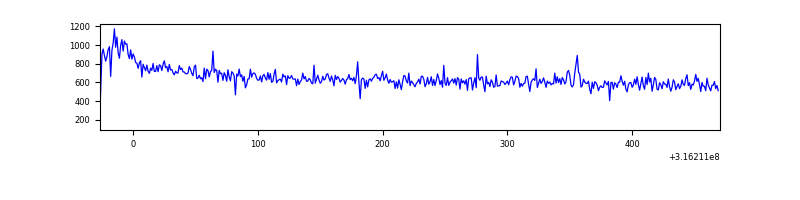 |
| C | 497 | 497 | 54 | 54 | 10.87% | 10.87% | 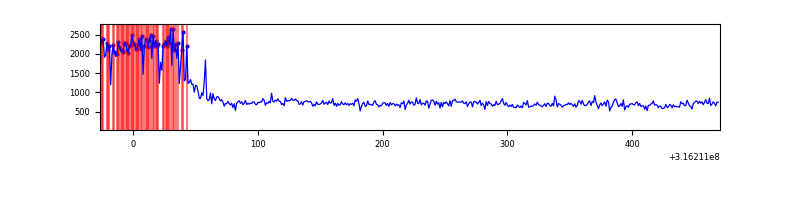 |
| D | 497 | 497 | 11 | 11 | 2.21% | 2.21% | 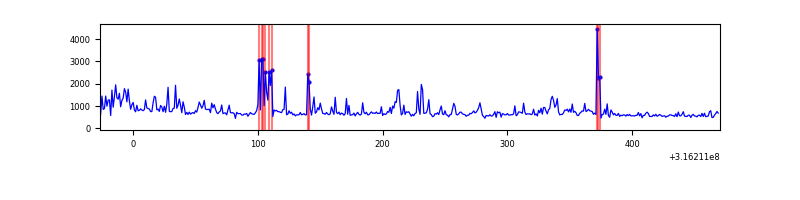 |
Top three noisy pixels from each quadrant. If the there are fewer than three noisy pixels in the level2.evt file, extra rows are filled as -1
| Pixel properties | Quadrant properties | ||||||
|---|---|---|---|---|---|---|---|
| Quadrant | DetID | PixID | Counts | Sigma | Mean | Median | Sigma |
| A | 13 | 254 | 848 | 42.73 | 79 | 77 | 18.0 |
| A | 0 | 226 | 744 | 36.96 | 79 | 77 | 18.0 |
| A | 3 | 137 | 626 | 30.43 | 79 | 77 | 18.0 |
| B | 3 | 209 | 2781 | 154.69 | 81 | 79 | 17.5 |
| B | 0 | 190 | 2248 | 124.18 | 81 | 79 | 17.5 |
| B | 0 | 228 | 2207 | 121.83 | 81 | 79 | 17.5 |
| C | 0 | 10 | 145982 | 7857.48 | 70 | 70 | 18.6 |
| C | 8 | 208 | 22964 | 1232.84 | 70 | 70 | 18.6 |
| C | 14 | 238 | 10798 | 577.69 | 70 | 70 | 18.6 |
| D | 12 | 233 | 69093 | 3340.15 | 78 | 75 | 20.7 |
| D | 1 | 239 | 17820 | 858.77 | 78 | 75 | 20.7 |
| D | 2 | 153 | 9401 | 451.33 | 78 | 75 | 20.7 |
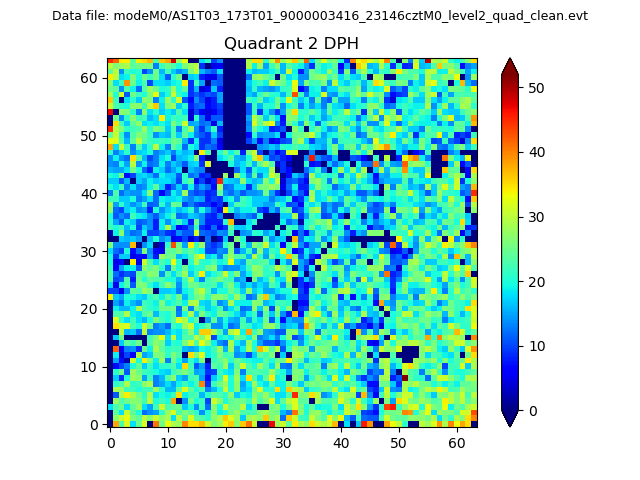
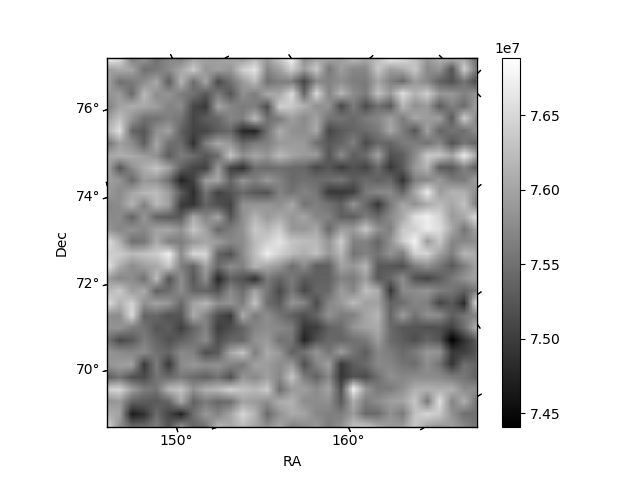
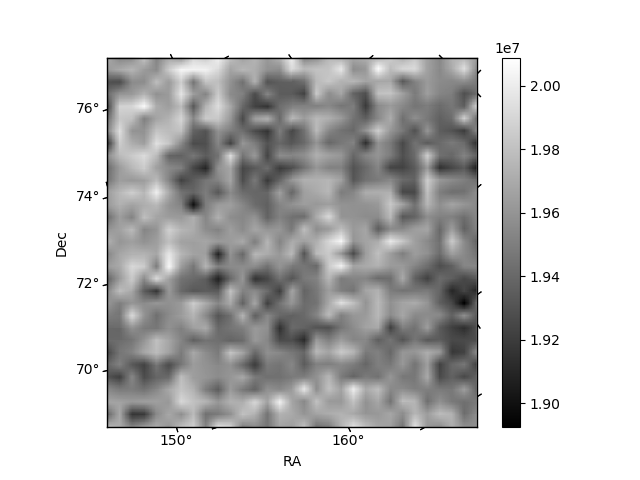
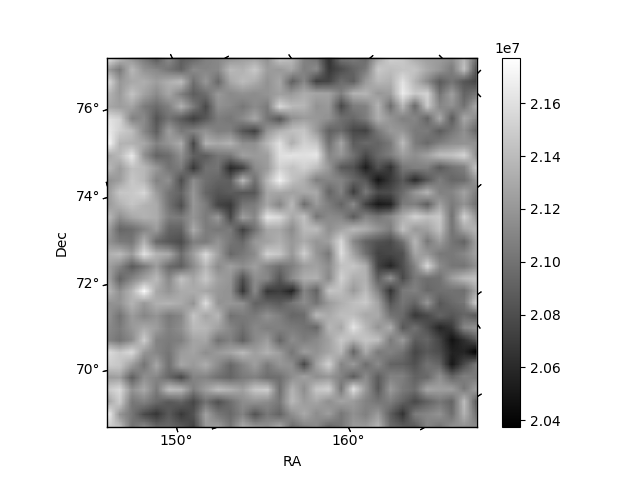
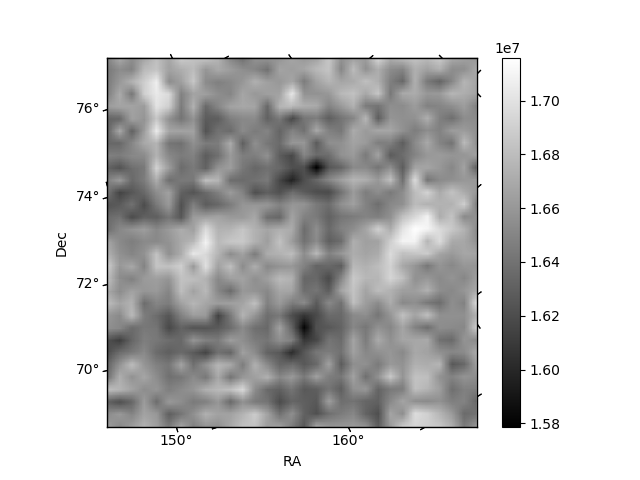
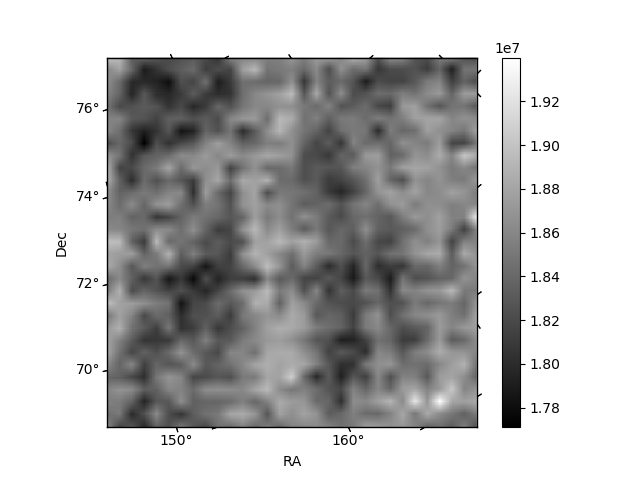
Histogram calculated using DETX and DETY for each event in the final _common_clean file
| Quadrant A | 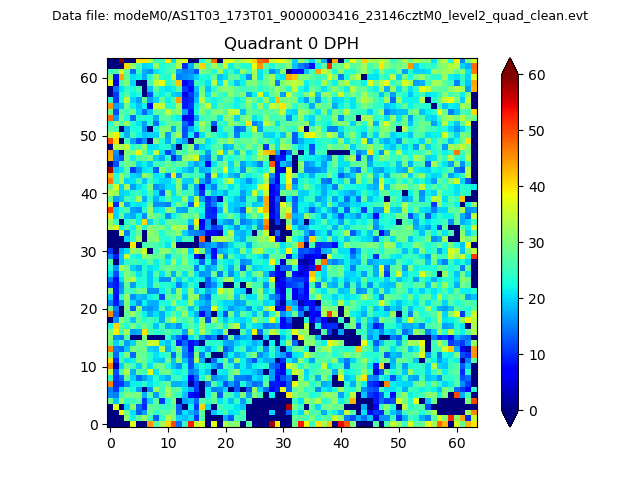 |
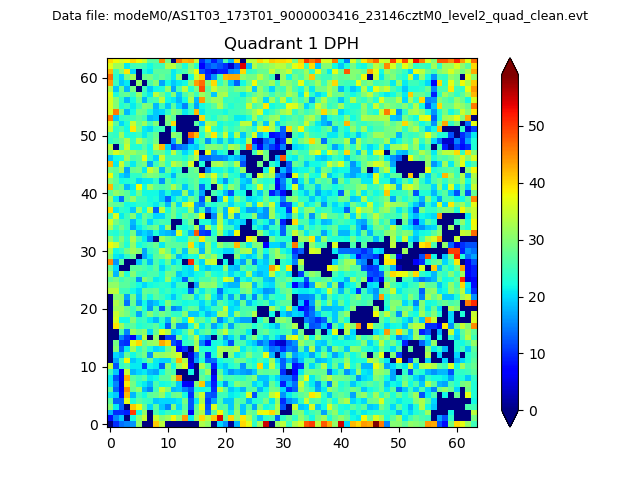 |
Quadrant B |
|---|---|---|---|
| Quadrant D | 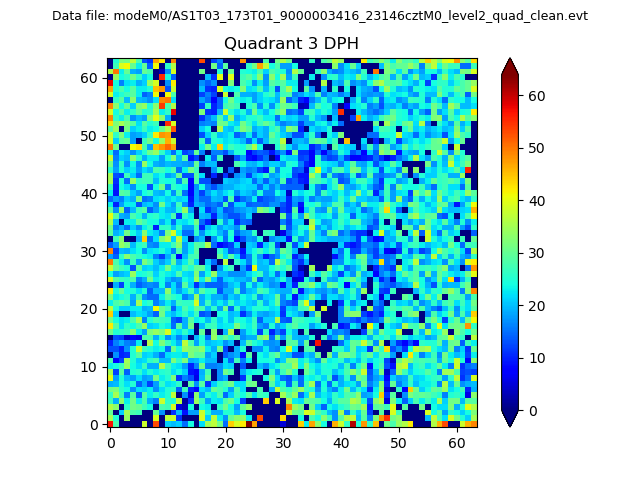 |
 |
Quadrant C |
| Plot type | Count rate plots | Images |
|---|---|---|
| Comparison with Poisson distribution Blue bars denote a histogram of data divided into 1 sec bins. Red curve is a Poisson curve with rate = median count rate of data. |
 |
 |
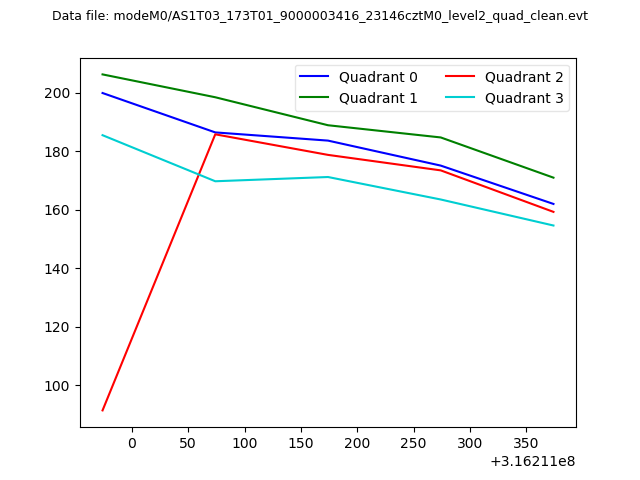
| Quadrant-wise count rates Data is divided into 100 sec bins |
 |
|
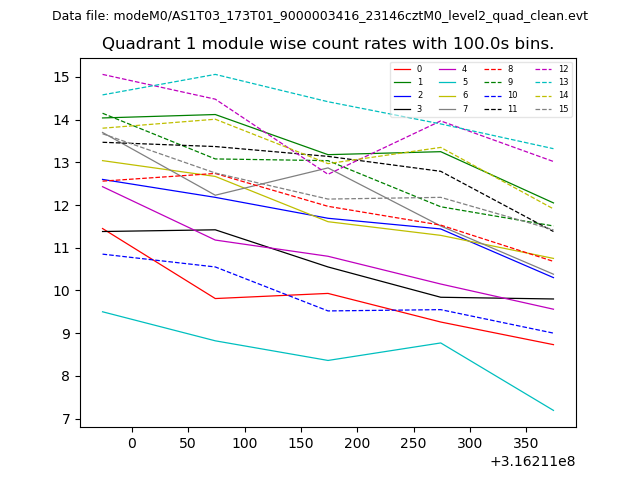
| Module-wise count rates for Quadrant A Data is divided into 100 sec bins |
 |
 |
| Module-wise count rates for Quadrant B Data is divided into 100 sec bins |
 |
 |
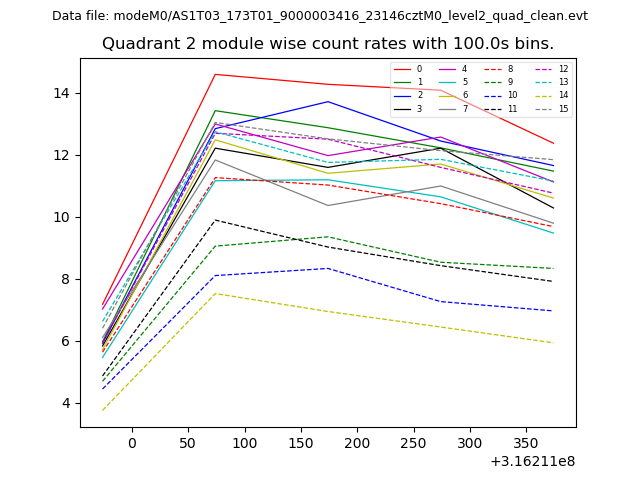
| Module-wise count rates for Quadrant C Data is divided into 100 sec bins |
 |
 |
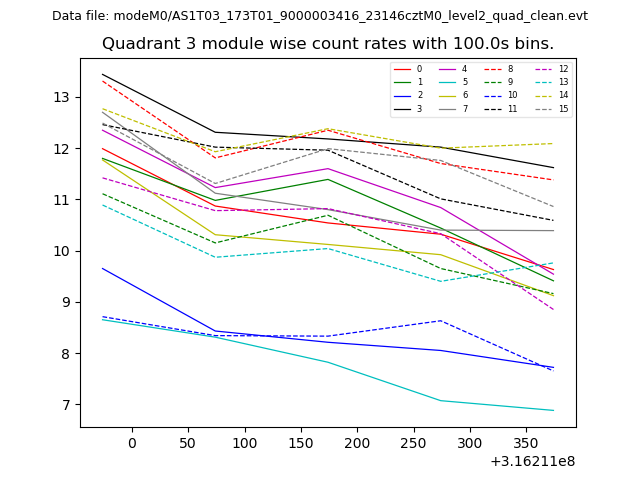
| Module-wise count rates for Quadrant D Data is divided into 100 sec bins |
 |
 |
| Parameter | Plot |
|---|---|
| CZT HV Monitor | 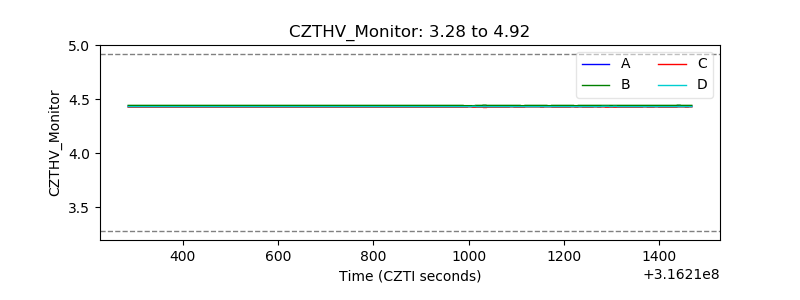 |
| D_VDD | 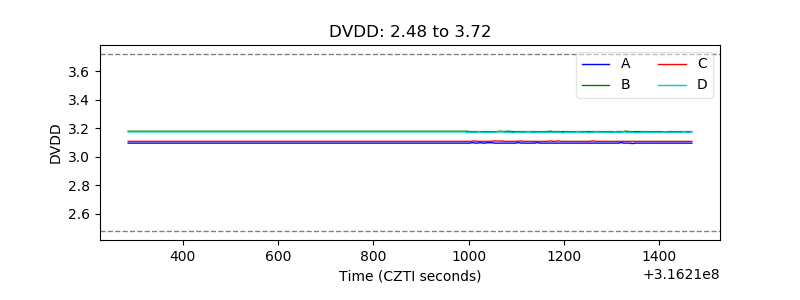 |
| Temperature 1 | 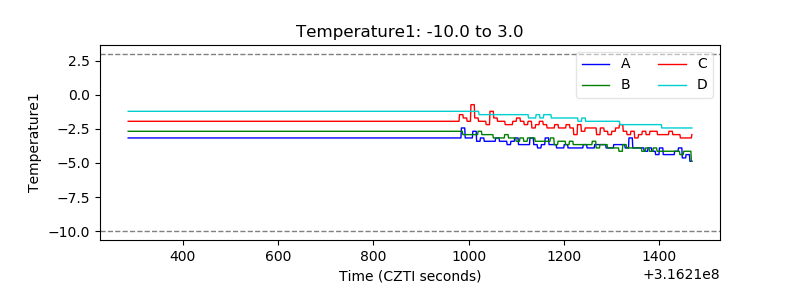 |
| Veto HV Monitor | 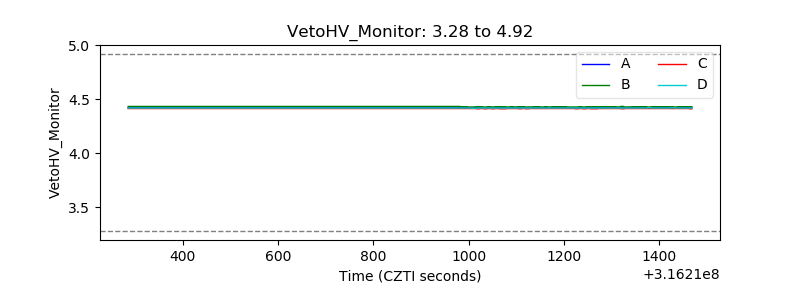 |
| Veto LLD | 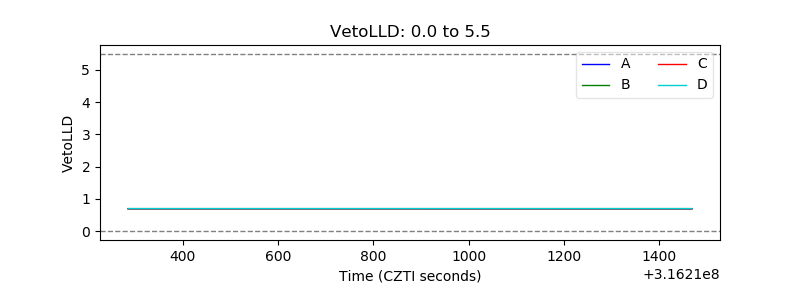 |
| Alpha Counter | 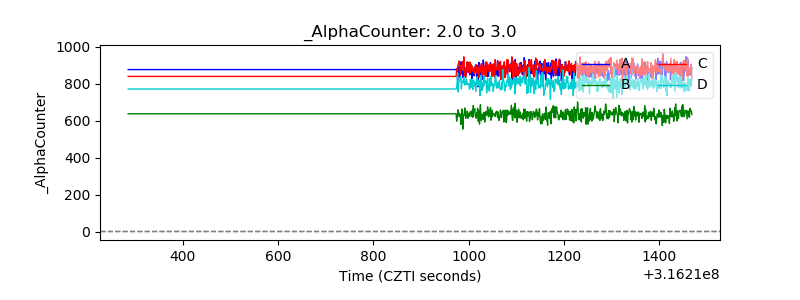 |
| _CPM_Rate | 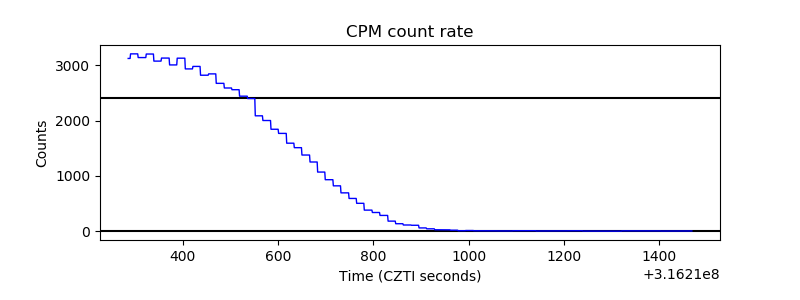 |
| CZT Counter | 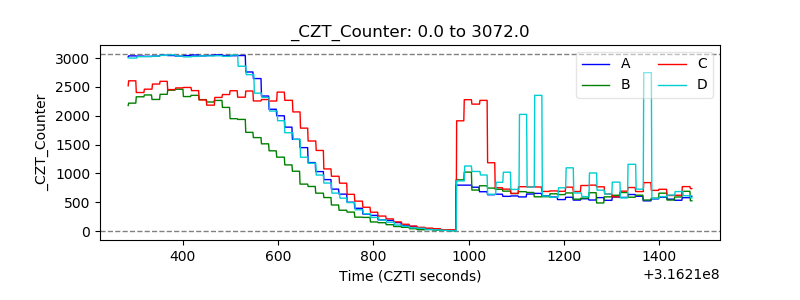 |
| +2.5 Volts monitor |  |
| +5 Volts monitor |  |
| _ROLL_ROT | 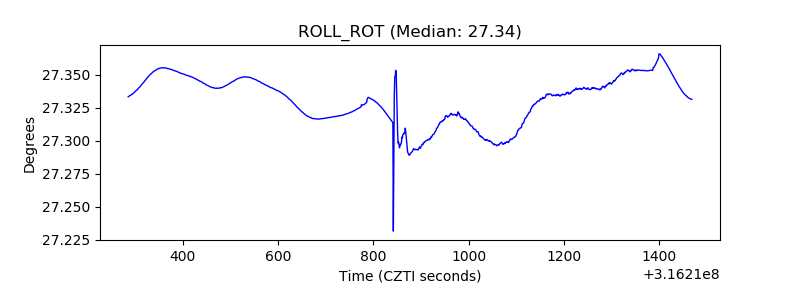 |
| _Roll_DEC | 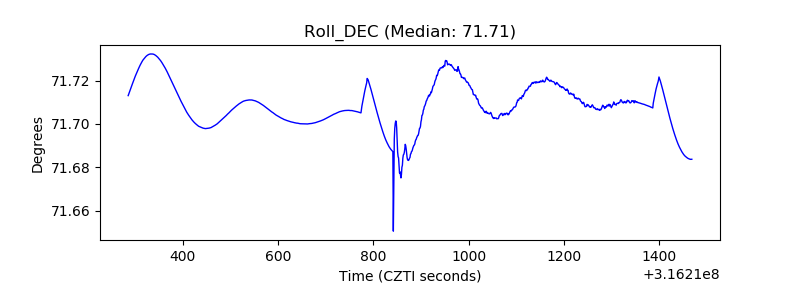 |
| _Roll_RA | 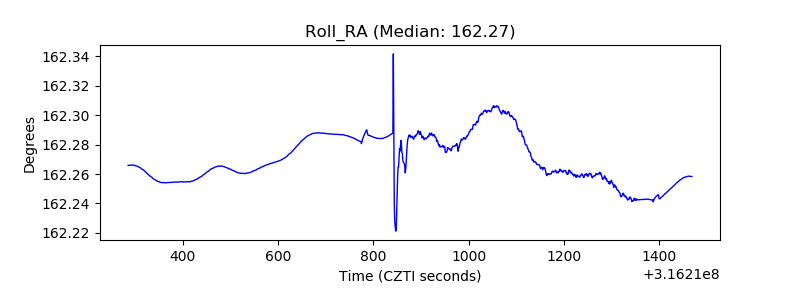 |
| Veto Counter | 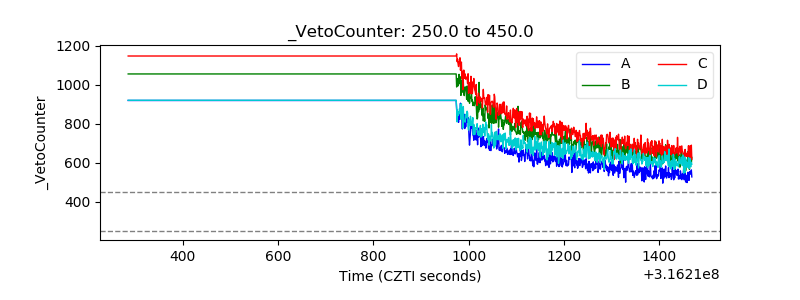 |