| Param | Original file | Final file |
|---|---|---|
| Filename | modeM0/AS1C05_002T03_9000003418cztM0_level2.fits | modeM0/AS1C05_002T03_9000003418cztM0_level2_quad_clean.evt |
| Size (bytes) | 81,596,160 | 62,326,080 |
| Size | 77.8 MB | 59.4 MB |
| Events in quadrant A | 500,442 | 343,500 |
| Events in quadrant B | 490,174 | 354,537 |
| Events in quadrant C | 497,894 | 339,760 |
| Events in quadrant D | 428,402 | 294,328 |
| Mode M9 | |||
|---|---|---|---|
| Quadrant | BADHDUFLAG | Total packets | Discarded packets |
| A | 0 | 14 | 0 |
| B | 0 | 14 | 0 |
| C | 0 | 14 | 0 |
| D | 0 | 14 | 0 |
| Mode SS | |||
|---|---|---|---|
| Quadrant | BADHDUFLAG | Total packets | Discarded packets |
| A | 0 | 162 | 0 |
| B | 0 | 162 | 0 |
| C | 0 | 162 | 0 |
| D | 0 | 162 | 0 |
| Mode M0 | |||
|---|---|---|---|
| Quadrant | BADHDUFLAG | Total packets | Discarded packets |
| A | 0 | 16392 | 0 |
| B | 0 | 16600 | 0 |
| C | 0 | 17051 | 0 |
| D | 0 | 19986 | 0 |
| Quadrant | Total seconds | Saturated seconds | Saturation percentage |
|---|---|---|---|
| A | 7975 | 33 | 0.413793% |
| B | 7975 | 48 | 0.601881% |
| C | 7975 | 142 | 1.780564% |
| D | 7975 | 314 | 3.937304% |
Noise dominated data is calculated using 1-second bins in cleaned event files. If a bin has >2000 counts, and if more than 50% of those come from <1% of pixels, then it is considered to be noise-dominated and hence unusable.
| Quadrant | # 1 sec bins | Bins with >0 counts | Bins with >2000 counts | High rate bins dominated by noise | Noise dominated (total time) | Noise dominated (detector-on time) | Marked lightcurve |
|---|---|---|---|---|---|---|---|
| A | 9360 | 7975 | 0 | 0 | 0.00% | 0.00% |  |
| B | 9360 | 7975 | 0 | 0 | 0.00% | 0.00% |  |
| C | 9360 | 7974 | 0 | 0 | 0.00% | 0.00% |  |
| D | 9360 | 7957 | 0 | 0 | 0.00% | 0.00% |  |
Top three noisy pixels from each quadrant. If the there are fewer than three noisy pixels in the level2.evt file, extra rows are filled as -1
| Pixel properties | Quadrant properties | ||||||
|---|---|---|---|---|---|---|---|
| Quadrant | DetID | PixID | Counts | Sigma | Mean | Median | Sigma |
| A | 0 | 29 | 451 | 9.76 | 130 | 123 | 33.6 |
| A | 7 | 110 | 384 | 7.76 | 130 | 123 | 33.6 |
| A | 9 | 19 | 378 | 7.59 | 130 | 123 | 33.6 |
| B | 2 | 9 | 378 | 9.26 | 129 | 124 | 27.4 |
| B | 3 | 80 | 346 | 8.1 | 129 | 124 | 27.4 |
| B | 5 | 128 | 337 | 7.77 | 129 | 124 | 27.4 |
| C | 1 | 80 | 394 | 7.79 | 131 | 124 | 34.6 |
| C | 1 | 81 | 390 | 7.68 | 131 | 124 | 34.6 |
| C | 3 | 202 | 368 | 7.04 | 131 | 124 | 34.6 |
| D | 4 | 246 | 338 | 6.61 | 122 | 112 | 34.2 |
| D | 7 | 3 | 330 | 6.37 | 122 | 112 | 34.2 |
| D | 12 | 6 | 318 | 6.02 | 122 | 112 | 34.2 |
Histogram calculated using DETX and DETY for each event in the final _common_clean file
| Quadrant A | 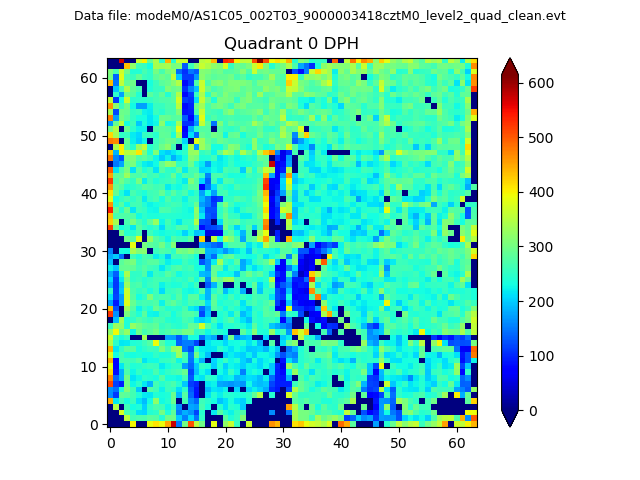 |
 |
Quadrant B |
|---|---|---|---|
| Quadrant D |  |
 |
Quadrant C |
| Plot type | Count rate plots | Images |
|---|---|---|
| Comparison with Poisson distribution Blue bars denote a histogram of data divided into 1 sec bins. Red curve is a Poisson curve with rate = median count rate of data. |
 |
 |
| Quadrant-wise count rates Data is divided into 100 sec bins |
 |
|
| Module-wise count rates for Quadrant A Data is divided into 100 sec bins |
 |
 |
| Module-wise count rates for Quadrant B Data is divided into 100 sec bins |
 |
 |
| Module-wise count rates for Quadrant C Data is divided into 100 sec bins |
 |
 |
| Module-wise count rates for Quadrant D Data is divided into 100 sec bins |
 |
 |
| Parameter | Plot |
|---|---|
| CZT HV Monitor |  |
| D_VDD |  |
| Temperature 1 |  |
| Veto HV Monitor |  |
| Veto LLD |  |
| Alpha Counter |  |
| _CPM_Rate |  |
| CZT Counter |  |
| +2.5 Volts monitor |  |
| +5 Volts monitor |  |
| _ROLL_ROT |  |
| _Roll_DEC | 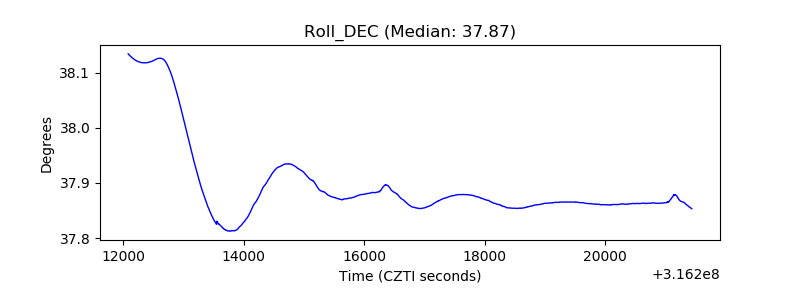 |
| _Roll_RA |  |
| Veto Counter |  |