| Param | Original file | Final file |
|---|---|---|
| Filename | modeM0/AS1C05_002T03_9000003418_23145cztM0_level2.evt | modeM0/AS1C05_002T03_9000003418_23145cztM0_level2_quad_clean.evt |
| Size (bytes) | 16,801,920 | 5,025,600 |
| Size | 16.0 MB | 4.8 MB |
| Events in quadrant A | 107,930 | 31,748 |
| Events in quadrant B | 111,758 | 33,136 |
| Events in quadrant C | 116,399 | 32,206 |
| Events in quadrant D | 154,151 | 30,884 |
| Mode SS | |||
|---|---|---|---|
| Quadrant | BADHDUFLAG | Total packets | Discarded packets |
| A | 0 | 6 | 0 |
| B | 0 | 6 | 0 |
| C | 0 | 6 | 0 |
| D | 0 | 6 | 0 |
| Mode M0 | |||
|---|---|---|---|
| Quadrant | BADHDUFLAG | Total packets | Discarded packets |
| A | 0 | 429 | 0 |
| B | 0 | 435 | 0 |
| C | 0 | 452 | 0 |
| D | 0 | 601 | 0 |
| Quadrant | Total seconds | Saturated seconds | Saturation percentage |
|---|---|---|---|
| A | 213 | 0 | 0.000000% |
| B | 213 | 0 | 0.000000% |
| C | 213 | 2 | 0.938967% |
| D | 213 | 1 | 0.469484% |
Noise dominated data is calculated using 1-second bins in cleaned event files. If a bin has >2000 counts, and if more than 50% of those come from <1% of pixels, then it is considered to be noise-dominated and hence unusable.
| Quadrant | # 1 sec bins | Bins with >0 counts | Bins with >2000 counts | High rate bins dominated by noise | Noise dominated (total time) | Noise dominated (detector-on time) | Marked lightcurve |
|---|---|---|---|---|---|---|---|
| A | 213 | 213 | 0 | 0 | 0.00% | 0.00% | 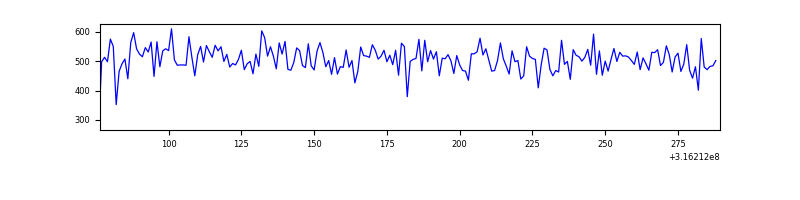 |
| B | 213 | 213 | 0 | 0 | 0.00% | 0.00% | 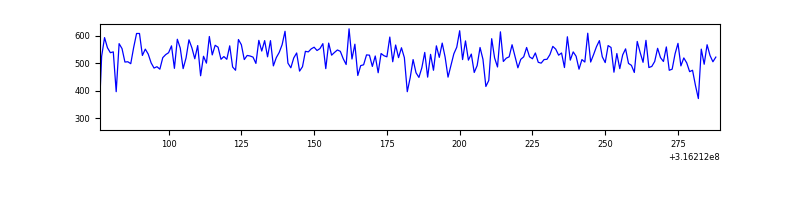 |
| C | 213 | 213 | 0 | 0 | 0.00% | 0.00% | 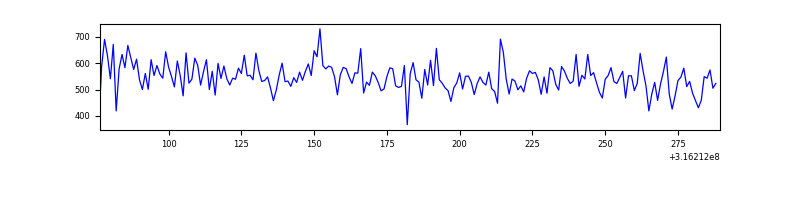 |
| D | 213 | 213 | 1 | 1 | 0.47% | 0.47% | 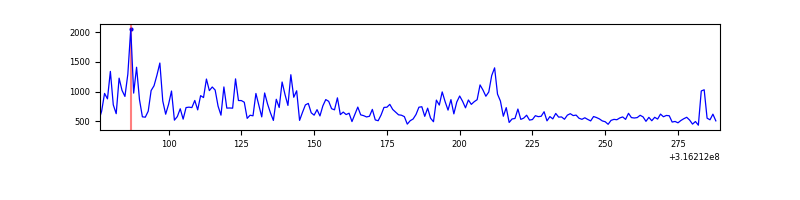 |
Top three noisy pixels from each quadrant. If the there are fewer than three noisy pixels in the level2.evt file, extra rows are filled as -1
| Pixel properties | Quadrant properties | ||||||
|---|---|---|---|---|---|---|---|
| Quadrant | DetID | PixID | Counts | Sigma | Mean | Median | Sigma |
| A | 13 | 254 | 382 | 46.15 | 27 | 27 | 7.7 |
| A | 3 | 137 | 228 | 26.13 | 27 | 27 | 7.7 |
| A | 0 | 226 | 209 | 23.66 | 27 | 27 | 7.7 |
| B | 12 | 111 | 618 | 79.05 | 28 | 27 | 7.5 |
| B | 11 | 111 | 523 | 66.34 | 28 | 27 | 7.5 |
| B | 14 | 111 | 491 | 62.06 | 28 | 27 | 7.5 |
| C | 14 | 238 | 4336 | 516.83 | 27 | 27 | 8.3 |
| C | 0 | 10 | 1825 | 215.66 | 27 | 27 | 8.3 |
| C | 7 | 247 | 891 | 103.63 | 27 | 27 | 8.3 |
| D | 7 | 238 | 33598 | 3920.12 | 27 | 26 | 8.6 |
| D | 1 | 52 | 9470 | 1102.75 | 27 | 26 | 8.6 |
| D | 13 | 153 | 3720 | 431.34 | 27 | 26 | 8.6 |
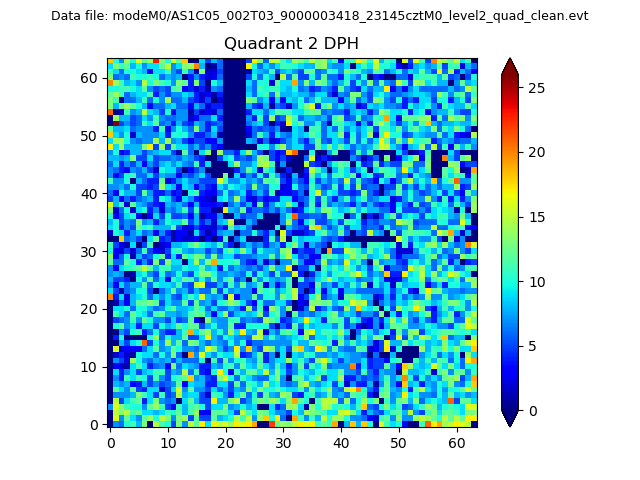
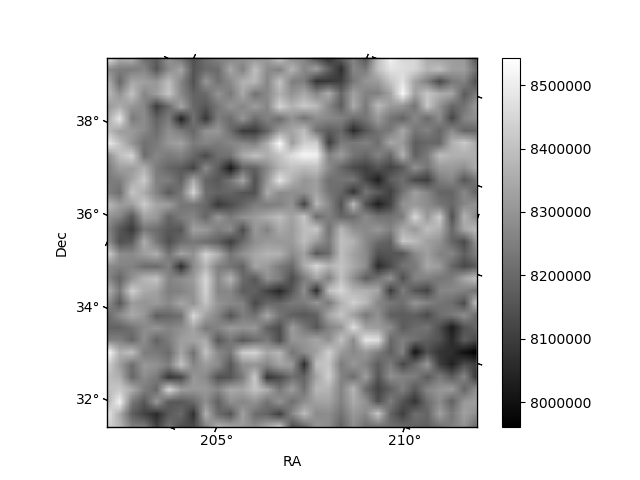
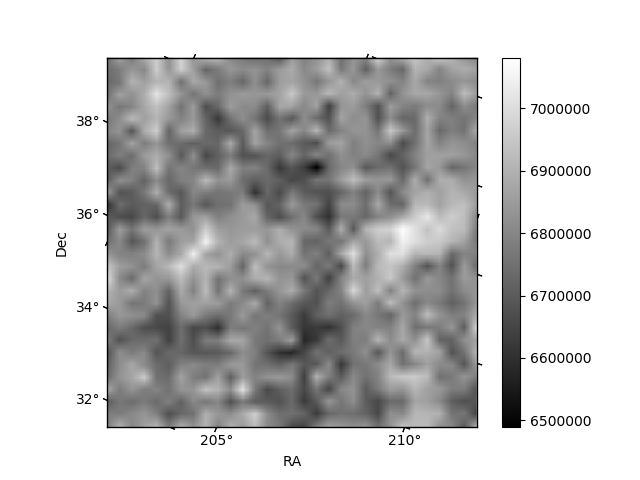
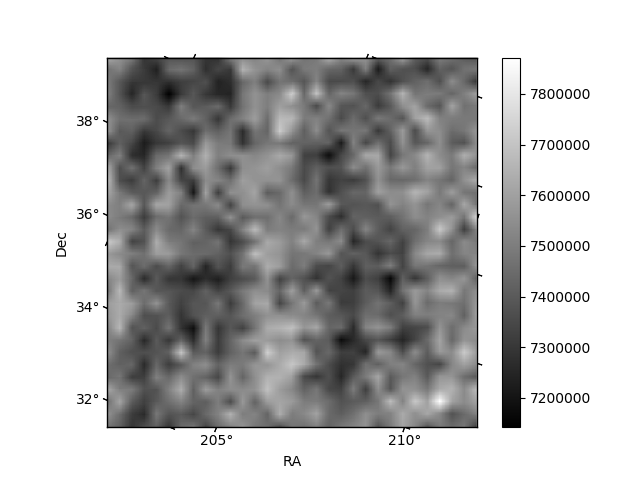
Histogram calculated using DETX and DETY for each event in the final _common_clean file
| Quadrant A | 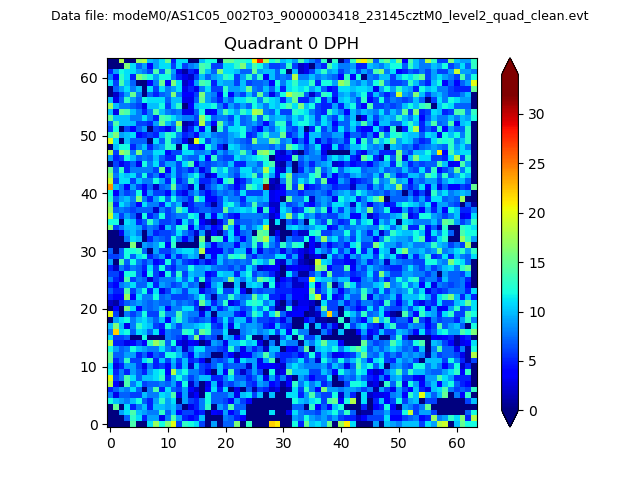 |
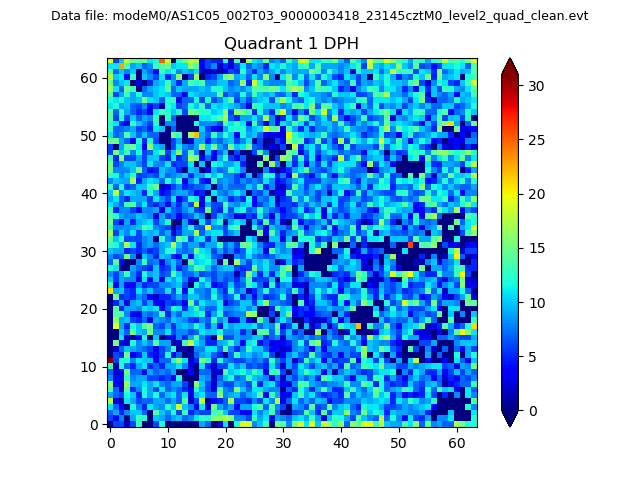 |
Quadrant B |
|---|---|---|---|
| Quadrant D | 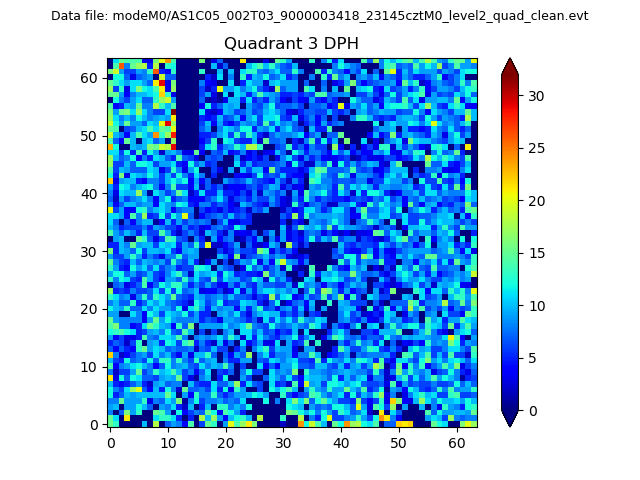 |
 |
Quadrant C |
| Plot type | Count rate plots | Images |
|---|---|---|
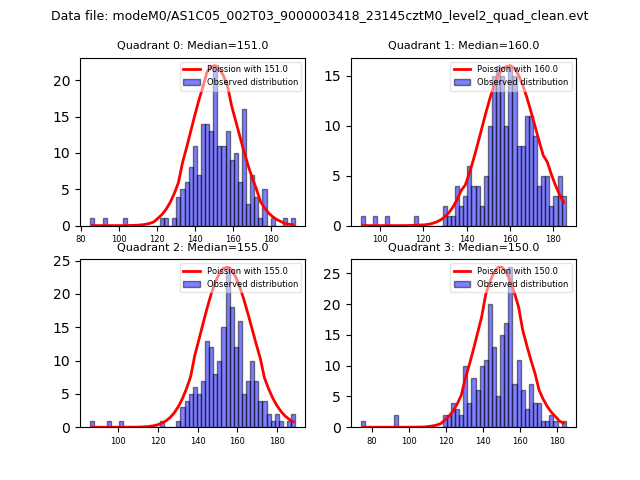
| Comparison with Poisson distribution Blue bars denote a histogram of data divided into 1 sec bins. Red curve is a Poisson curve with rate = median count rate of data. |
 |
 |
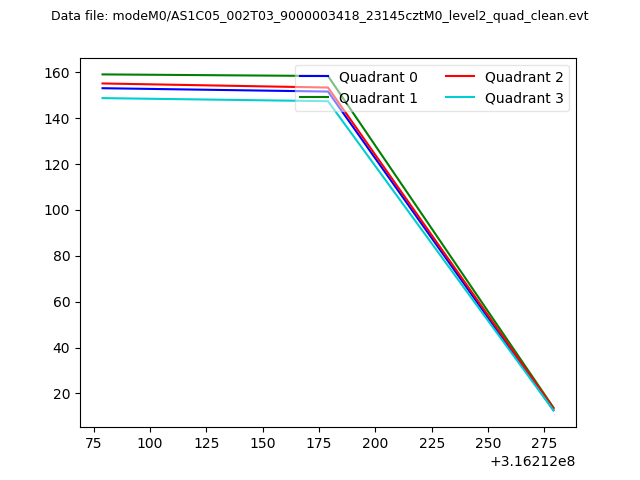
| Quadrant-wise count rates Data is divided into 100 sec bins |
 |
|
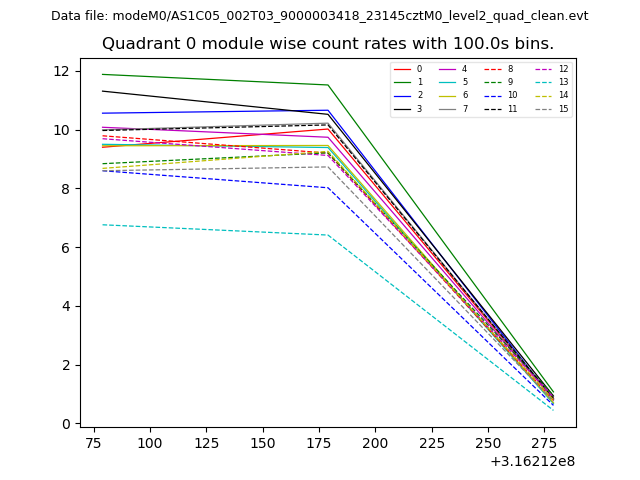
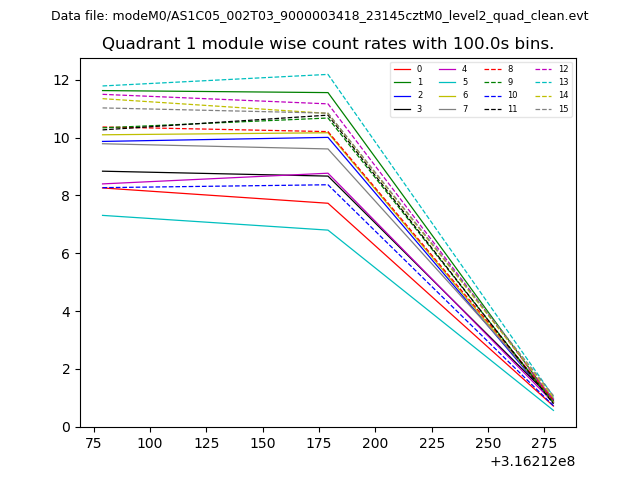
| Module-wise count rates for Quadrant A Data is divided into 100 sec bins |
 |
 |
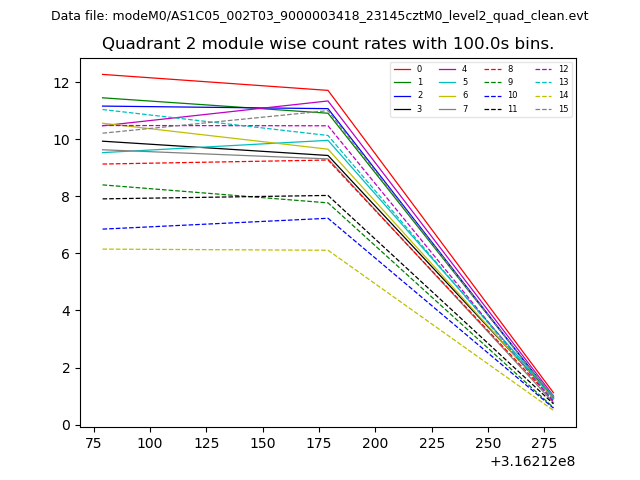
| Module-wise count rates for Quadrant B Data is divided into 100 sec bins |
 |
 |
| Module-wise count rates for Quadrant C Data is divided into 100 sec bins |
 |
 |
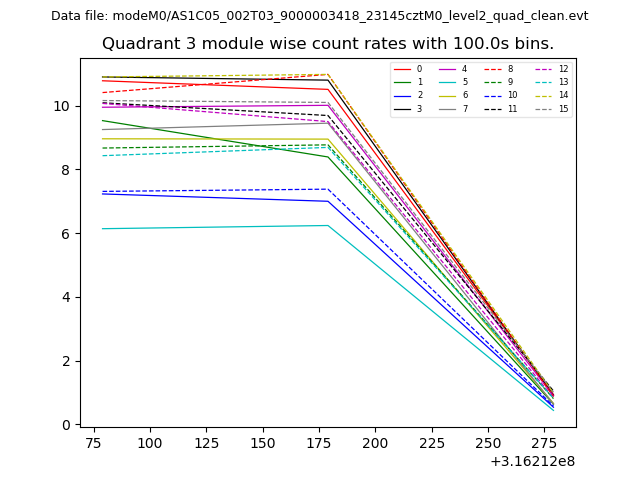
| Module-wise count rates for Quadrant D Data is divided into 100 sec bins |
 |
 |
| Parameter | Plot |
|---|---|
| CZT HV Monitor | 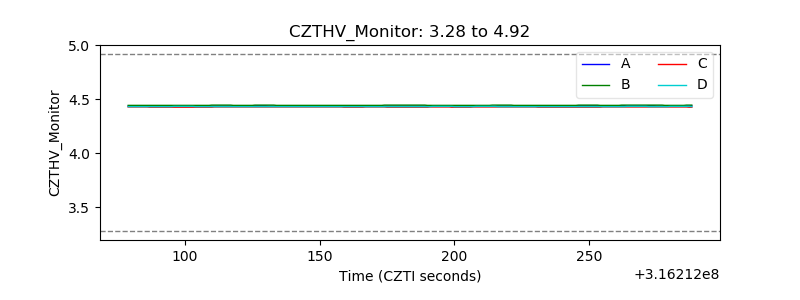 |
| D_VDD | 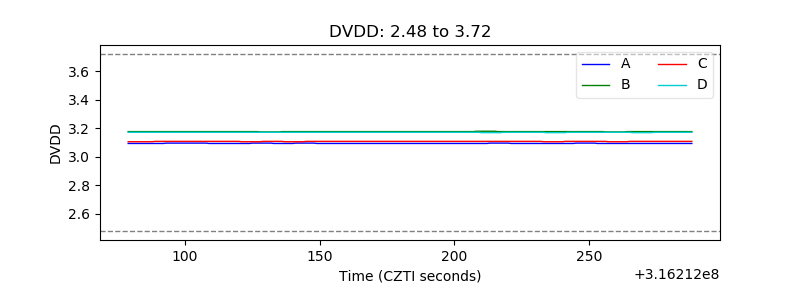 |
| Temperature 1 | 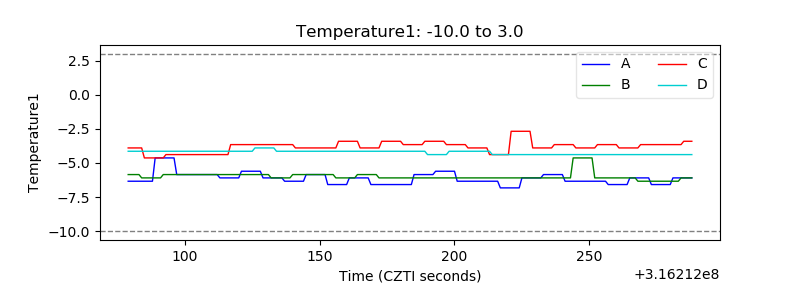 |
| Veto HV Monitor | 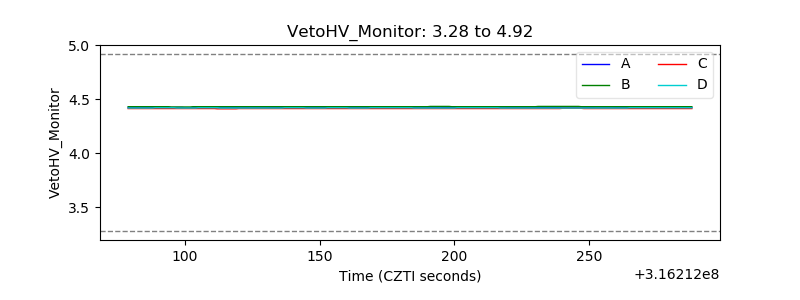 |
| Veto LLD | 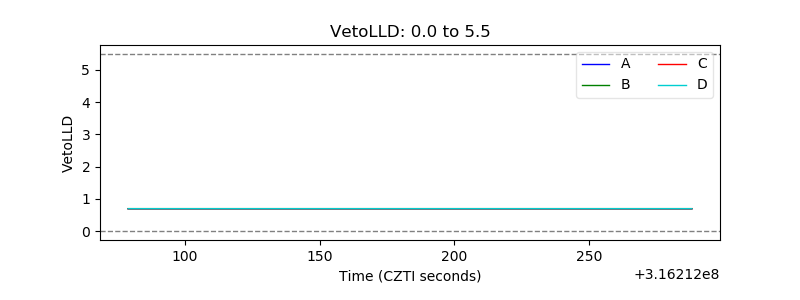 |
| Alpha Counter | 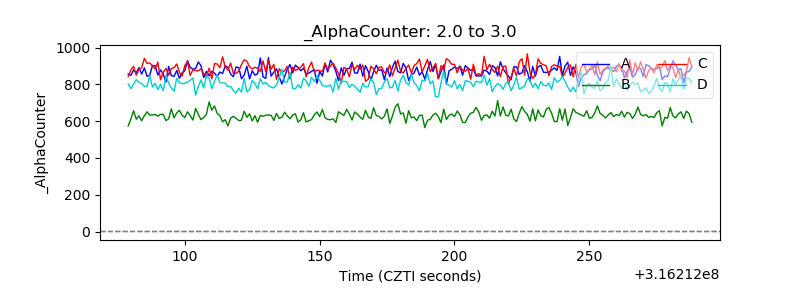 |
| _CPM_Rate | 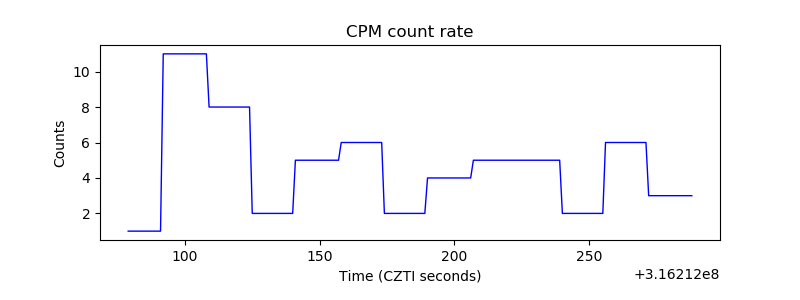 |
| CZT Counter | 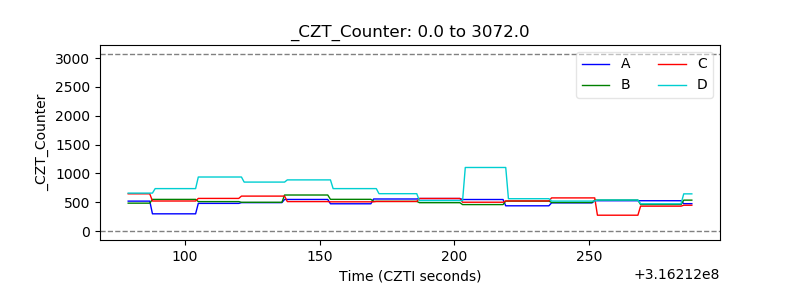 |
| +2.5 Volts monitor |  |
| +5 Volts monitor |  |
| _ROLL_ROT | 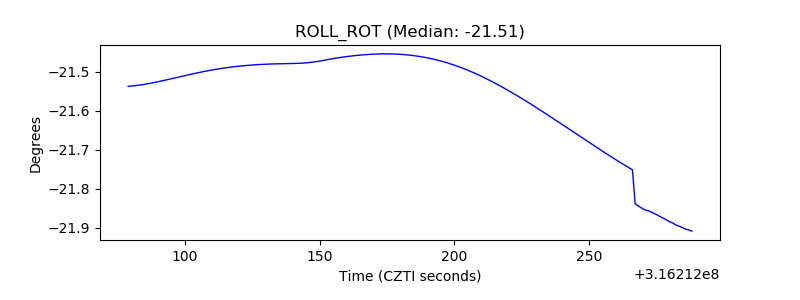 |
| _Roll_DEC | 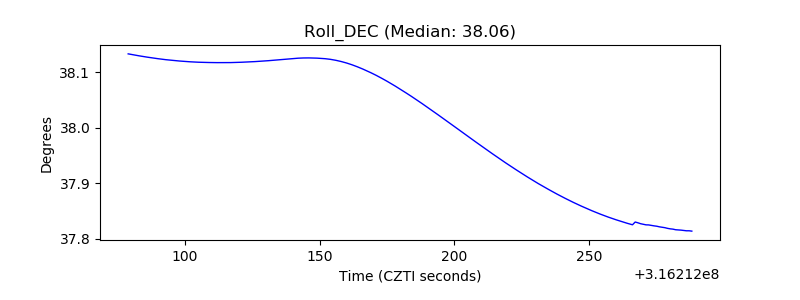 |
| _Roll_RA | 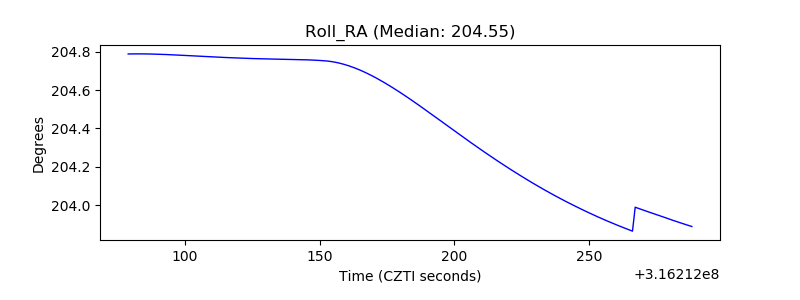 |
| Veto Counter | 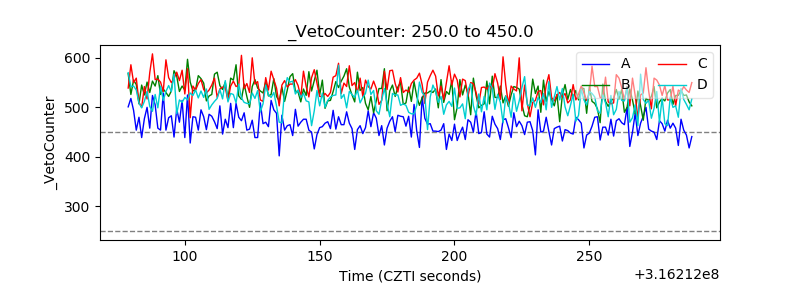 |