| Param | Original file | Final file |
|---|---|---|
| Filename | modeM0/AS1C05_002T03_9000003418_23146cztM0_level2.evt | modeM0/AS1C05_002T03_9000003418_23146cztM0_level2_quad_clean.evt |
| Size (bytes) | 370,229,760 | 92,701,440 |
| Size | 353.1 MB | 88.4 MB |
| Events in quadrant A | 2,494,324 | 609,724 |
| Events in quadrant B | 2,599,557 | 633,547 |
| Events in quadrant C | 2,756,561 | 613,254 |
| Events in quadrant D | 3,013,641 | 592,381 |
| Mode M9 | |||
|---|---|---|---|
| Quadrant | BADHDUFLAG | Total packets | Discarded packets |
| A | 0 | 14 | 0 |
| B | 0 | 14 | 0 |
| C | 0 | 14 | 0 |
| D | 0 | 14 | 0 |
| Mode SS | |||
|---|---|---|---|
| Quadrant | BADHDUFLAG | Total packets | Discarded packets |
| A | 0 | 104 | 0 |
| B | 0 | 104 | 0 |
| C | 0 | 104 | 0 |
| D | 0 | 104 | 0 |
| Mode M0 | |||
|---|---|---|---|
| Quadrant | BADHDUFLAG | Total packets | Discarded packets |
| A | 0 | 10675 | 1 |
| B | 0 | 10878 | 1 |
| C | 0 | 11308 | 1 |
| D | 0 | 12376 | 1 |
| Quadrant | Total seconds | Saturated seconds | Saturation percentage |
|---|---|---|---|
| A | 5118 | 33 | 0.644783% |
| B | 5118 | 47 | 0.918327% |
| C | 5118 | 141 | 2.754982% |
| D | 5118 | 84 | 1.641266% |
Noise dominated data is calculated using 1-second bins in cleaned event files. If a bin has >2000 counts, and if more than 50% of those come from <1% of pixels, then it is considered to be noise-dominated and hence unusable.
| Quadrant | # 1 sec bins | Bins with >0 counts | Bins with >2000 counts | High rate bins dominated by noise | Noise dominated (total time) | Noise dominated (detector-on time) | Marked lightcurve |
|---|---|---|---|---|---|---|---|
| A | 6503 | 5119 | 0 | 0 | 0.00% | 0.00% | 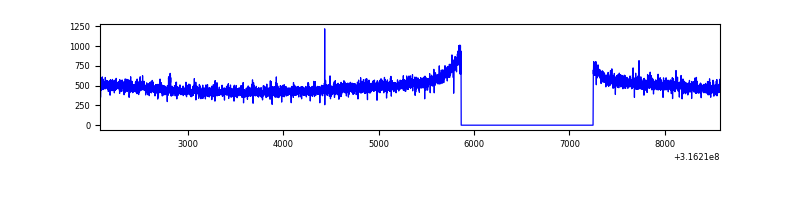 |
| B | 6503 | 5119 | 2 | 2 | 0.03% | 0.04% | 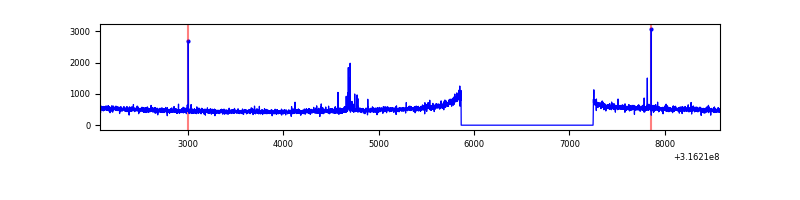 |
| C | 6503 | 5119 | 47 | 47 | 0.72% | 0.92% | 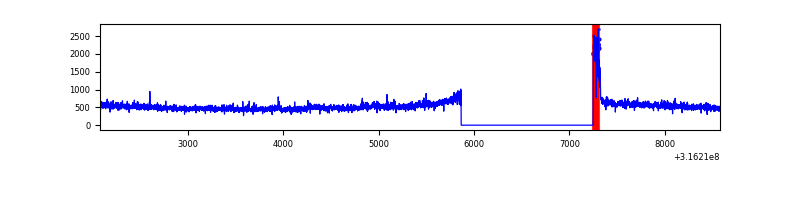 |
| D | 6503 | 5119 | 47 | 47 | 0.72% | 0.92% | 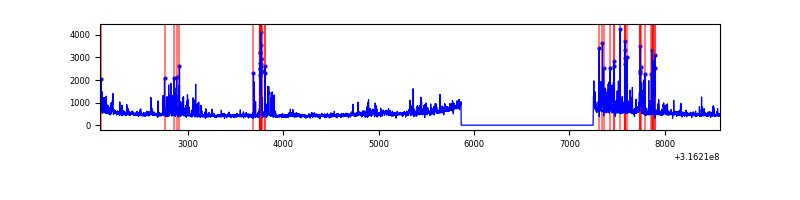 |
Top three noisy pixels from each quadrant. If the there are fewer than three noisy pixels in the level2.evt file, extra rows are filled as -1
| Pixel properties | Quadrant properties | ||||||
|---|---|---|---|---|---|---|---|
| Quadrant | DetID | PixID | Counts | Sigma | Mean | Median | Sigma |
| A | 6 | 16 | 8081 | 57.65 | 645 | 634 | 129.2 |
| A | 13 | 254 | 8057 | 57.46 | 645 | 634 | 129.2 |
| A | 3 | 137 | 5509 | 37.74 | 645 | 634 | 129.2 |
| B | 14 | 207 | 25584 | 204.23 | 652 | 638 | 122.1 |
| B | 12 | 111 | 14603 | 114.33 | 652 | 638 | 122.1 |
| B | 11 | 111 | 13045 | 101.57 | 652 | 638 | 122.1 |
| C | 0 | 10 | 164242 | 1113.47 | 628 | 634 | 146.9 |
| C | 14 | 238 | 100263 | 678.05 | 628 | 634 | 146.9 |
| C | 7 | 247 | 24922 | 165.3 | 628 | 634 | 146.9 |
| D | 1 | 52 | 367023 | 2371.84 | 632 | 616 | 154.5 |
| D | 2 | 136 | 91502 | 588.33 | 632 | 616 | 154.5 |
| D | 7 | 238 | 68524 | 439.58 | 632 | 616 | 154.5 |
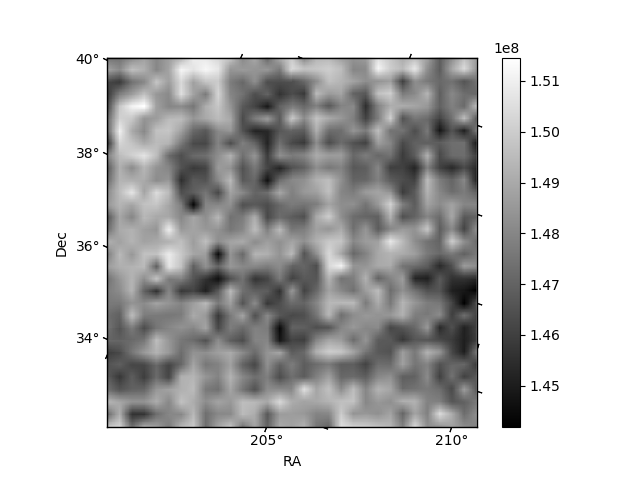
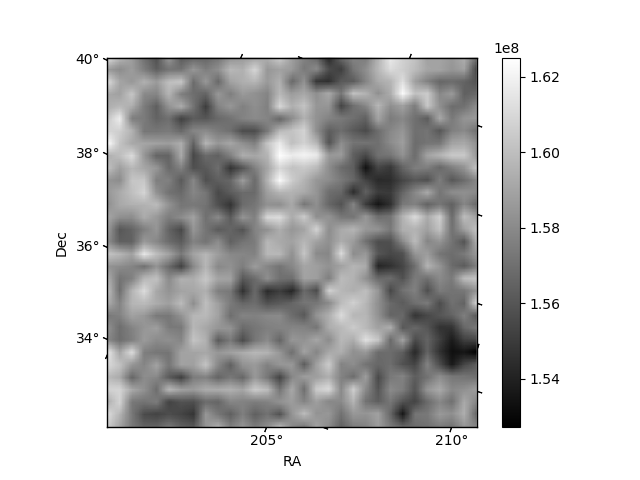
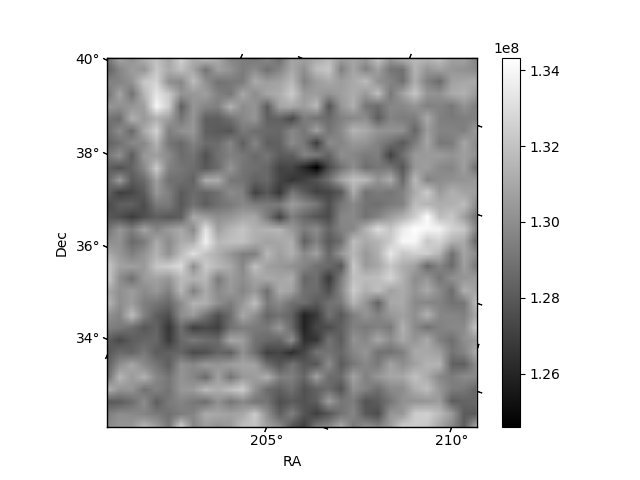
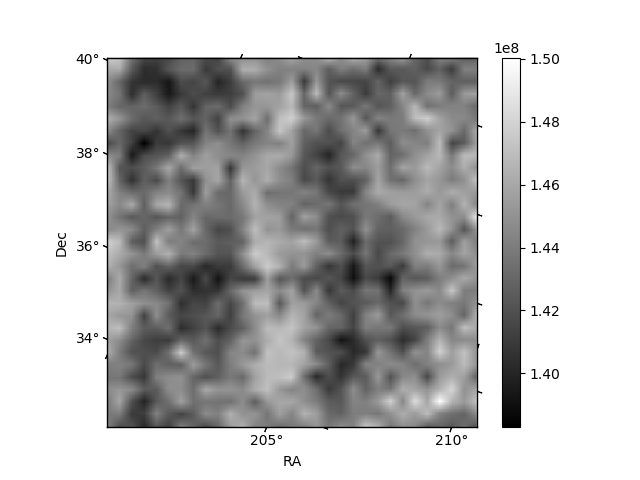
Histogram calculated using DETX and DETY for each event in the final _common_clean file
| Quadrant A | 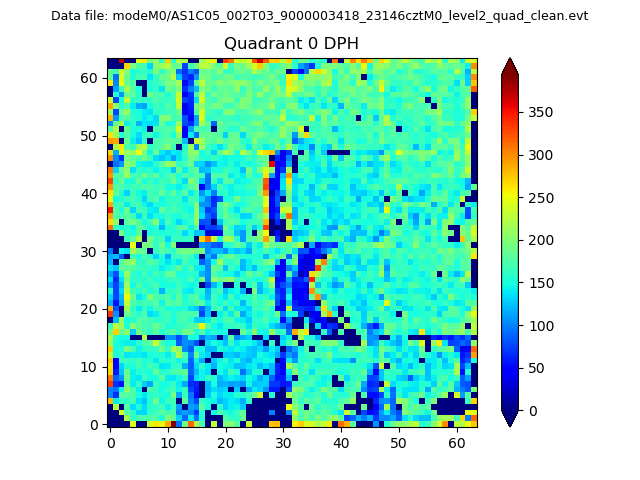 |
 |
Quadrant B |
|---|---|---|---|
| Quadrant D | 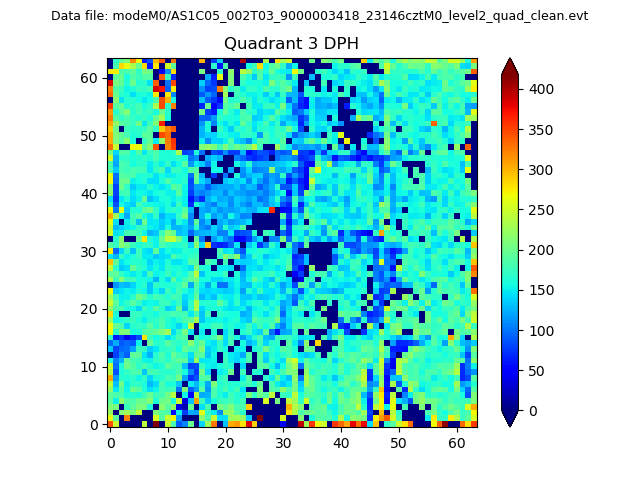 |
 |
Quadrant C |
| Plot type | Count rate plots | Images |
|---|---|---|
| Comparison with Poisson distribution Blue bars denote a histogram of data divided into 1 sec bins. Red curve is a Poisson curve with rate = median count rate of data. |
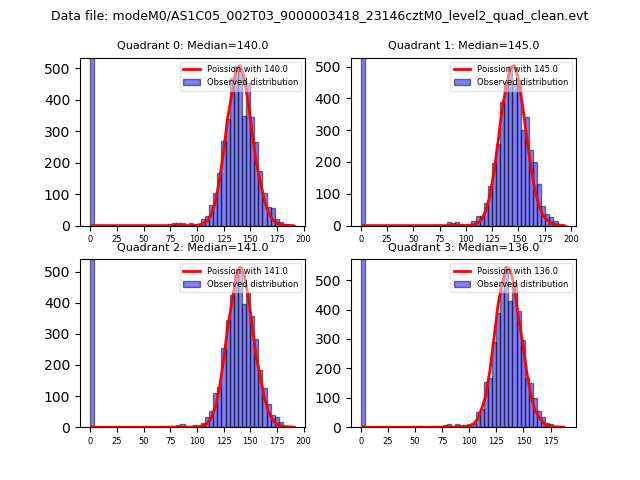 |
 |
| Quadrant-wise count rates Data is divided into 100 sec bins |
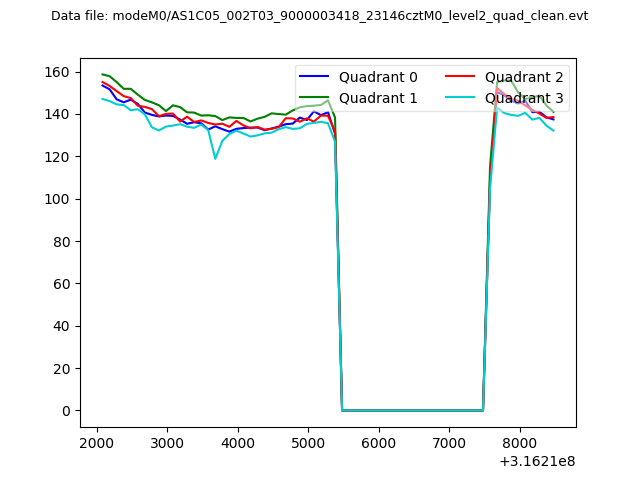 |
|
| Module-wise count rates for Quadrant A Data is divided into 100 sec bins |
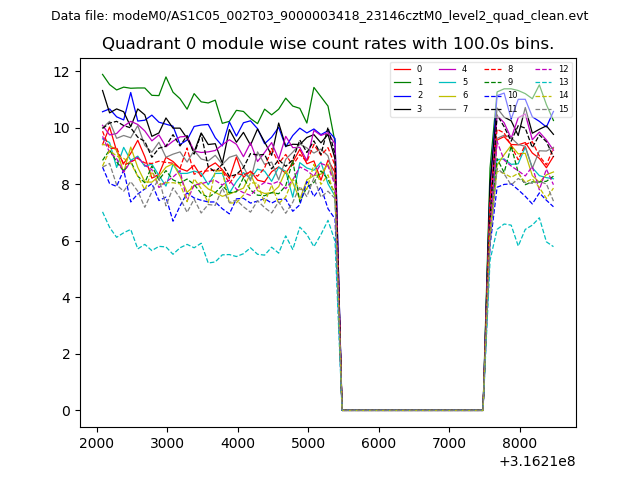 |
 |
| Module-wise count rates for Quadrant B Data is divided into 100 sec bins |
 |
 |
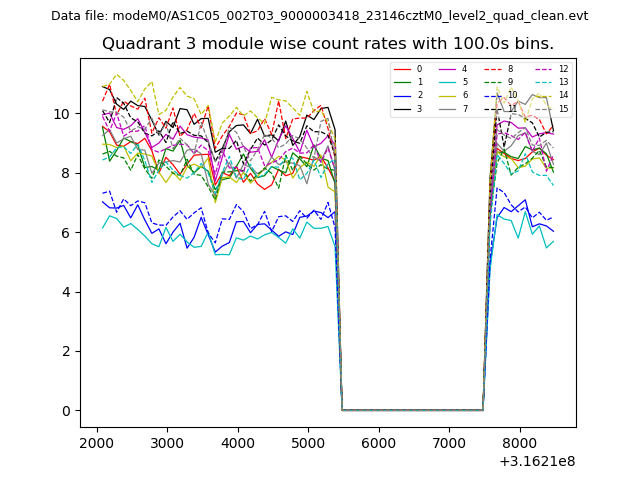
| Module-wise count rates for Quadrant C Data is divided into 100 sec bins |
 |
 |
| Module-wise count rates for Quadrant D Data is divided into 100 sec bins |
 |
 |
| Parameter | Plot |
|---|---|
| CZT HV Monitor | 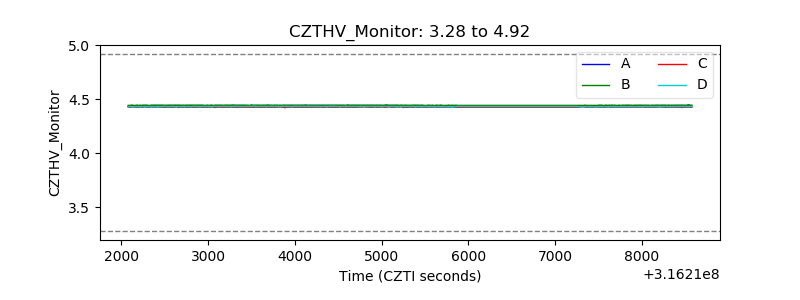 |
| D_VDD | 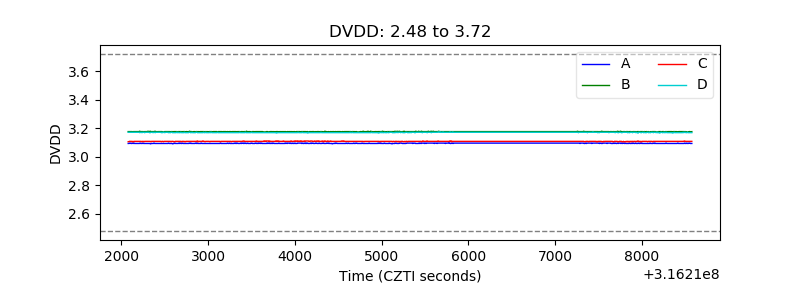 |
| Temperature 1 | 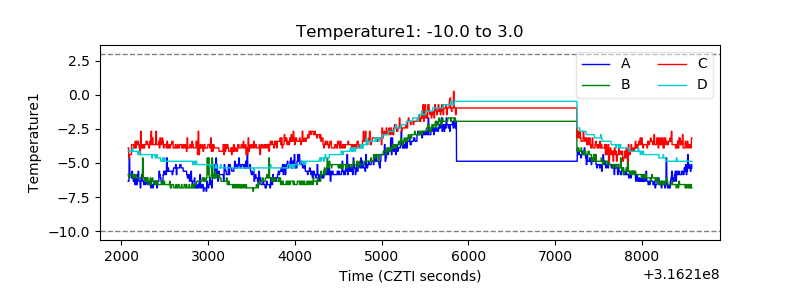 |
| Veto HV Monitor | 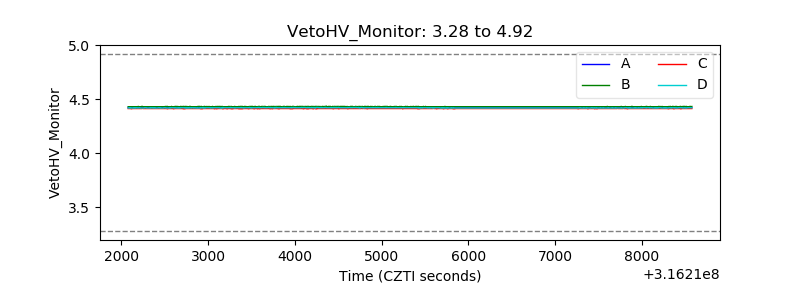 |
| Veto LLD | 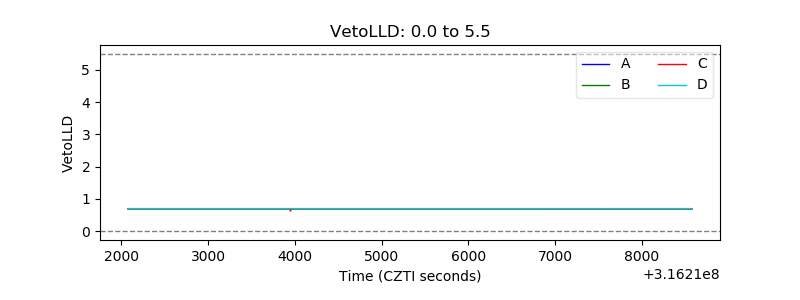 |
| Alpha Counter | 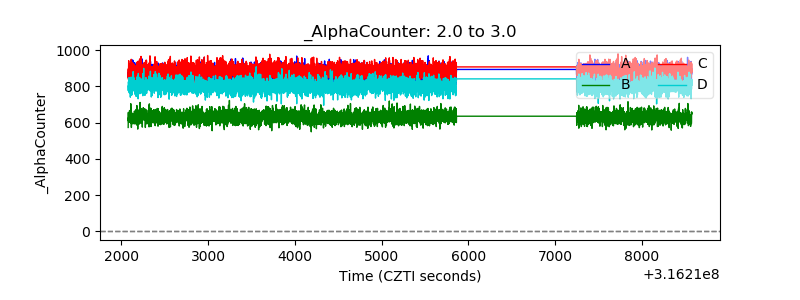 |
| _CPM_Rate | 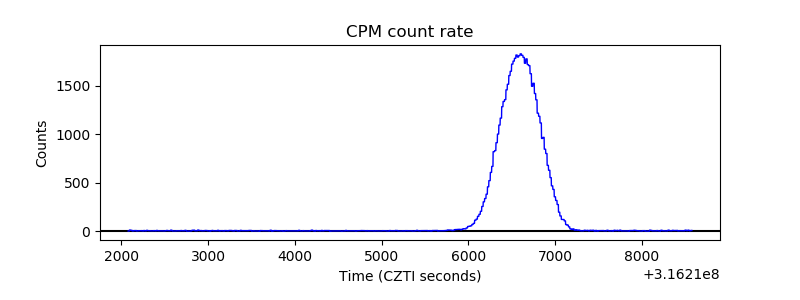 |
| CZT Counter |  |
| +2.5 Volts monitor | 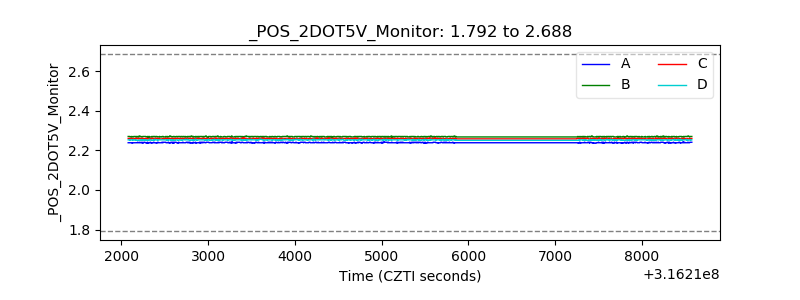 |
| +5 Volts monitor |  |
| _ROLL_ROT | 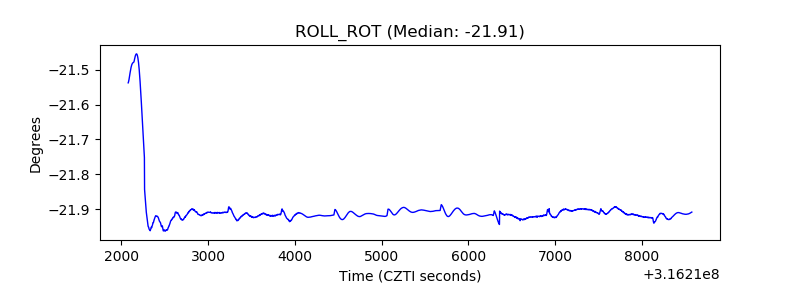 |
| _Roll_DEC | 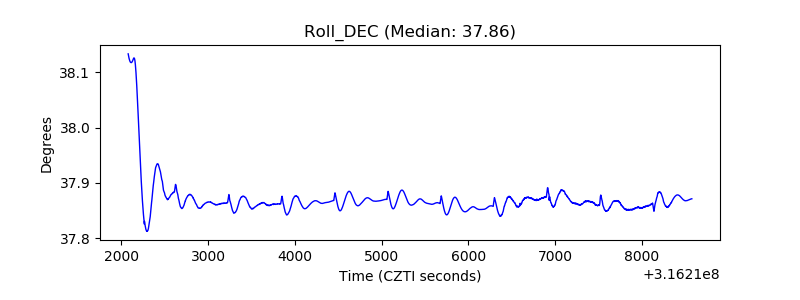 |
| _Roll_RA | 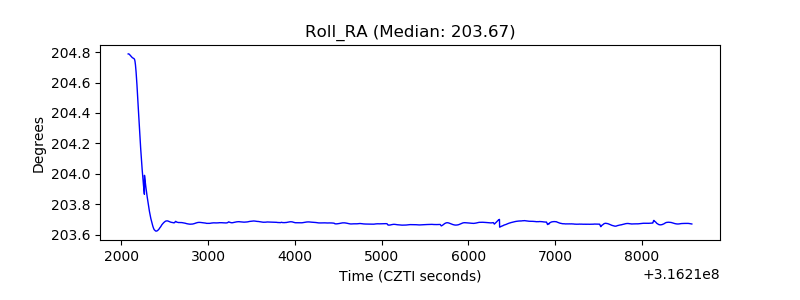 |
| Veto Counter | 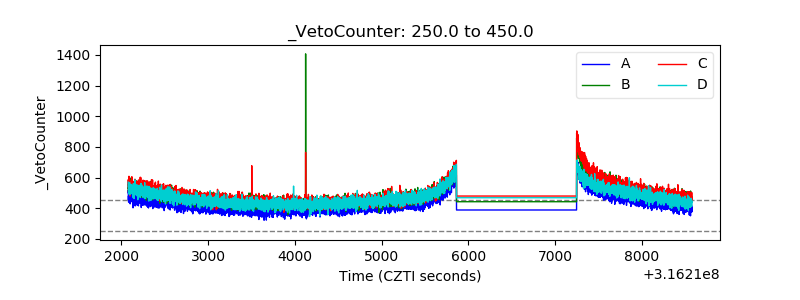 |