| Param | Original file | Final file |
|---|---|---|
| Filename | modeM0/AS1C05_002T03_9000003418_23147cztM0_level2.evt | modeM0/AS1C05_002T03_9000003418_23147cztM0_level2_quad_clean.evt |
| Size (bytes) | 301,921,920 | 74,949,120 |
| Size | 287.9 MB | 71.5 MB |
| Events in quadrant A | 1,931,814 | 496,141 |
| Events in quadrant B | 1,978,098 | 514,453 |
| Events in quadrant C | 2,143,940 | 497,267 |
| Events in quadrant D | 2,803,912 | 466,802 |
| Mode M9 | |||
|---|---|---|---|
| Quadrant | BADHDUFLAG | Total packets | Discarded packets |
| A | 0 | 5 | 0 |
| B | 0 | 6 | 0 |
| C | 0 | 6 | 0 |
| D | 0 | 6 | 0 |
| Mode SS | |||
|---|---|---|---|
| Quadrant | BADHDUFLAG | Total packets | Discarded packets |
| A | 0 | 84 | 0 |
| B | 0 | 84 | 0 |
| C | 0 | 84 | 0 |
| D | 0 | 84 | 0 |
| Mode M0 | |||
|---|---|---|---|
| Quadrant | BADHDUFLAG | Total packets | Discarded packets |
| A | 0 | 8544 | 1 |
| B | 0 | 8622 | 1 |
| C | 0 | 9054 | 1 |
| D | 0 | 11219 | 1 |
| Quadrant | Total seconds | Saturated seconds | Saturation percentage |
|---|---|---|---|
| A | 4187 | 1 | 0.023883% |
| B | 4187 | 6 | 0.143301% |
| C | 4187 | 84 | 2.006210% |
| D | 4187 | 277 | 6.615715% |
Noise dominated data is calculated using 1-second bins in cleaned event files. If a bin has >2000 counts, and if more than 50% of those come from <1% of pixels, then it is considered to be noise-dominated and hence unusable.
| Quadrant | # 1 sec bins | Bins with >0 counts | Bins with >2000 counts | High rate bins dominated by noise | Noise dominated (total time) | Noise dominated (detector-on time) | Marked lightcurve |
|---|---|---|---|---|---|---|---|
| A | 4187 | 4187 | 0 | 0 | 0.00% | 0.00% | 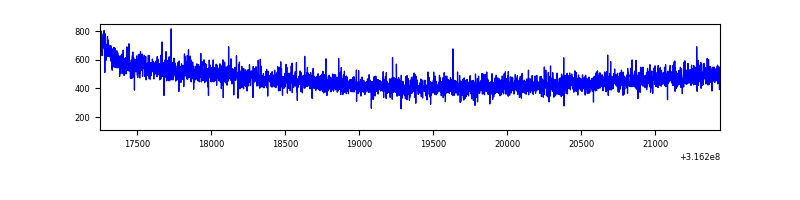 |
| B | 4187 | 4187 | 1 | 1 | 0.02% | 0.02% | 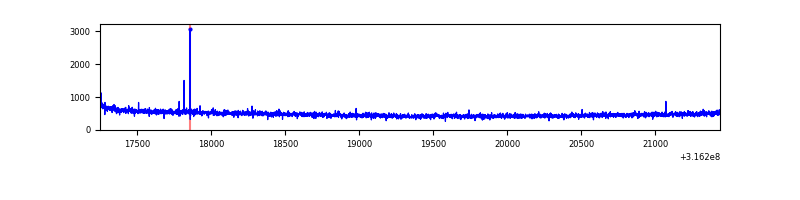 |
| C | 4187 | 4187 | 47 | 47 | 1.12% | 1.12% | 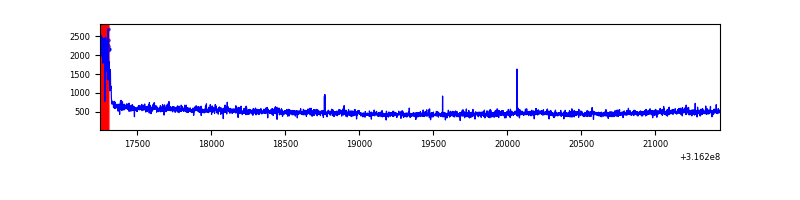 |
| D | 4187 | 4187 | 237 | 237 | 5.66% | 5.66% | 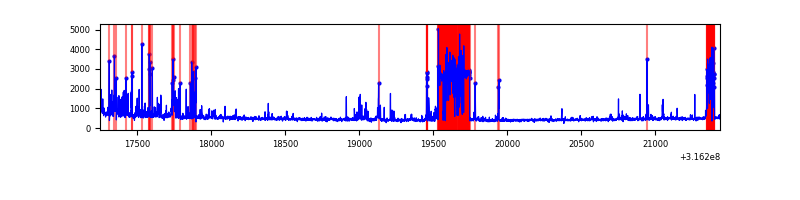 |
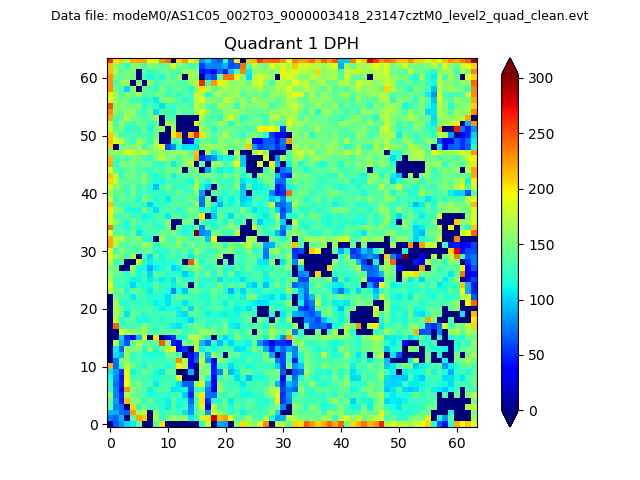
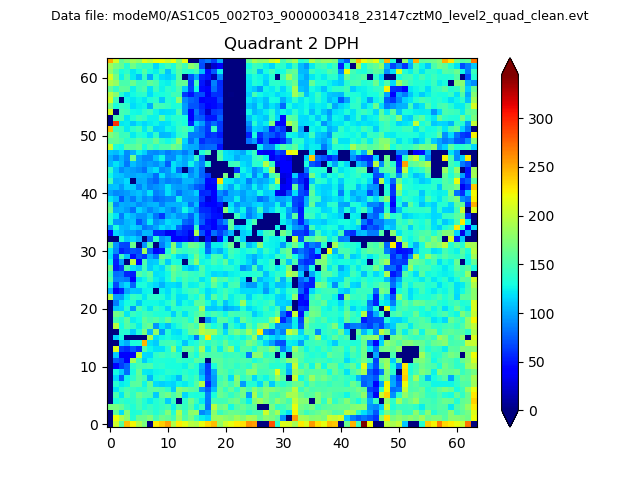
Top three noisy pixels from each quadrant. If the there are fewer than three noisy pixels in the level2.evt file, extra rows are filled as -1
| Pixel properties | Quadrant properties | ||||||
|---|---|---|---|---|---|---|---|
| Quadrant | DetID | PixID | Counts | Sigma | Mean | Median | Sigma |
| A | 6 | 16 | 12353 | 118.19 | 498 | 489 | 100.4 |
| A | 13 | 254 | 5469 | 49.61 | 498 | 489 | 100.4 |
| A | 3 | 137 | 4271 | 37.68 | 498 | 489 | 100.4 |
| B | 12 | 111 | 11126 | 110.7 | 504 | 493 | 96.1 |
| B | 11 | 111 | 10057 | 99.57 | 504 | 493 | 96.1 |
| B | 14 | 111 | 9001 | 88.58 | 504 | 493 | 96.1 |
| C | 0 | 10 | 138750 | 1223.48 | 481 | 484 | 113.0 |
| C | 14 | 238 | 77080 | 677.78 | 481 | 484 | 113.0 |
| C | 8 | 208 | 24410 | 211.71 | 481 | 484 | 113.0 |
| D | 2 | 136 | 494713 | 4270.78 | 473 | 460 | 115.7 |
| D | 1 | 52 | 451073 | 3893.69 | 473 | 460 | 115.7 |
| D | 13 | 104 | 20055 | 169.32 | 473 | 460 | 115.7 |
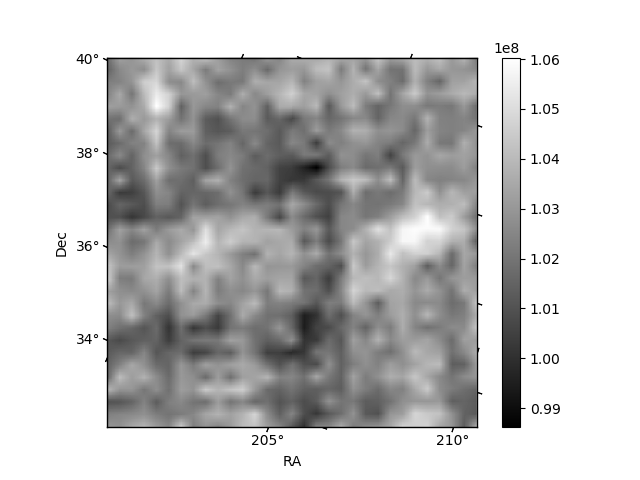
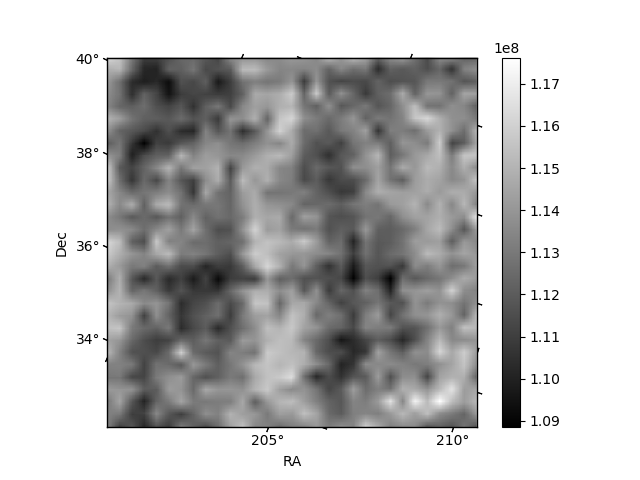
Histogram calculated using DETX and DETY for each event in the final _common_clean file
| Quadrant A | 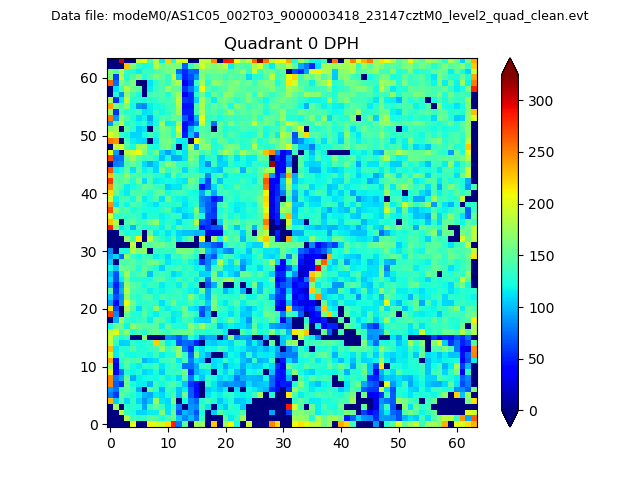 |
 |
Quadrant B |
|---|---|---|---|
| Quadrant D | 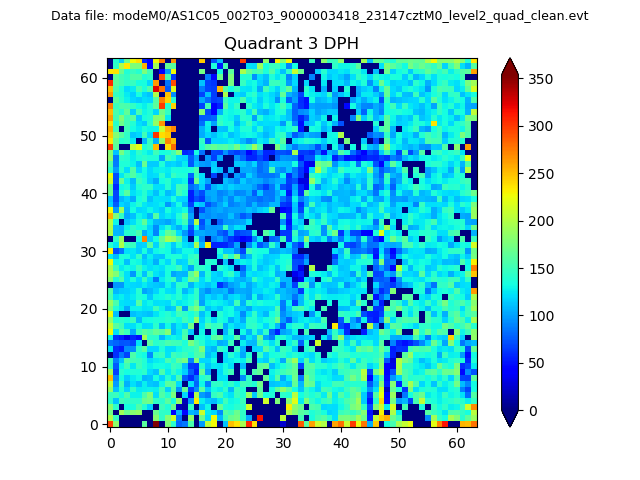 |
 |
Quadrant C |
| Plot type | Count rate plots | Images |
|---|---|---|
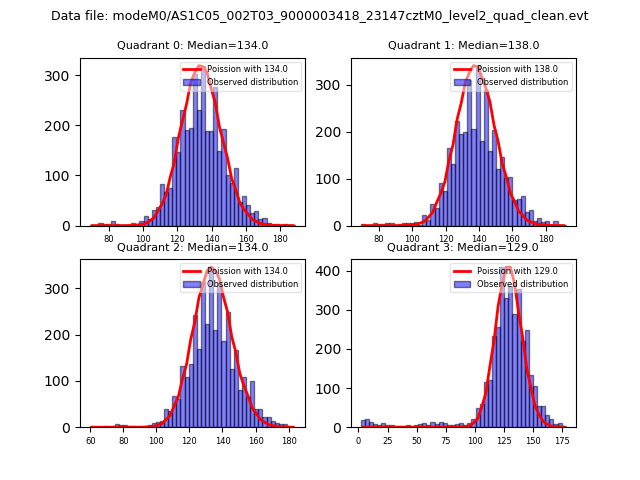
| Comparison with Poisson distribution Blue bars denote a histogram of data divided into 1 sec bins. Red curve is a Poisson curve with rate = median count rate of data. |
 |
 |
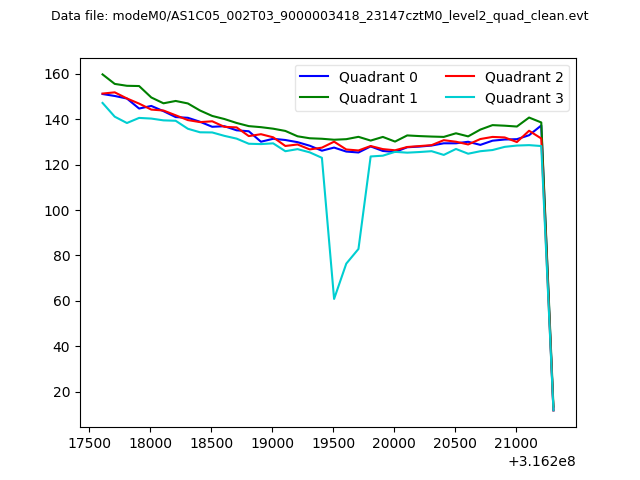
| Quadrant-wise count rates Data is divided into 100 sec bins |
 |
|
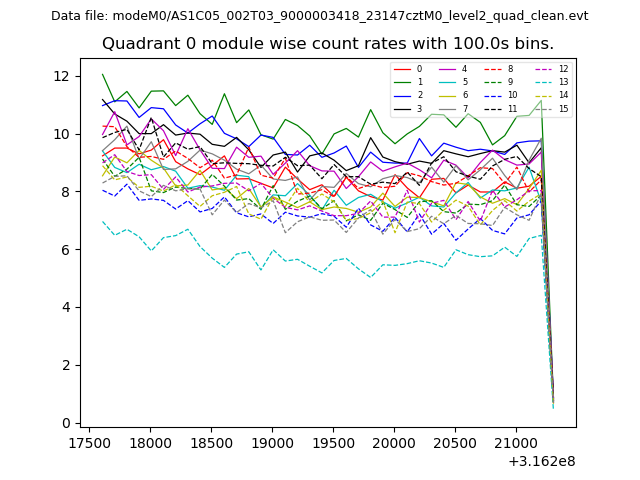
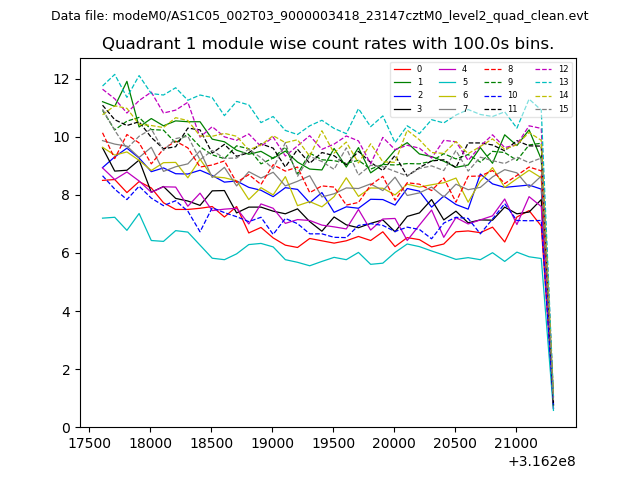
| Module-wise count rates for Quadrant A Data is divided into 100 sec bins |
 |
 |
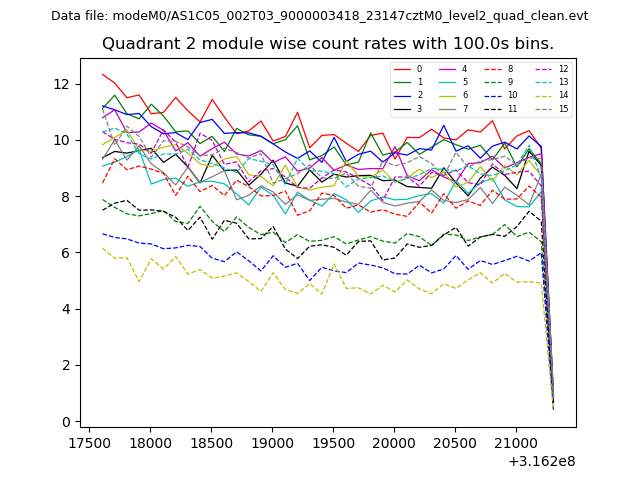
| Module-wise count rates for Quadrant B Data is divided into 100 sec bins |
 |
 |
| Module-wise count rates for Quadrant C Data is divided into 100 sec bins |
 |
 |
| Module-wise count rates for Quadrant D Data is divided into 100 sec bins |
 |
 |
| Parameter | Plot |
|---|---|
| CZT HV Monitor | 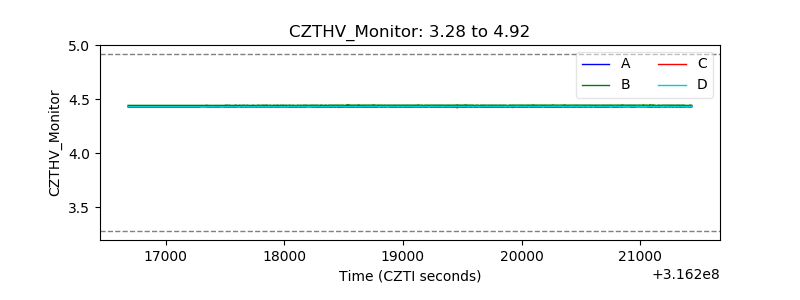 |
| D_VDD | 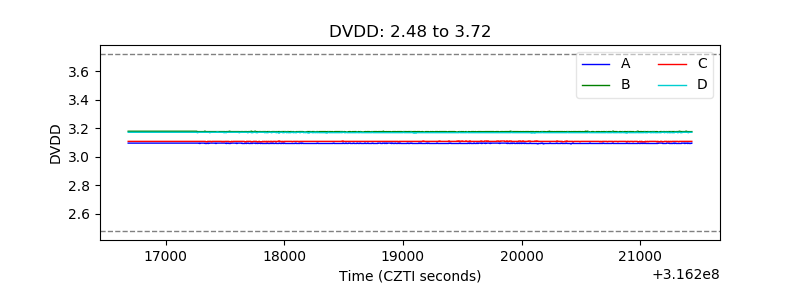 |
| Temperature 1 | 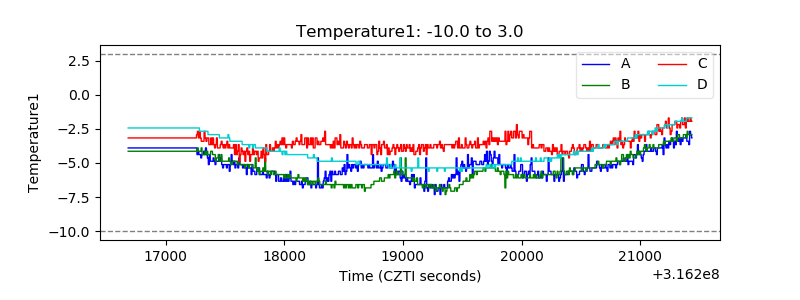 |
| Veto HV Monitor | 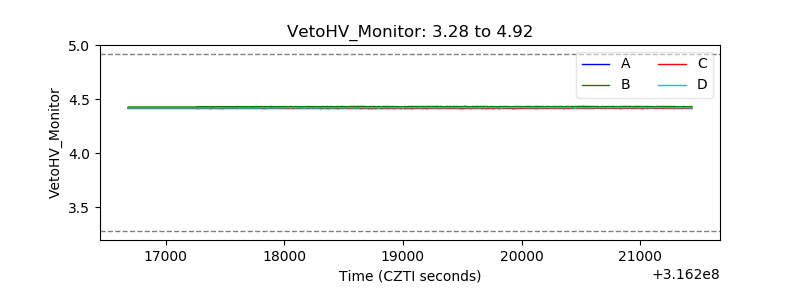 |
| Veto LLD | 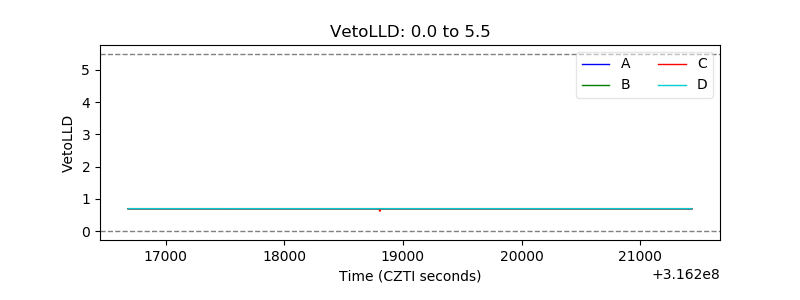 |
| Alpha Counter | 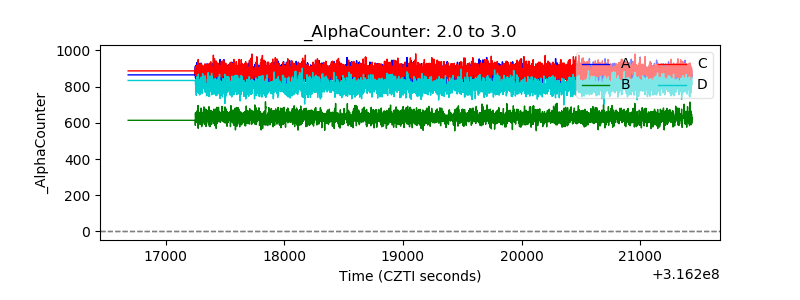 |
| _CPM_Rate | 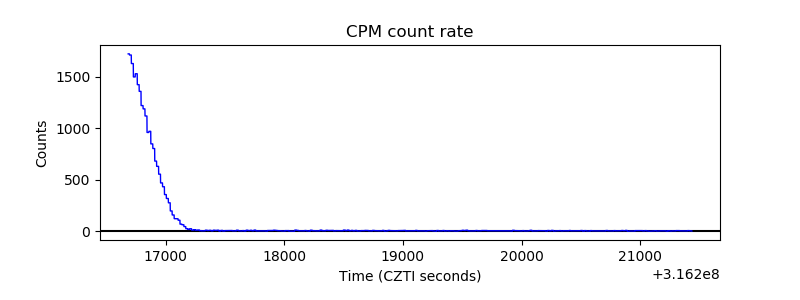 |
| CZT Counter | 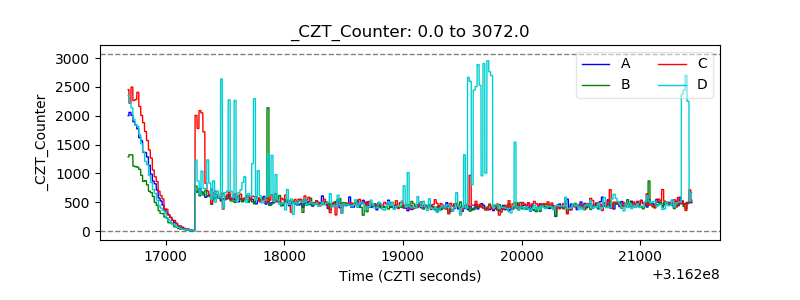 |
| +2.5 Volts monitor |  |
| +5 Volts monitor |  |
| _ROLL_ROT |  |
| _Roll_DEC | 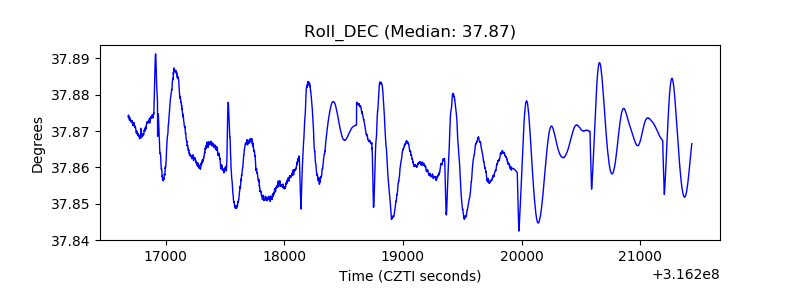 |
| _Roll_RA | 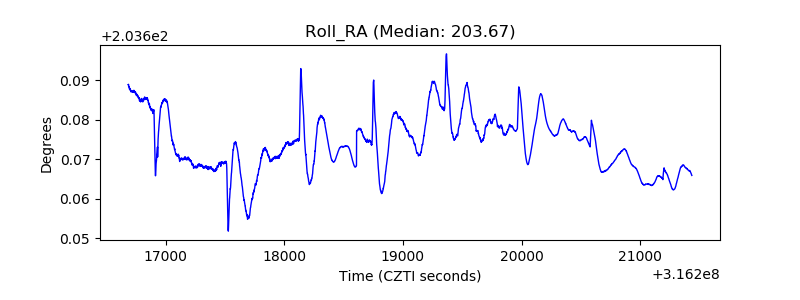 |
| Veto Counter | 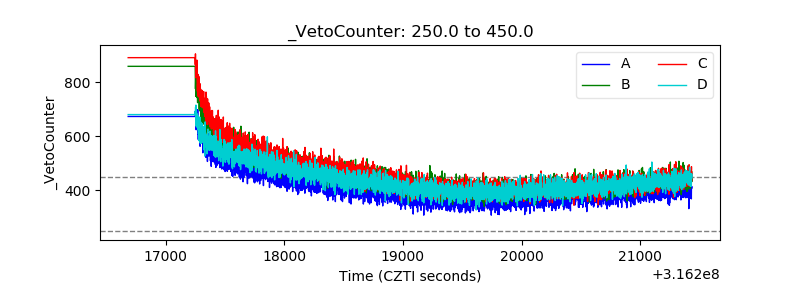 |