| Param | Original file | Final file |
|---|---|---|
| Filename | modeM0/AS1T03_175T01_9000003420cztM0_level2.fits | modeM0/AS1T03_175T01_9000003420cztM0_level2_quad_clean.evt |
| Size (bytes) | 26,009,280 | 20,511,360 |
| Size | 24.8 MB | 19.6 MB |
| Events in quadrant A | 158,112 | 111,593 |
| Events in quadrant B | 154,684 | 114,212 |
| Events in quadrant C | 155,608 | 109,976 |
| Events in quadrant D | 135,592 | 100,499 |
| Mode M9 | |||
|---|---|---|---|
| Quadrant | BADHDUFLAG | Total packets | Discarded packets |
| A | 0 | 11 | 0 |
| B | 0 | 11 | 0 |
| C | 0 | 11 | 0 |
| D | 0 | 11 | 0 |
| Mode M0 | |||
|---|---|---|---|
| Quadrant | BADHDUFLAG | Total packets | Discarded packets |
| A | 0 | 5515 | 0 |
| B | 0 | 5686 | 0 |
| C | 0 | 5960 | 0 |
| D | 0 | 6433 | 0 |
| Mode SS | |||
|---|---|---|---|
| Quadrant | BADHDUFLAG | Total packets | Discarded packets |
| A | 0 | 54 | 0 |
| B | 0 | 54 | 0 |
| C | 0 | 54 | 0 |
| D | 0 | 54 | 0 |
| Quadrant | Total seconds | Saturated seconds | Saturation percentage |
|---|---|---|---|
| A | 2561 | 41 | 1.600937% |
| B | 2561 | 70 | 2.733307% |
| C | 2561 | 130 | 5.076142% |
| D | 2561 | 81 | 3.162827% |
Noise dominated data is calculated using 1-second bins in cleaned event files. If a bin has >2000 counts, and if more than 50% of those come from <1% of pixels, then it is considered to be noise-dominated and hence unusable.
| Quadrant | # 1 sec bins | Bins with >0 counts | Bins with >2000 counts | High rate bins dominated by noise | Noise dominated (total time) | Noise dominated (detector-on time) | Marked lightcurve |
|---|---|---|---|---|---|---|---|
| A | 3656 | 2560 | 0 | 0 | 0.00% | 0.00% |  |
| B | 3656 | 2560 | 0 | 0 | 0.00% | 0.00% | 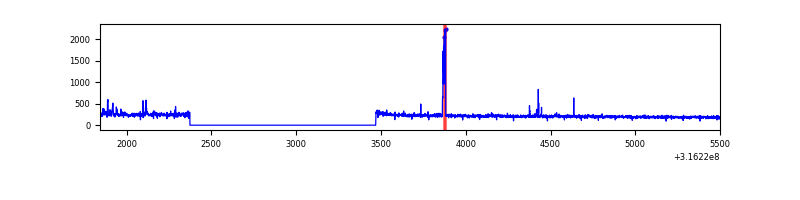 |
| C | 3656 | 2561 | 0 | 0 | 0.00% | 0.00% |  |
| D | 3656 | 2561 | 0 | 0 | 0.00% | 0.00% |  |
Top three noisy pixels from each quadrant. If the there are fewer than three noisy pixels in the level2.evt file, extra rows are filled as -1
| Pixel properties | Quadrant properties | ||||||
|---|---|---|---|---|---|---|---|
| Quadrant | DetID | PixID | Counts | Sigma | Mean | Median | Sigma |
| A | 0 | 29 | 172 | 10.81 | 41 | 39 | 12.3 |
| A | 0 | 30 | 132 | 7.56 | 41 | 39 | 12.3 |
| A | 11 | 159 | 125 | 6.99 | 41 | 39 | 12.3 |
| B | 2 | 9 | 136 | 9.45 | 40 | 39 | 10.3 |
| B | 3 | 80 | 118 | 7.7 | 40 | 39 | 10.3 |
| B | 14 | 254 | 107 | 6.62 | 40 | 39 | 10.3 |
| C | 12 | 250 | 123 | 6.83 | 41 | 39 | 12.3 |
| C | 12 | 249 | 121 | 6.67 | 41 | 39 | 12.3 |
| C | 9 | 242 | 113 | 6.02 | 41 | 39 | 12.3 |
| D | 4 | 246 | 114 | 6.69 | 38 | 35 | 11.8 |
| D | 4 | 160 | 109 | 6.26 | 38 | 35 | 11.8 |
| D | 13 | 238 | 101 | 5.59 | 38 | 35 | 11.8 |
Histogram calculated using DETX and DETY for each event in the final _common_clean file
| Quadrant A |  |
 |
Quadrant B |
|---|---|---|---|
| Quadrant D |  |
 |
Quadrant C |
| Plot type | Count rate plots | Images |
|---|---|---|
| Comparison with Poisson distribution Blue bars denote a histogram of data divided into 1 sec bins. Red curve is a Poisson curve with rate = median count rate of data. |
 |
 |
| Quadrant-wise count rates Data is divided into 100 sec bins |
 |
|
| Module-wise count rates for Quadrant A Data is divided into 100 sec bins |
 |
 |
| Module-wise count rates for Quadrant B Data is divided into 100 sec bins |
 |
 |
| Module-wise count rates for Quadrant C Data is divided into 100 sec bins |
 |
 |
| Module-wise count rates for Quadrant D Data is divided into 100 sec bins |
 |
 |
| Parameter | Plot |
|---|---|
| CZT HV Monitor |  |
| D_VDD | 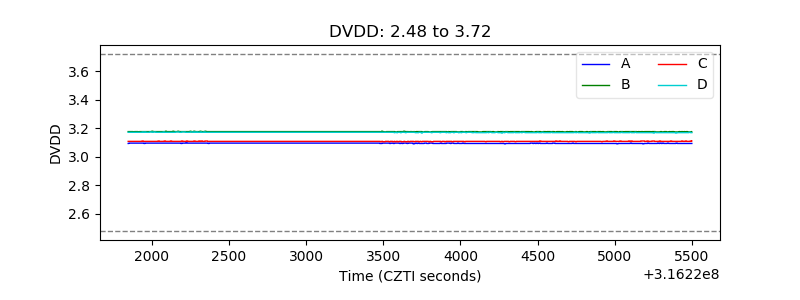 |
| Temperature 1 |  |
| Veto HV Monitor |  |
| Veto LLD |  |
| Alpha Counter |  |
| _CPM_Rate |  |
| CZT Counter |  |
| +2.5 Volts monitor |  |
| +5 Volts monitor |  |
| _ROLL_ROT |  |
| _Roll_DEC |  |
| _Roll_RA |  |
| Veto Counter |  |