| Param | Original file | Final file |
|---|---|---|
| Filename | modeM0/AS1T03_175T01_9000003420_23148cztM0_level2.evt | modeM0/AS1T03_175T01_9000003420_23148cztM0_level2_quad_clean.evt |
| Size (bytes) | 143,130,240 | 36,051,840 |
| Size | 136.5 MB | 34.4 MB |
| Events in quadrant A | 943,199 | 235,723 |
| Events in quadrant B | 1,001,240 | 242,948 |
| Events in quadrant C | 1,114,773 | 236,202 |
| Events in quadrant D | 1,134,583 | 228,742 |
| Mode M9 | |||
|---|---|---|---|
| Quadrant | BADHDUFLAG | Total packets | Discarded packets |
| A | 0 | 9 | 0 |
| B | 0 | 10 | 0 |
| C | 0 | 10 | 0 |
| D | 0 | 10 | 0 |
| Mode M0 | |||
|---|---|---|---|
| Quadrant | BADHDUFLAG | Total packets | Discarded packets |
| A | 0 | 4180 | 1 |
| B | 0 | 4294 | 1 |
| C | 0 | 4589 | 1 |
| D | 0 | 4785 | 1 |
| Mode SS | |||
|---|---|---|---|
| Quadrant | BADHDUFLAG | Total packets | Discarded packets |
| A | 0 | 42 | 0 |
| B | 0 | 42 | 0 |
| C | 0 | 42 | 0 |
| D | 0 | 42 | 0 |
| Quadrant | Total seconds | Saturated seconds | Saturation percentage |
|---|---|---|---|
| A | 2030 | 5 | 0.246305% |
| B | 2030 | 19 | 0.935961% |
| C | 2030 | 84 | 4.137931% |
| D | 2030 | 31 | 1.527094% |
Noise dominated data is calculated using 1-second bins in cleaned event files. If a bin has >2000 counts, and if more than 50% of those come from <1% of pixels, then it is considered to be noise-dominated and hence unusable.
| Quadrant | # 1 sec bins | Bins with >0 counts | Bins with >2000 counts | High rate bins dominated by noise | Noise dominated (total time) | Noise dominated (detector-on time) | Marked lightcurve |
|---|---|---|---|---|---|---|---|
| A | 2030 | 2030 | 0 | 0 | 0.00% | 0.00% | 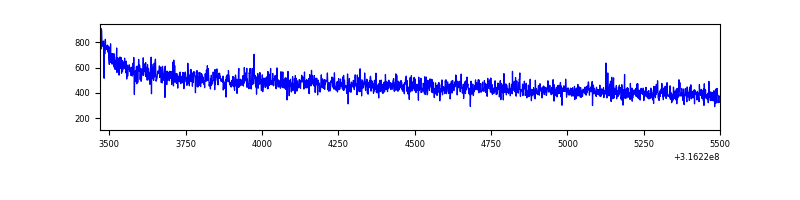 |
| B | 2030 | 2030 | 10 | 10 | 0.49% | 0.49% | 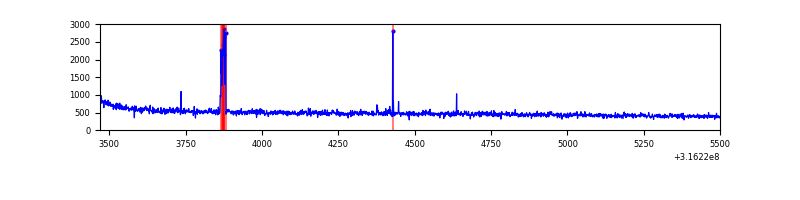 |
| C | 2030 | 2030 | 54 | 54 | 2.66% | 2.66% | 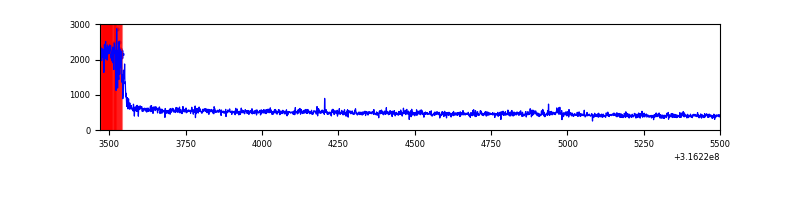 |
| D | 2030 | 2030 | 26 | 26 | 1.28% | 1.28% | 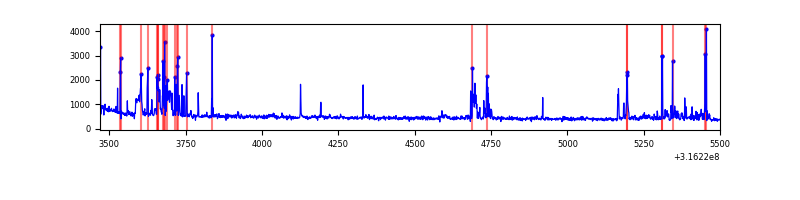 |
Top three noisy pixels from each quadrant. If the there are fewer than three noisy pixels in the level2.evt file, extra rows are filled as -1
| Pixel properties | Quadrant properties | ||||||
|---|---|---|---|---|---|---|---|
| Quadrant | DetID | PixID | Counts | Sigma | Mean | Median | Sigma |
| A | 6 | 16 | 3134 | 56.76 | 243 | 237 | 51.0 |
| A | 13 | 254 | 2950 | 53.16 | 243 | 237 | 51.0 |
| A | 0 | 226 | 2162 | 37.72 | 243 | 237 | 51.0 |
| B | 10 | 247 | 30989 | 624.53 | 247 | 240 | 49.2 |
| B | 12 | 111 | 5889 | 114.74 | 247 | 240 | 49.2 |
| B | 11 | 111 | 5061 | 97.92 | 247 | 240 | 49.2 |
| C | 0 | 10 | 159816 | 2838.77 | 232 | 234 | 56.2 |
| C | 14 | 238 | 36570 | 646.37 | 232 | 234 | 56.2 |
| C | 7 | 247 | 6898 | 118.54 | 232 | 234 | 56.2 |
| D | 1 | 52 | 125347 | 2100.94 | 236 | 229 | 59.6 |
| D | 6 | 112 | 40247 | 671.97 | 236 | 229 | 59.6 |
| D | 7 | 238 | 28375 | 472.62 | 236 | 229 | 59.6 |
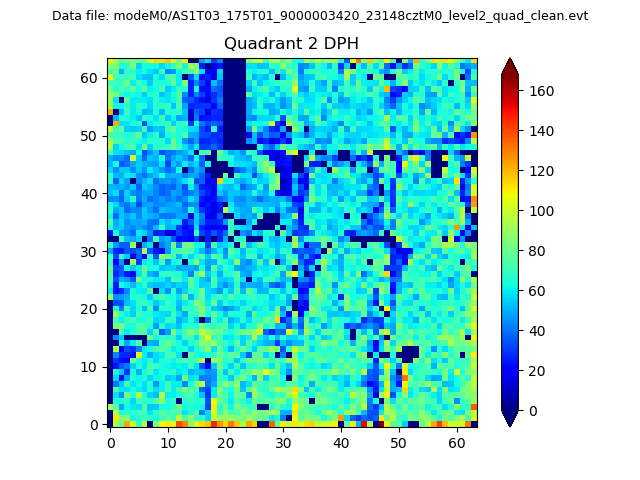
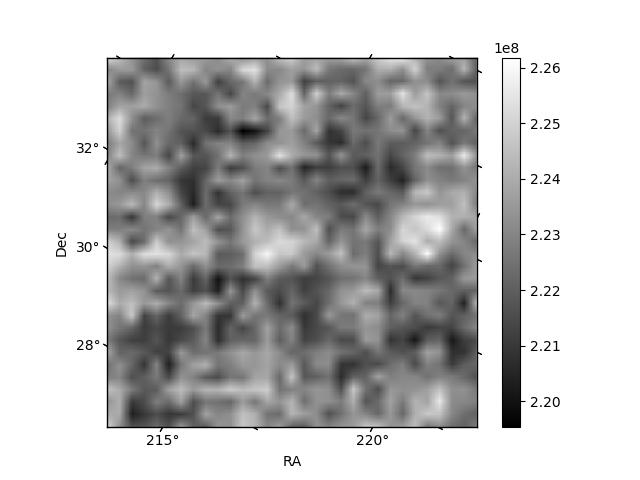
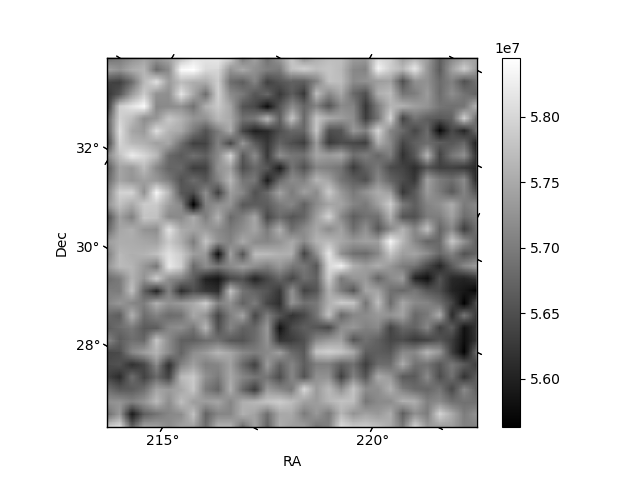
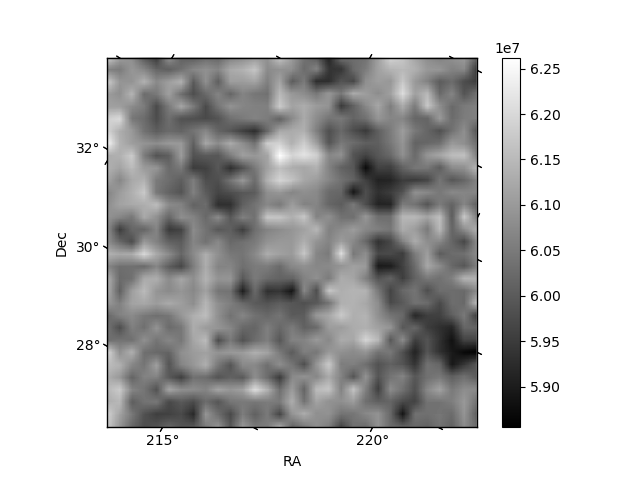
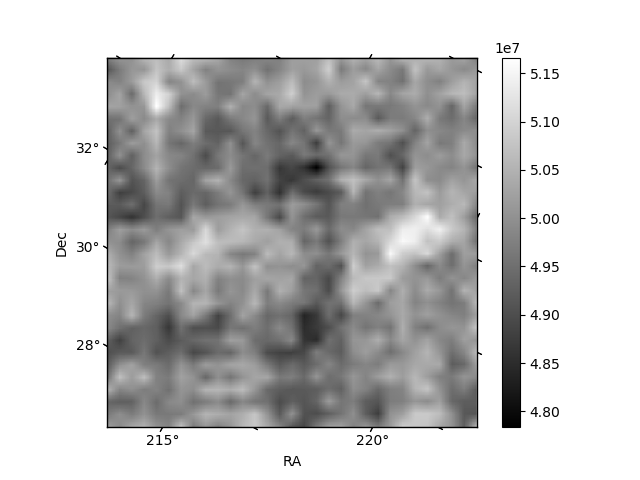
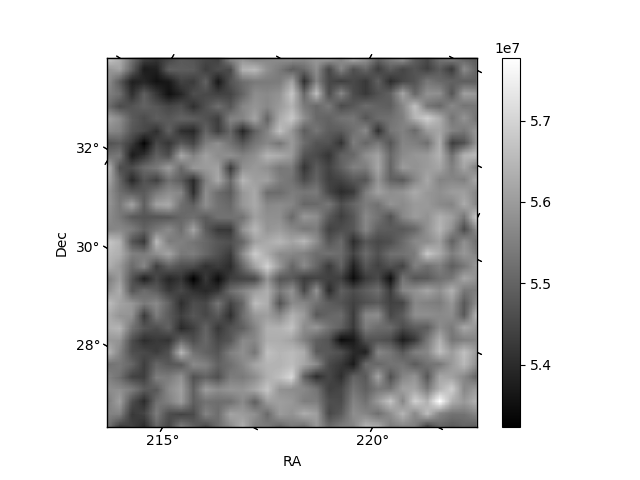
Histogram calculated using DETX and DETY for each event in the final _common_clean file
| Quadrant A | 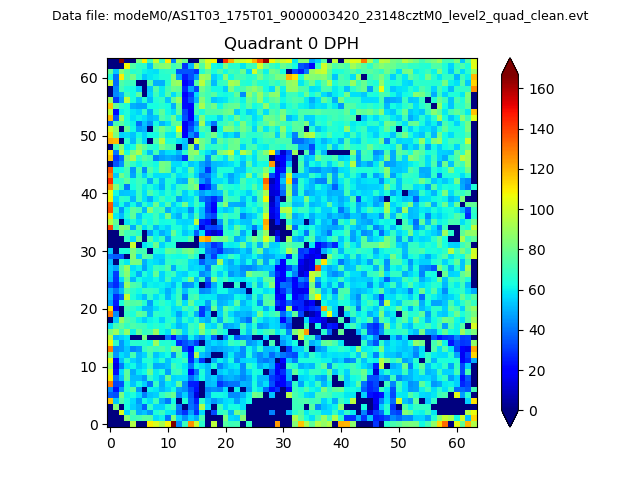 |
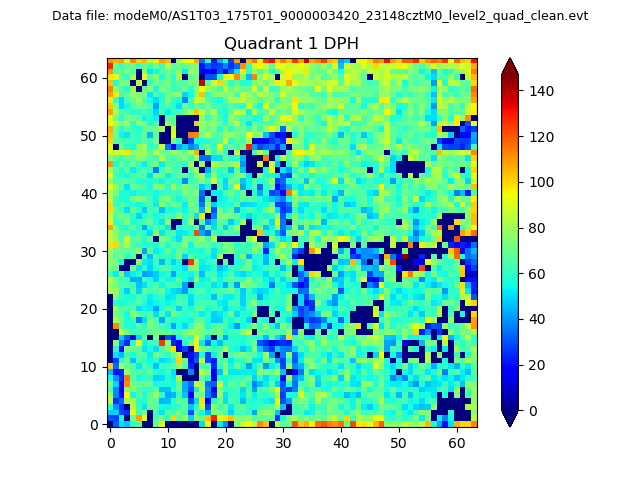 |
Quadrant B |
|---|---|---|---|
| Quadrant D | 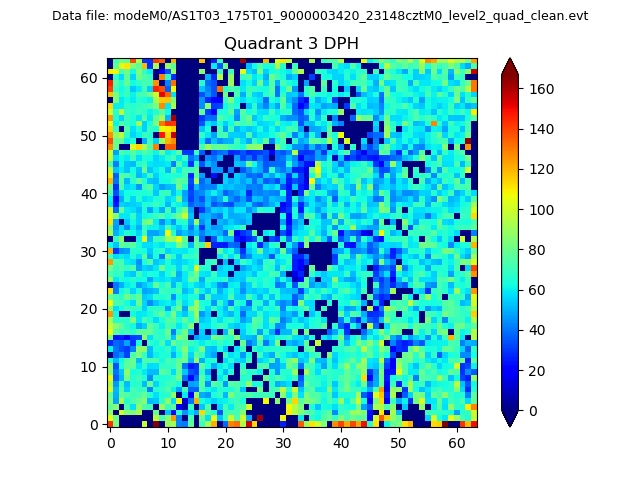 |
 |
Quadrant C |
| Plot type | Count rate plots | Images |
|---|---|---|
| Comparison with Poisson distribution Blue bars denote a histogram of data divided into 1 sec bins. Red curve is a Poisson curve with rate = median count rate of data. |
 |
 |
| Quadrant-wise count rates Data is divided into 100 sec bins |
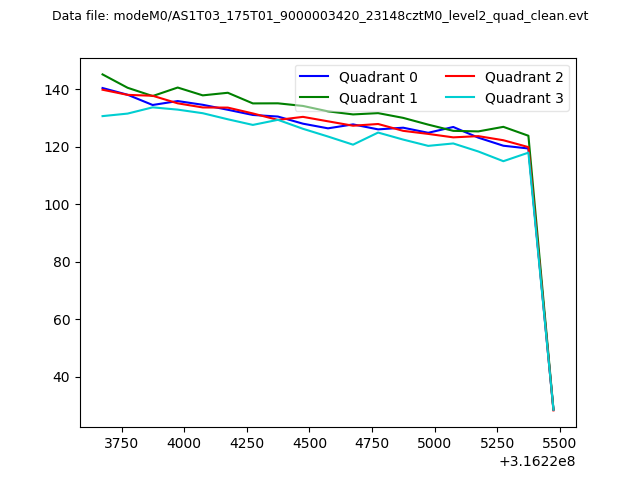 |
|
| Module-wise count rates for Quadrant A Data is divided into 100 sec bins |
 |
 |
| Module-wise count rates for Quadrant B Data is divided into 100 sec bins |
 |
 |
| Module-wise count rates for Quadrant C Data is divided into 100 sec bins |
 |
 |
| Module-wise count rates for Quadrant D Data is divided into 100 sec bins |
 |
 |
| Parameter | Plot |
|---|---|
| CZT HV Monitor |  |
| D_VDD | 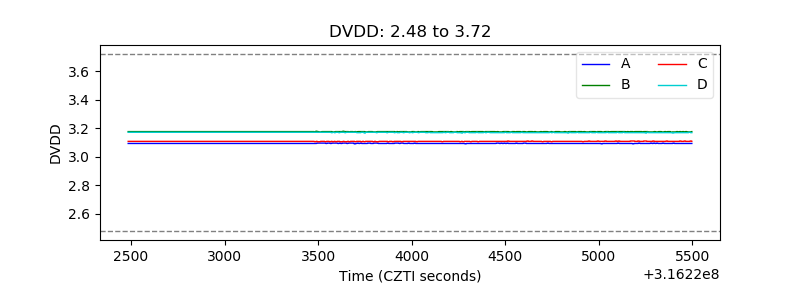 |
| Temperature 1 | 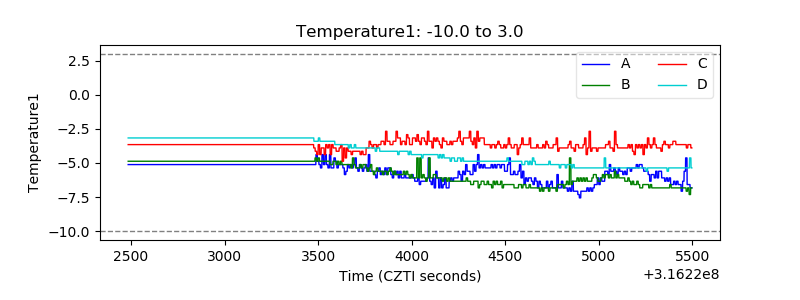 |
| Veto HV Monitor | 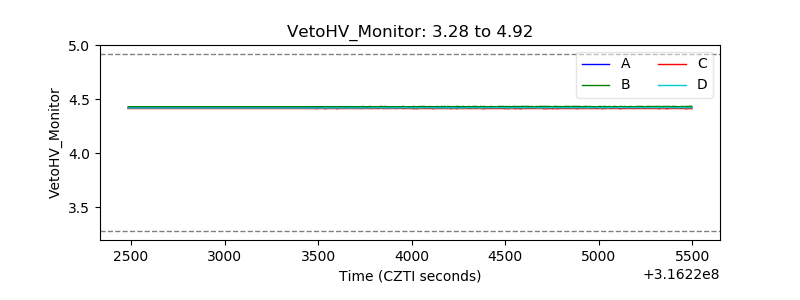 |
| Veto LLD | 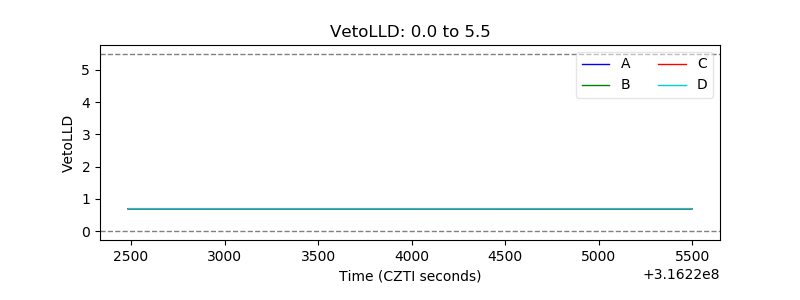 |
| Alpha Counter | 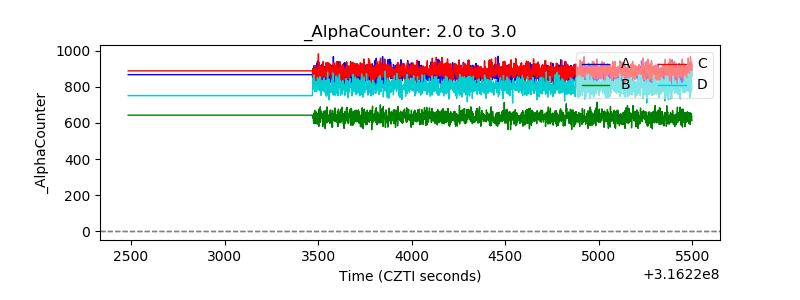 |
| _CPM_Rate | 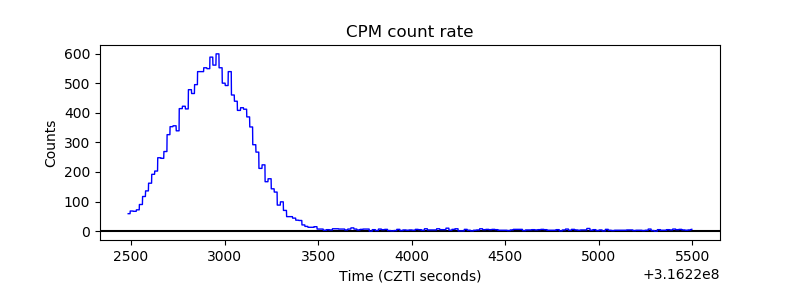 |
| CZT Counter | 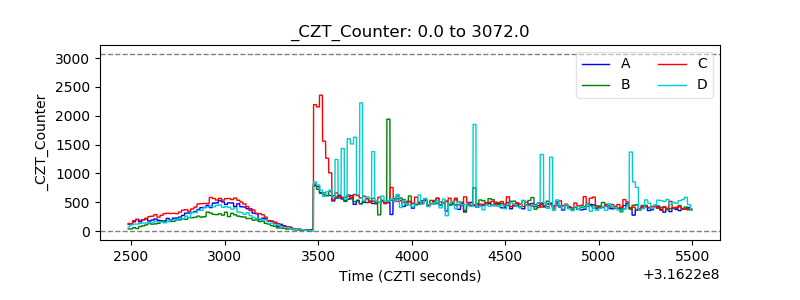 |
| +2.5 Volts monitor |  |
| +5 Volts monitor |  |
| _ROLL_ROT | 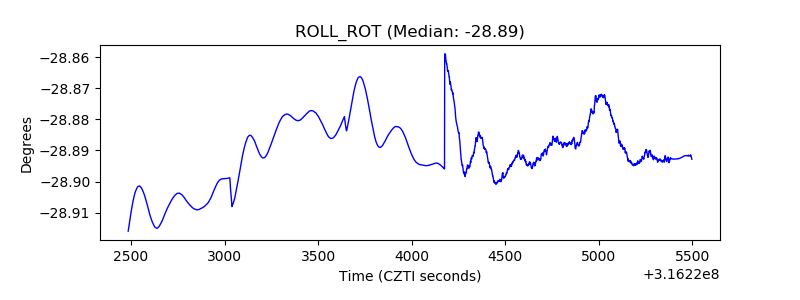 |
| _Roll_DEC |  |
| _Roll_RA | 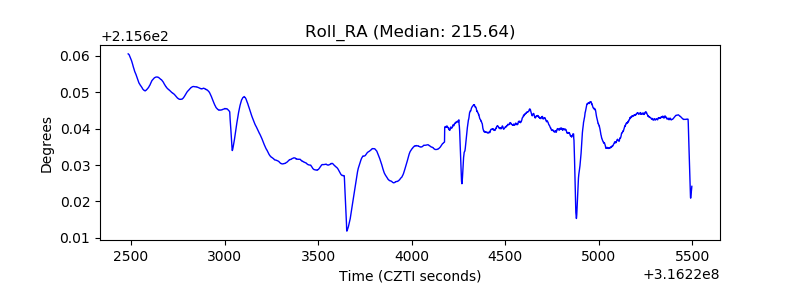 |
| Veto Counter |  |