| Param | Original file | Final file |
|---|---|---|
| Filename | modeM0/AS1A08_009T01_9000003422cztM0_level2.fits | modeM0/AS1A08_009T01_9000003422cztM0_level2_quad_clean.evt |
| Size (bytes) | 932,328,000 | 939,314,880 |
| Size | 889.1 MB | 895.8 MB |
| Events in quadrant A | 5,712,194 | 5,698,259 |
| Events in quadrant B | 5,520,018 | 5,777,395 |
| Events in quadrant C | 5,634,610 | 5,535,953 |
| Events in quadrant D | 4,795,830 | 4,865,694 |
| Mode M0 | |||
|---|---|---|---|
| Quadrant | BADHDUFLAG | Total packets | Discarded packets |
| A | 0 | 198695 | 0 |
| B | 0 | 200647 | 0 |
| C | 0 | 208367 | 0 |
| D | 0 | 255016 | 0 |
| Mode SS | |||
|---|---|---|---|
| Quadrant | BADHDUFLAG | Total packets | Discarded packets |
| A | 0 | 1946 | 0 |
| B | 0 | 1948 | 0 |
| C | 0 | 1946 | 0 |
| D | 0 | 1946 | 0 |
| Mode M9 | |||
|---|---|---|---|
| Quadrant | BADHDUFLAG | Total packets | Discarded packets |
| A | 0 | 133 | 0 |
| B | 0 | 133 | 0 |
| C | 0 | 133 | 0 |
| D | 0 | 133 | 0 |
| Quadrant | Total seconds | Saturated seconds | Saturation percentage |
|---|---|---|---|
| A | 95880 | 896 | 0.934501% |
| B | 95888 | 1089 | 1.135700% |
| C | 95881 | 2044 | 2.131809% |
| D | 95886 | 5650 | 5.892414% |
Noise dominated data is calculated using 1-second bins in cleaned event files. If a bin has >2000 counts, and if more than 50% of those come from <1% of pixels, then it is considered to be noise-dominated and hence unusable.
| Quadrant | # 1 sec bins | Bins with >0 counts | Bins with >2000 counts | High rate bins dominated by noise | Noise dominated (total time) | Noise dominated (detector-on time) | Marked lightcurve |
|---|---|---|---|---|---|---|---|
| A | 108997 | 95887 | 0 | 0 | 0.00% | 0.00% |  |
| B | 108997 | 95888 | 0 | 0 | 0.00% | 0.00% |  |
| C | 108997 | 95887 | 0 | 0 | 0.00% | 0.00% |  |
| D | 108997 | 95774 | 0 | 0 | 0.00% | 0.00% |  |
Top three noisy pixels from each quadrant. If the there are fewer than three noisy pixels in the level2.evt file, extra rows are filled as -1
| Pixel properties | Quadrant properties | ||||||
|---|---|---|---|---|---|---|---|
| Quadrant | DetID | PixID | Counts | Sigma | Mean | Median | Sigma |
| A | 0 | 29 | 5440 | 10.88 | 1489 | 1399 | 371.6 |
| A | 7 | 110 | 4615 | 8.66 | 1489 | 1399 | 371.6 |
| A | 0 | 30 | 4278 | 7.75 | 1489 | 1399 | 371.6 |
| B | 2 | 9 | 4447 | 10.84 | 1459 | 1395 | 281.6 |
| B | 2 | 8 | 3689 | 8.15 | 1459 | 1395 | 281.6 |
| B | 5 | 128 | 3664 | 8.06 | 1459 | 1395 | 281.6 |
| C | 12 | 241 | 3973 | 6.88 | 1490 | 1398 | 374.3 |
| C | 9 | 209 | 3765 | 6.32 | 1490 | 1398 | 374.3 |
| C | 3 | 187 | 3764 | 6.32 | 1490 | 1398 | 374.3 |
| D | 3 | 14 | 3684 | 6.59 | 1372 | 1247 | 370.0 |
| D | 15 | 46 | 3421 | 5.88 | 1372 | 1247 | 370.0 |
| D | 10 | 189 | 3399 | 5.82 | 1372 | 1247 | 370.0 |
Histogram calculated using DETX and DETY for each event in the final _common_clean file
| Quadrant A |  |
 |
Quadrant B |
|---|---|---|---|
| Quadrant D | 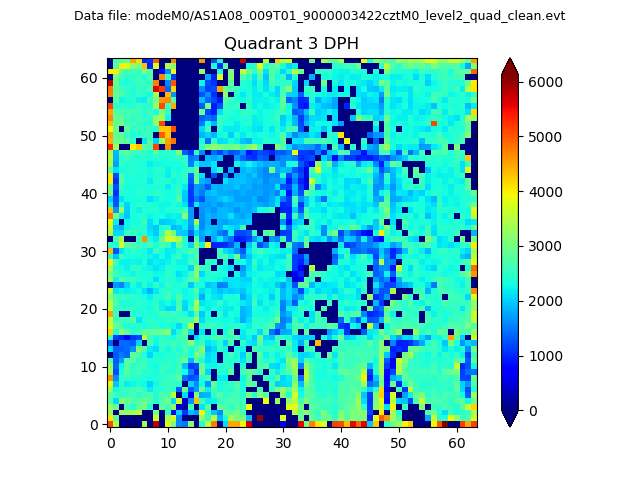 |
 |
Quadrant C |
| Plot type | Count rate plots | Images |
|---|---|---|
| Comparison with Poisson distribution Blue bars denote a histogram of data divided into 1 sec bins. Red curve is a Poisson curve with rate = median count rate of data. |
 |
 |
| Quadrant-wise count rates Data is divided into 100 sec bins |
 |
|
| Module-wise count rates for Quadrant A Data is divided into 100 sec bins |
 |
 |
| Module-wise count rates for Quadrant B Data is divided into 100 sec bins |
 |
 |
| Module-wise count rates for Quadrant C Data is divided into 100 sec bins |
 |
 |
| Module-wise count rates for Quadrant D Data is divided into 100 sec bins |
 |
 |
| Parameter | Plot |
|---|---|
| CZT HV Monitor |  |
| D_VDD |  |
| Temperature 1 |  |
| Veto HV Monitor |  |
| Veto LLD | 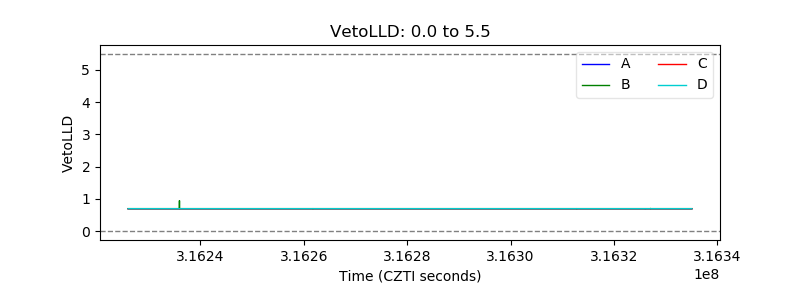 |
| Alpha Counter | 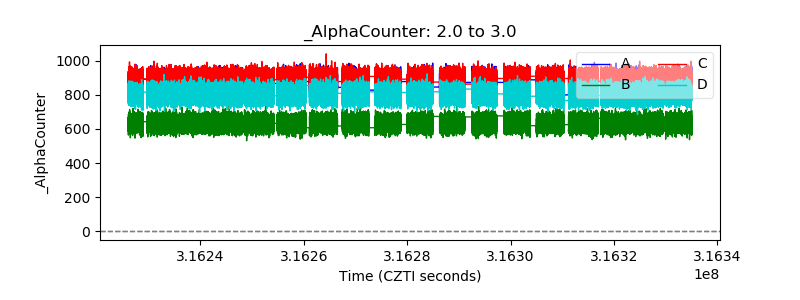 |
| _CPM_Rate |  |
| CZT Counter | 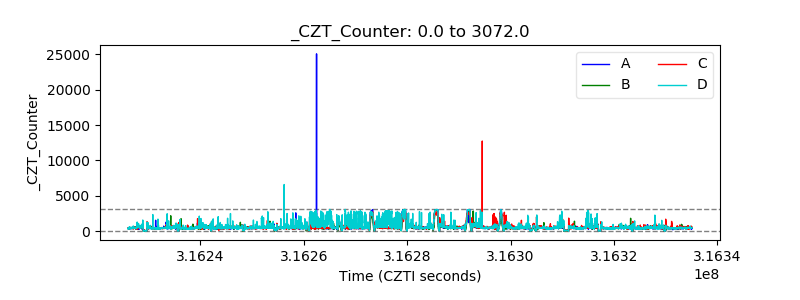 |
| +2.5 Volts monitor | 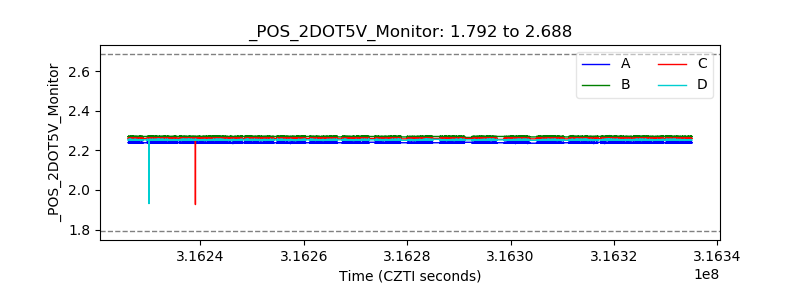 |
| +5 Volts monitor |  |
| _ROLL_ROT |  |
| _Roll_DEC |  |
| _Roll_RA | 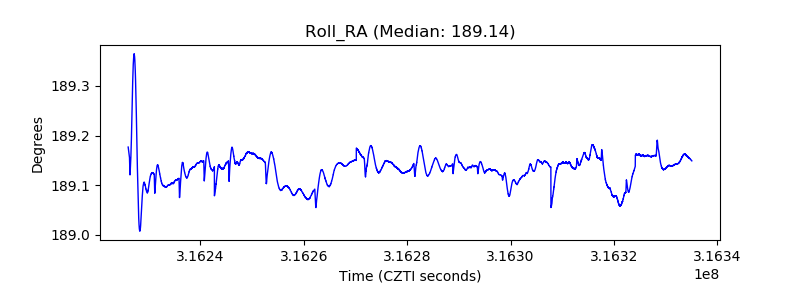 |
| Veto Counter |  |