| Param | Original file | Final file |
|---|---|---|
| Filename | modeM0/AS1A08_009T01_9000003422_23149cztM0_level2.evt | modeM0/AS1A08_009T01_9000003422_23149cztM0_level2_quad_clean.evt |
| Size (bytes) | 499,224,960 | 116,328,960 |
| Size | 476.1 MB | 110.9 MB |
| Events in quadrant A | 3,589,587 | 750,971 |
| Events in quadrant B | 3,612,443 | 772,535 |
| Events in quadrant C | 3,680,174 | 744,214 |
| Events in quadrant D | 3,720,591 | 726,945 |
| Mode M0 | |||
|---|---|---|---|
| Quadrant | BADHDUFLAG | Total packets | Discarded packets |
| A | 0 | 15941 | 58 |
| B | 0 | 15960 | 64 |
| C | 0 | 16056 | 62 |
| D | 0 | 16645 | 66 |
| Mode SS | |||
|---|---|---|---|
| Quadrant | BADHDUFLAG | Total packets | Discarded packets |
| A | 0 | 158 | 0 |
| B | 0 | 158 | 0 |
| C | 0 | 158 | 0 |
| D | 0 | 158 | 0 |
| Mode M9 | |||
|---|---|---|---|
| Quadrant | BADHDUFLAG | Total packets | Discarded packets |
| A | 0 | 10 | 0 |
| B | 0 | 10 | 0 |
| C | 0 | 10 | 0 |
| D | 0 | 10 | 0 |
| Quadrant | Total seconds | Saturated seconds | Saturation percentage |
|---|---|---|---|
| A | 7594 | 38 | 0.500395% |
| B | 7592 | 68 | 0.895680% |
| C | 7593 | 121 | 1.593573% |
| D | 7592 | 62 | 0.816649% |
Noise dominated data is calculated using 1-second bins in cleaned event files. If a bin has >2000 counts, and if more than 50% of those come from <1% of pixels, then it is considered to be noise-dominated and hence unusable.
| Quadrant | # 1 sec bins | Bins with >0 counts | Bins with >2000 counts | High rate bins dominated by noise | Noise dominated (total time) | Noise dominated (detector-on time) | Marked lightcurve |
|---|---|---|---|---|---|---|---|
| A | 8663 | 7601 | 3 | 3 | 0.03% | 0.04% | 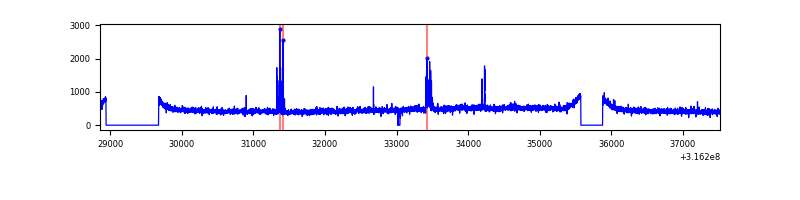 |
| B | 8664 | 7599 | 1 | 1 | 0.01% | 0.01% | 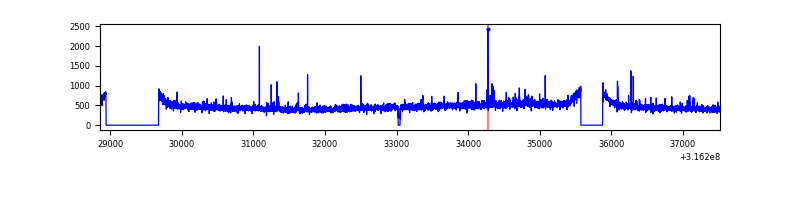 |
| C | 8664 | 7599 | 3 | 3 | 0.03% | 0.04% | 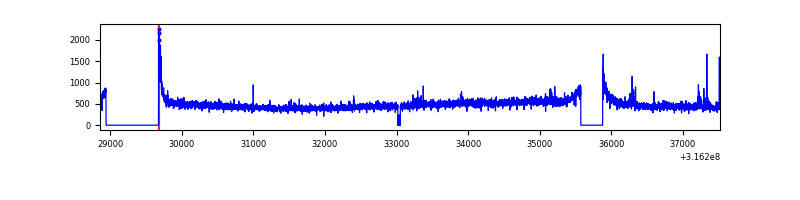 |
| D | 8664 | 7596 | 30 | 30 | 0.35% | 0.39% | 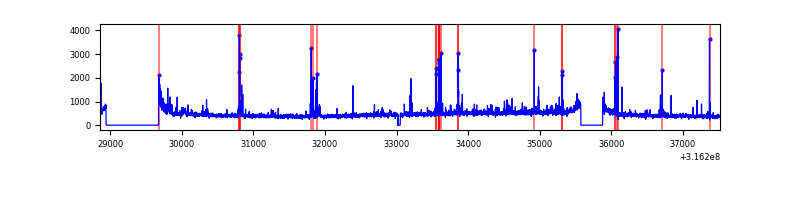 |
Top three noisy pixels from each quadrant. If the there are fewer than three noisy pixels in the level2.evt file, extra rows are filled as -1
| Pixel properties | Quadrant properties | ||||||
|---|---|---|---|---|---|---|---|
| Quadrant | DetID | PixID | Counts | Sigma | Mean | Median | Sigma |
| A | 6 | 16 | 125635 | 694.65 | 898 | 880 | 179.6 |
| A | 13 | 254 | 11521 | 59.25 | 898 | 880 | 179.6 |
| A | 3 | 137 | 8106 | 40.24 | 898 | 880 | 179.6 |
| B | 14 | 207 | 22994 | 127.17 | 903 | 881 | 173.9 |
| B | 12 | 111 | 21371 | 117.84 | 903 | 881 | 173.9 |
| B | 4 | 173 | 19914 | 109.46 | 903 | 881 | 173.9 |
| C | 14 | 238 | 135832 | 668.07 | 868 | 872 | 202.0 |
| C | 0 | 10 | 92907 | 455.59 | 868 | 872 | 202.0 |
| C | 3 | 233 | 22776 | 108.43 | 868 | 872 | 202.0 |
| D | 7 | 238 | 140612 | 656.53 | 872 | 844 | 212.9 |
| D | 13 | 153 | 79320 | 368.63 | 872 | 844 | 212.9 |
| D | 1 | 52 | 78391 | 364.26 | 872 | 844 | 212.9 |
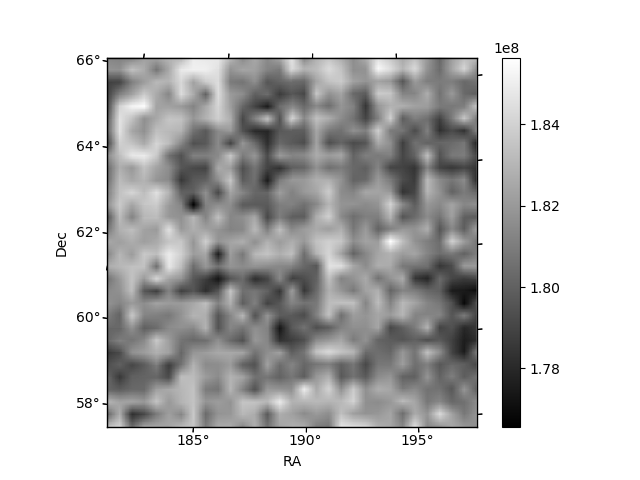
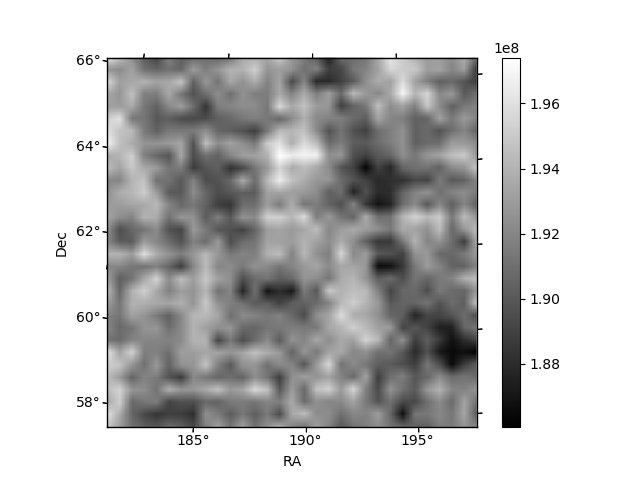
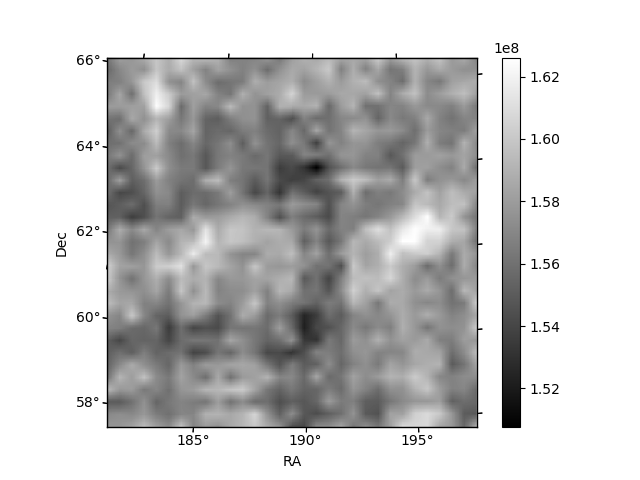
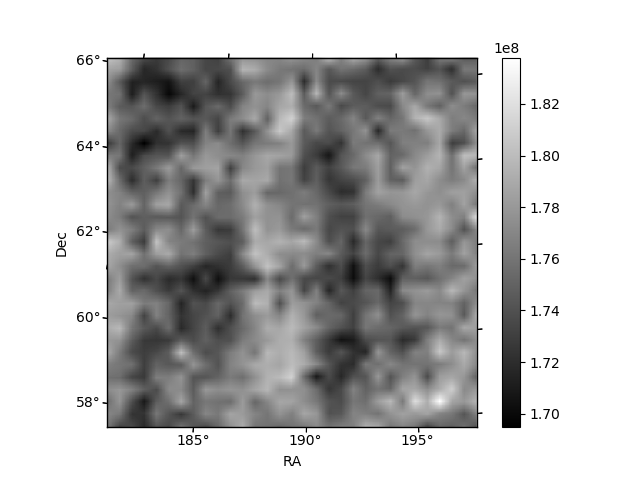
Histogram calculated using DETX and DETY for each event in the final _common_clean file
| Quadrant A |  |
 |
Quadrant B |
|---|---|---|---|
| Quadrant D |  |
 |
Quadrant C |
| Plot type | Count rate plots | Images |
|---|---|---|
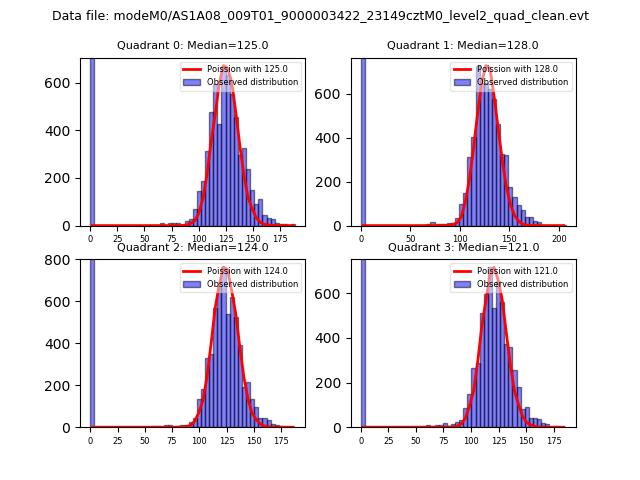
| Comparison with Poisson distribution Blue bars denote a histogram of data divided into 1 sec bins. Red curve is a Poisson curve with rate = median count rate of data. |
 |
 |
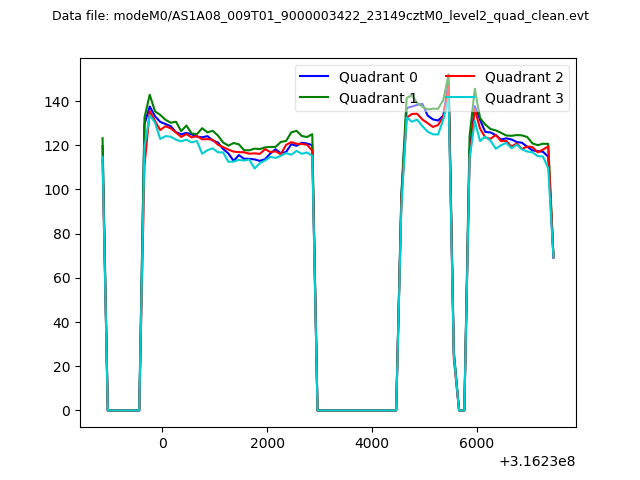
| Quadrant-wise count rates Data is divided into 100 sec bins |
 |
|
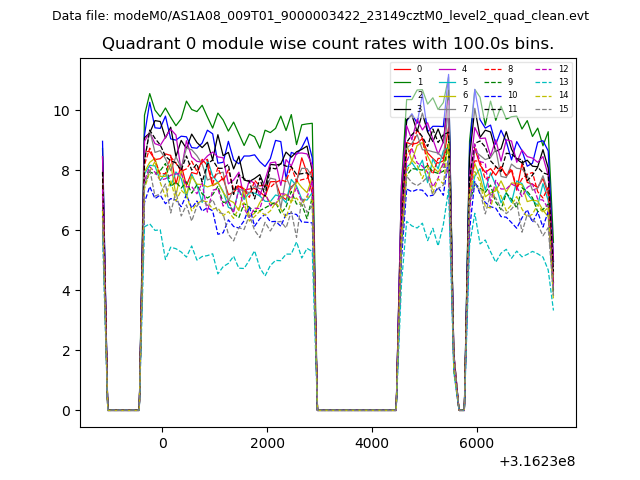
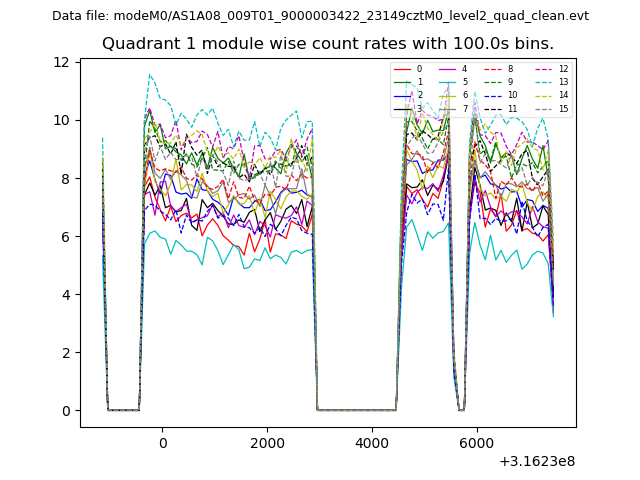
| Module-wise count rates for Quadrant A Data is divided into 100 sec bins |
 |
 |
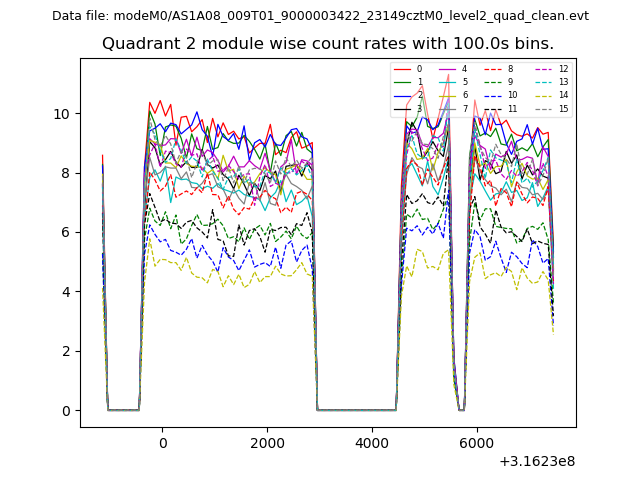
| Module-wise count rates for Quadrant B Data is divided into 100 sec bins |
 |
 |
| Module-wise count rates for Quadrant C Data is divided into 100 sec bins |
 |
 |
| Module-wise count rates for Quadrant D Data is divided into 100 sec bins |
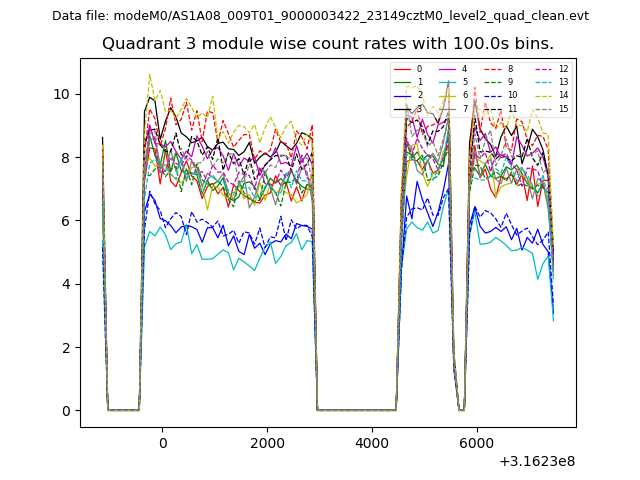 |
 |
| Parameter | Plot |
|---|---|
| CZT HV Monitor | 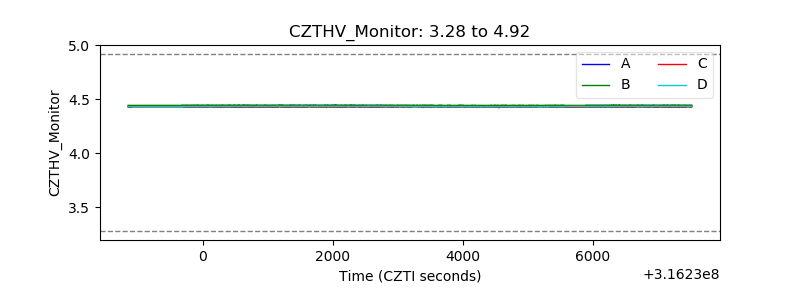 |
| D_VDD | 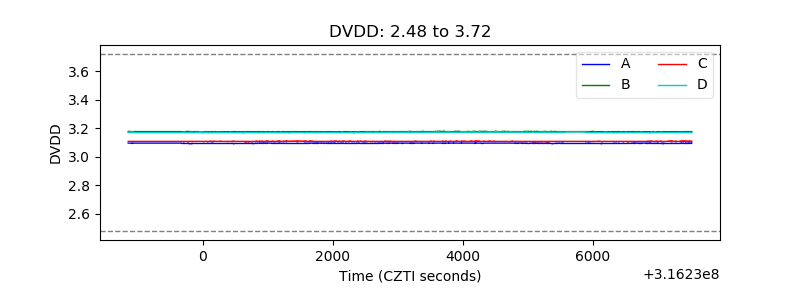 |
| Temperature 1 | 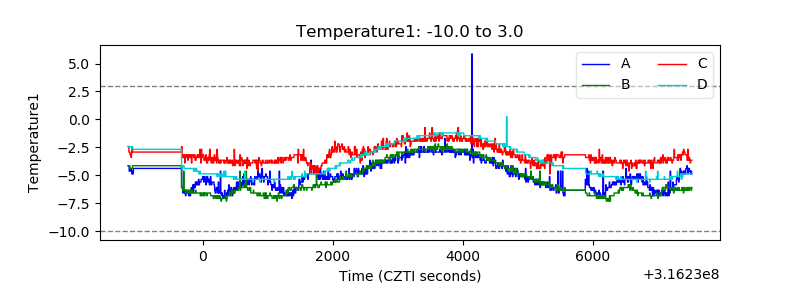 |
| Veto HV Monitor | 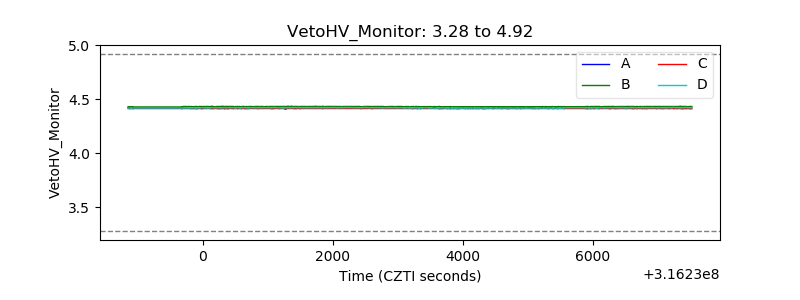 |
| Veto LLD | 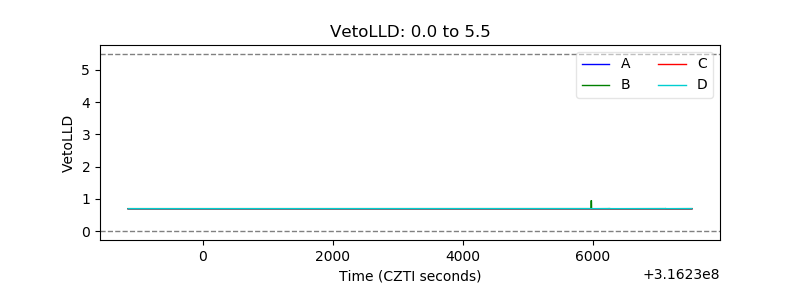 |
| Alpha Counter | 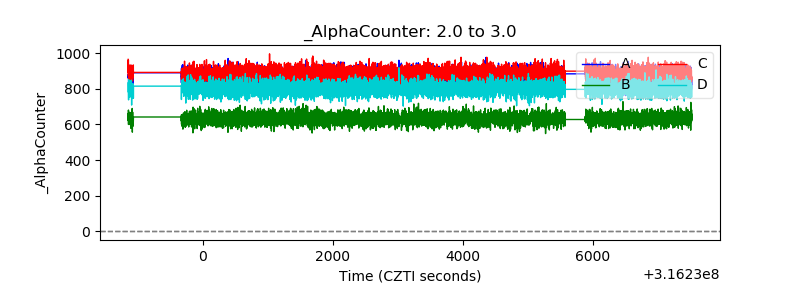 |
| _CPM_Rate | 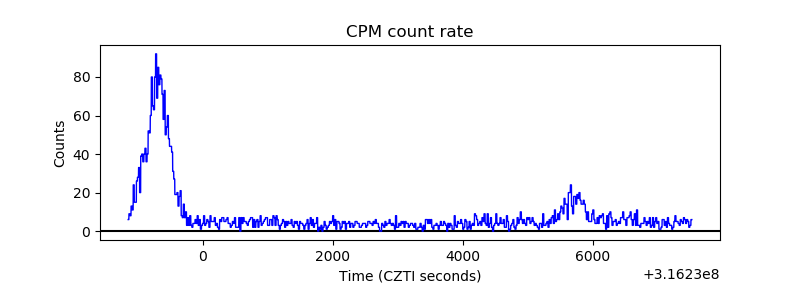 |
| CZT Counter | 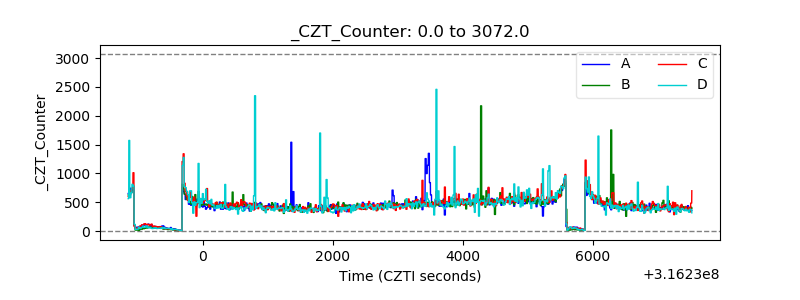 |
| +2.5 Volts monitor |  |
| +5 Volts monitor | 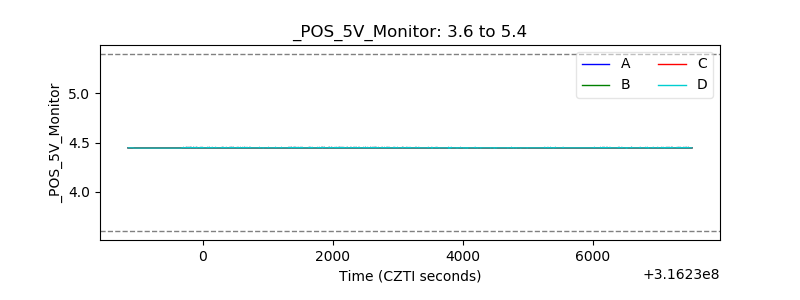 |
| _ROLL_ROT | 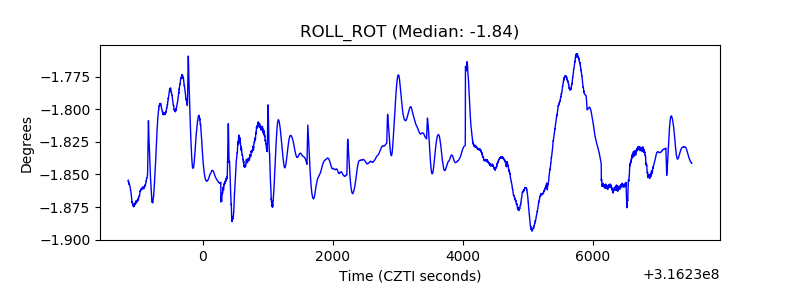 |
| _Roll_DEC | 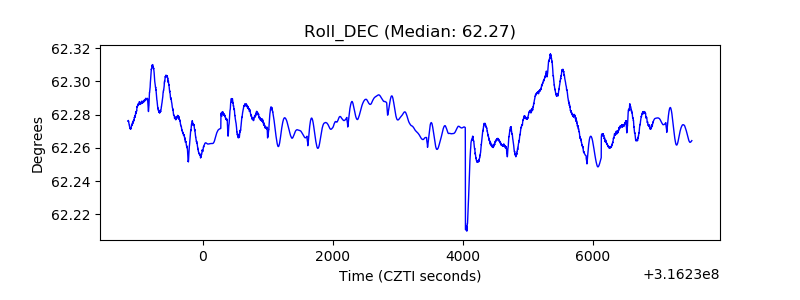 |
| _Roll_RA | 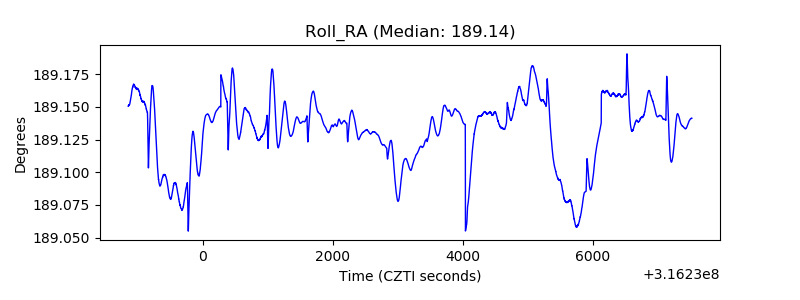 |
| Veto Counter | 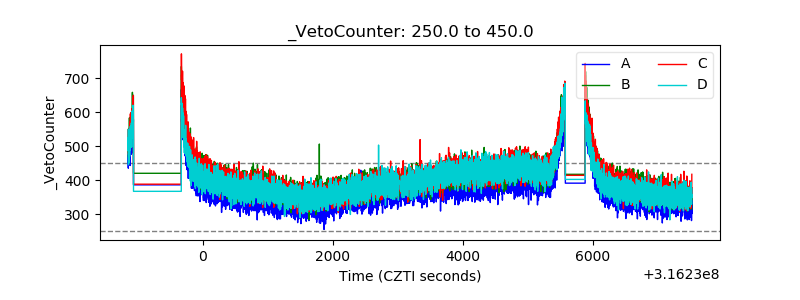 |