| Param | Original file | Final file |
|---|---|---|
| Filename | modeM0/AS1A08_009T01_9000003422_23150cztM0_level2.evt | modeM0/AS1A08_009T01_9000003422_23150cztM0_level2_quad_clean.evt |
| Size (bytes) | 486,282,240 | 109,399,680 |
| Size | 463.8 MB | 104.3 MB |
| Events in quadrant A | 3,353,923 | 701,581 |
| Events in quadrant B | 3,419,110 | 722,592 |
| Events in quadrant C | 3,627,012 | 697,725 |
| Events in quadrant D | 3,827,327 | 679,682 |
| Mode M0 | |||
|---|---|---|---|
| Quadrant | BADHDUFLAG | Total packets | Discarded packets |
| A | 0 | 15089 | 2 |
| B | 0 | 15150 | 2 |
| C | 0 | 15611 | 2 |
| D | 0 | 16757 | 2 |
| Mode SS | |||
|---|---|---|---|
| Quadrant | BADHDUFLAG | Total packets | Discarded packets |
| A | 0 | 150 | 0 |
| B | 0 | 150 | 0 |
| C | 0 | 150 | 0 |
| D | 0 | 150 | 0 |
| Quadrant | Total seconds | Saturated seconds | Saturation percentage |
|---|---|---|---|
| A | 7337 | 131 | 1.785471% |
| B | 7338 | 153 | 2.085037% |
| C | 7338 | 156 | 2.125920% |
| D | 7338 | 133 | 1.812483% |
Noise dominated data is calculated using 1-second bins in cleaned event files. If a bin has >2000 counts, and if more than 50% of those come from <1% of pixels, then it is considered to be noise-dominated and hence unusable.
| Quadrant | # 1 sec bins | Bins with >0 counts | Bins with >2000 counts | High rate bins dominated by noise | Noise dominated (total time) | Noise dominated (detector-on time) | Marked lightcurve |
|---|---|---|---|---|---|---|---|
| A | 7462 | 7339 | 2 | 2 | 0.03% | 0.03% | 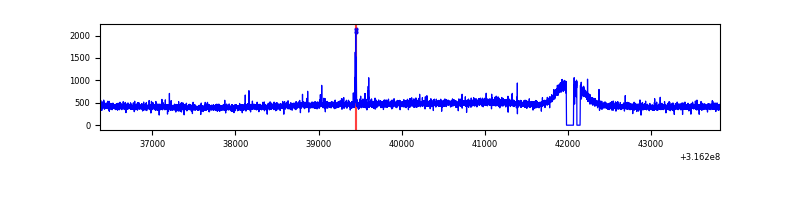 |
| B | 7463 | 7340 | 1 | 1 | 0.01% | 0.01% | 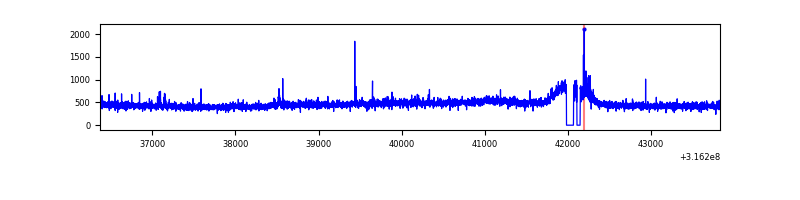 |
| C | 7463 | 7340 | 12 | 12 | 0.16% | 0.16% | 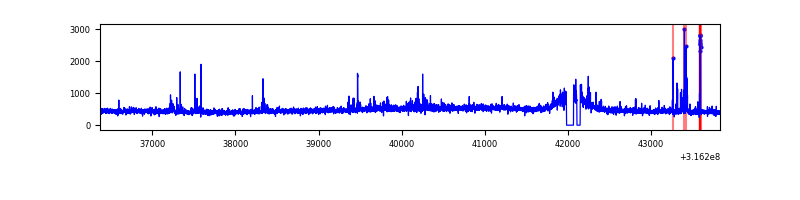 |
| D | 7463 | 7340 | 46 | 46 | 0.62% | 0.63% |  |
Top three noisy pixels from each quadrant. If the there are fewer than three noisy pixels in the level2.evt file, extra rows are filled as -1
| Pixel properties | Quadrant properties | ||||||
|---|---|---|---|---|---|---|---|
| Quadrant | DetID | PixID | Counts | Sigma | Mean | Median | Sigma |
| A | 2 | 79 | 19318 | 105.85 | 861 | 842 | 174.6 |
| A | 6 | 16 | 14733 | 79.58 | 861 | 842 | 174.6 |
| A | 13 | 254 | 8839 | 45.81 | 861 | 842 | 174.6 |
| B | 12 | 111 | 20719 | 119.83 | 860 | 835 | 165.9 |
| B | 11 | 111 | 18363 | 105.63 | 860 | 835 | 165.9 |
| B | 0 | 189 | 16910 | 96.88 | 860 | 835 | 165.9 |
| C | 9 | 15 | 195409 | 1010.28 | 824 | 826 | 192.6 |
| C | 14 | 238 | 130331 | 672.4 | 824 | 826 | 192.6 |
| C | 0 | 10 | 71277 | 365.78 | 824 | 826 | 192.6 |
| D | 1 | 52 | 367013 | 1793.54 | 834 | 808 | 204.2 |
| D | 13 | 249 | 143571 | 699.2 | 834 | 808 | 204.2 |
| D | 1 | 239 | 101260 | 491.98 | 834 | 808 | 204.2 |
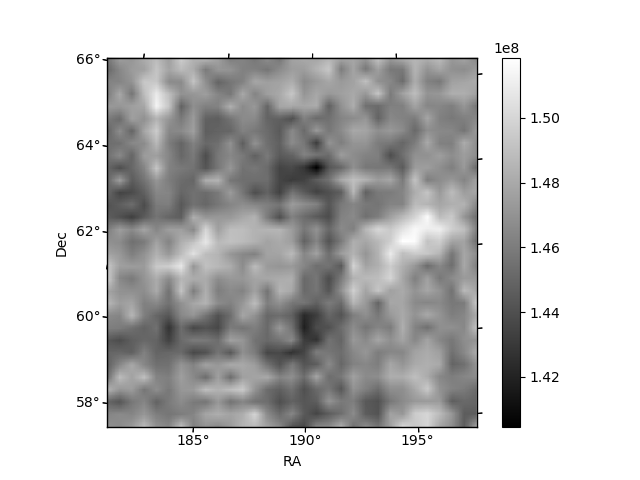
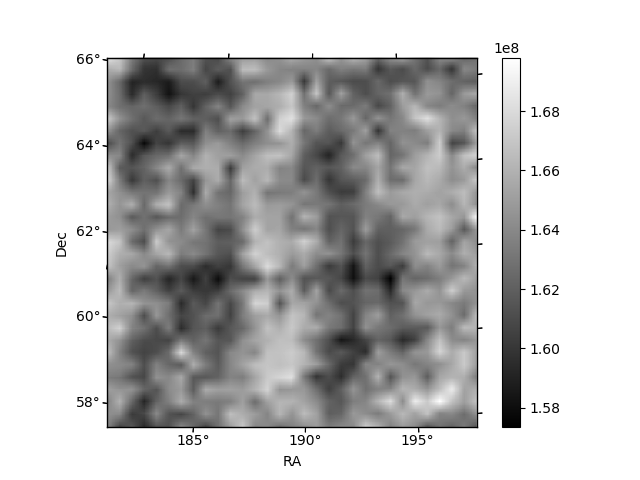
Histogram calculated using DETX and DETY for each event in the final _common_clean file
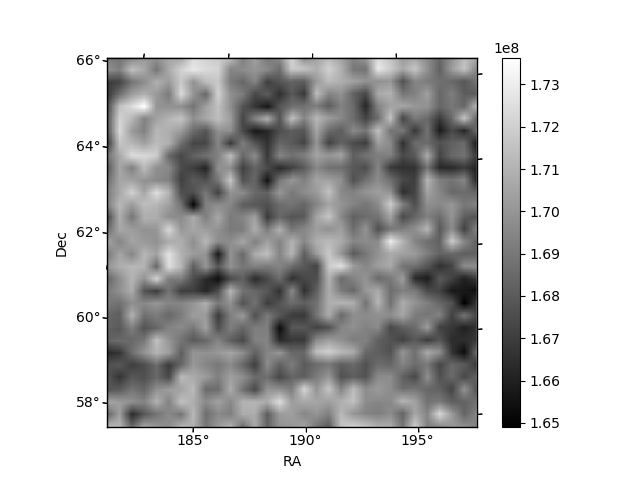
| Quadrant A | 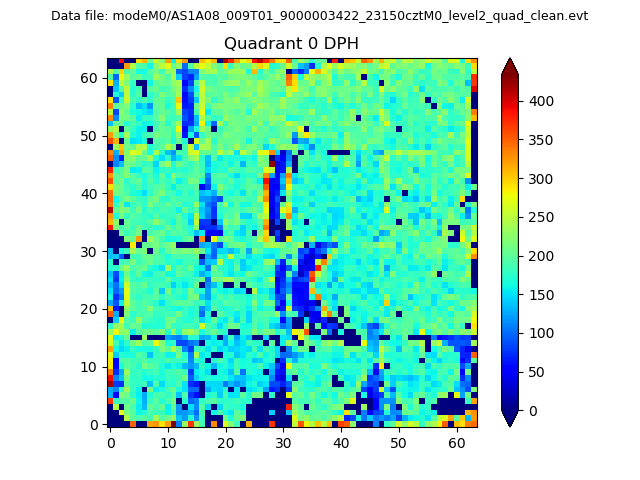 |
 |
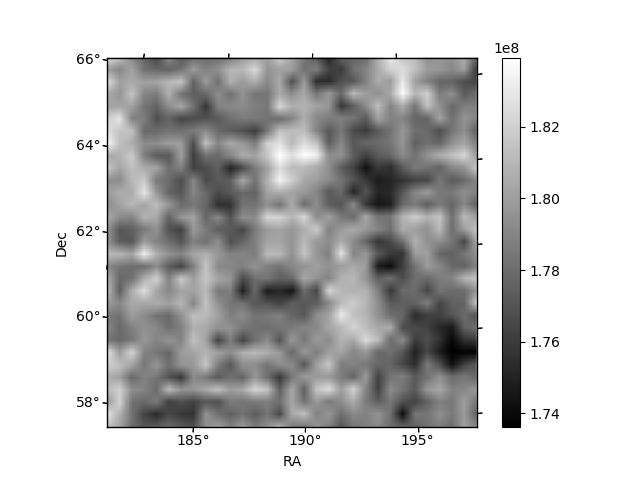
Quadrant B |
|---|---|---|---|
| Quadrant D | 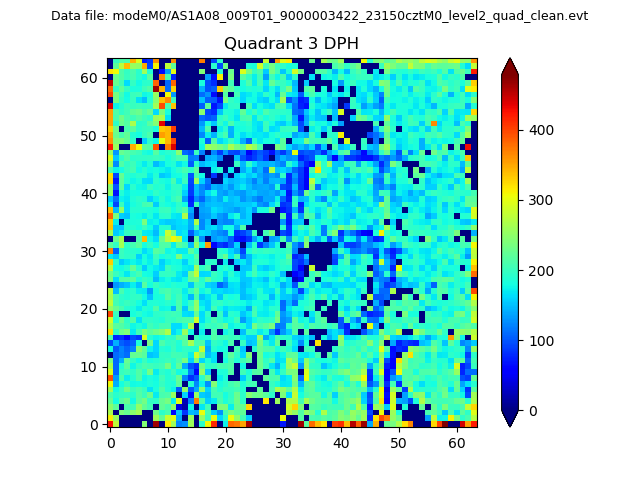 |
 |
Quadrant C |
| Plot type | Count rate plots | Images |
|---|---|---|
| Comparison with Poisson distribution Blue bars denote a histogram of data divided into 1 sec bins. Red curve is a Poisson curve with rate = median count rate of data. |
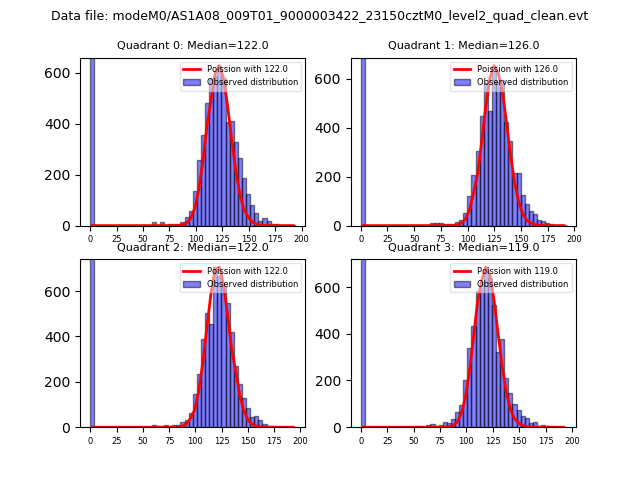 |
 |
| Quadrant-wise count rates Data is divided into 100 sec bins |
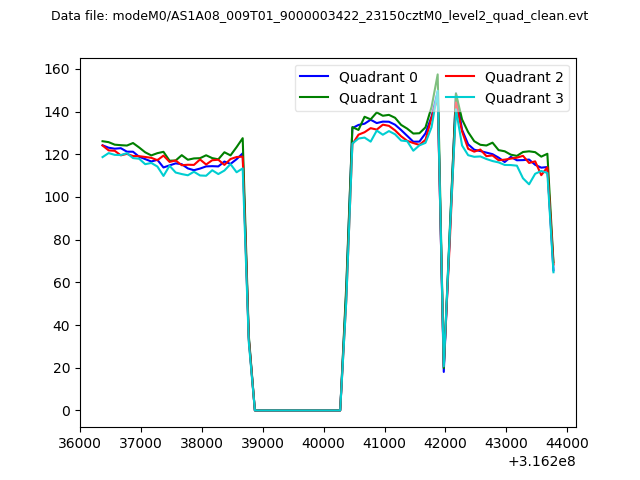 |
|
| Module-wise count rates for Quadrant A Data is divided into 100 sec bins |
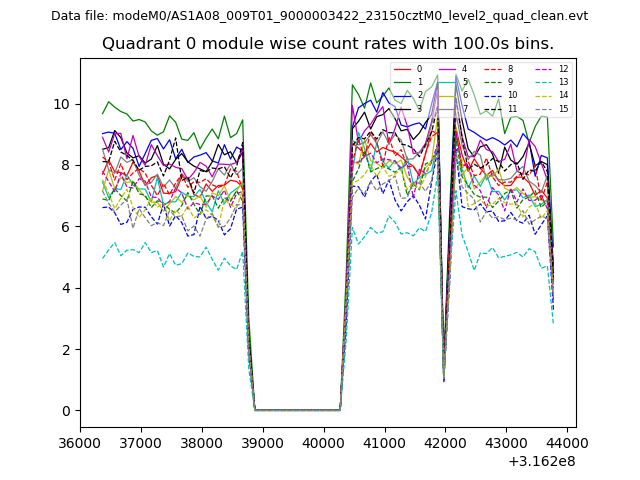 |
 |
| Module-wise count rates for Quadrant B Data is divided into 100 sec bins |
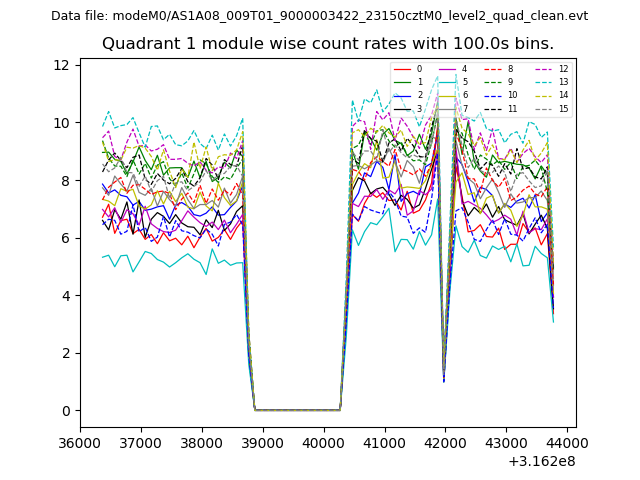 |
 |
| Module-wise count rates for Quadrant C Data is divided into 100 sec bins |
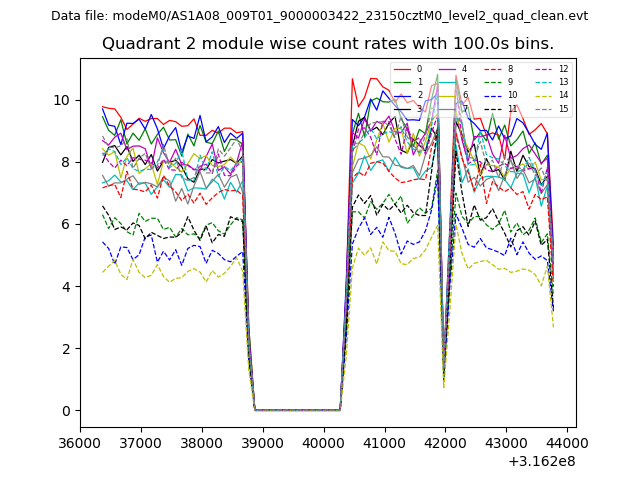 |
 |
| Module-wise count rates for Quadrant D Data is divided into 100 sec bins |
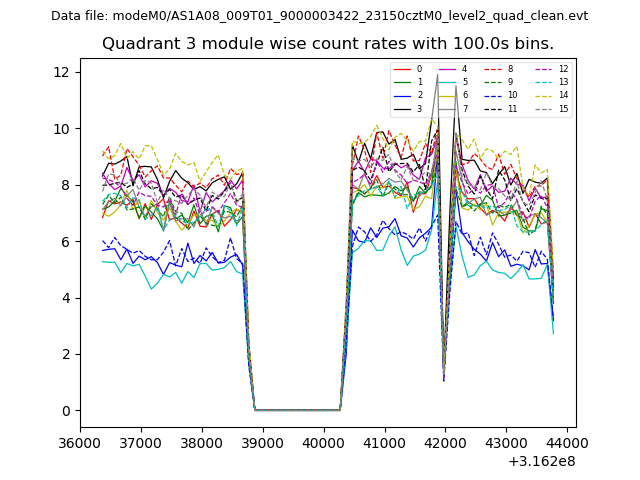 |
 |
| Parameter | Plot |
|---|---|
| CZT HV Monitor | 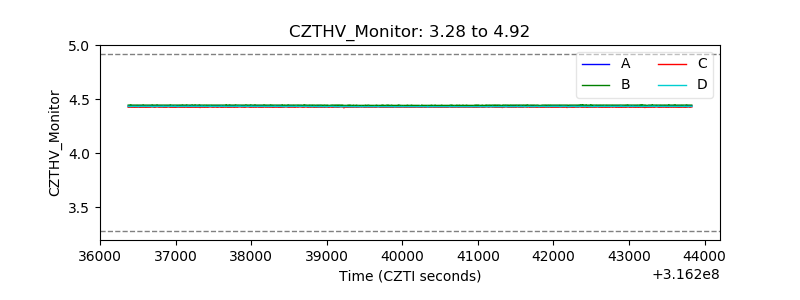 |
| D_VDD | 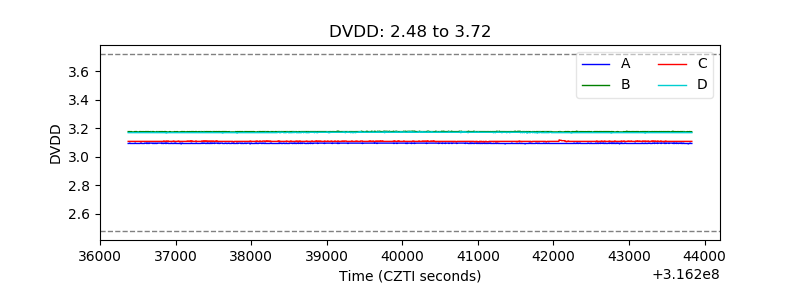 |
| Temperature 1 | 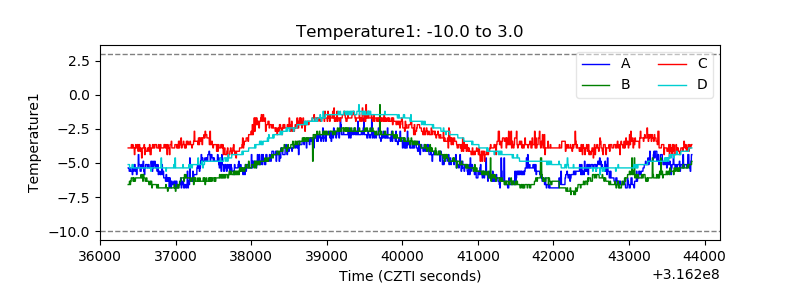 |
| Veto HV Monitor | 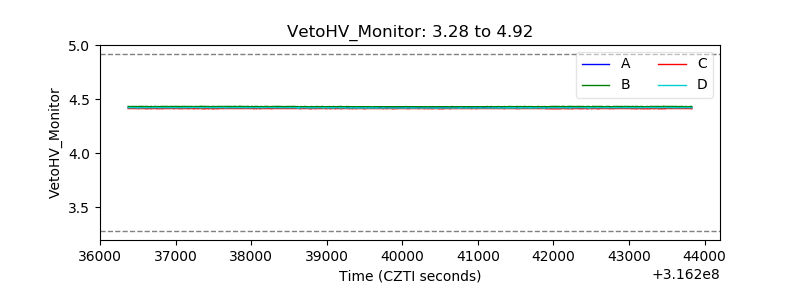 |
| Veto LLD |  |
| Alpha Counter | 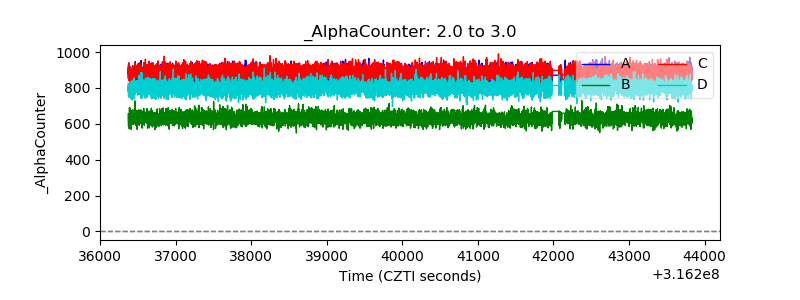 |
| _CPM_Rate | 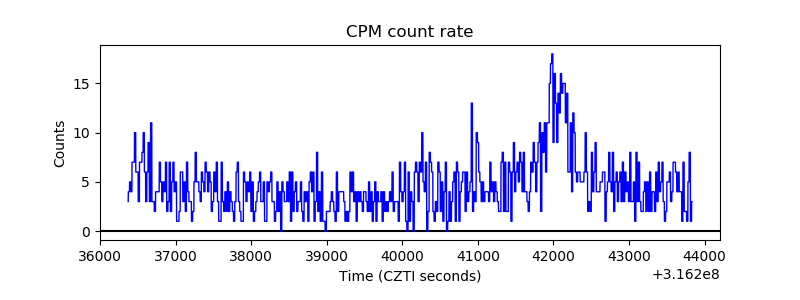 |
| CZT Counter | 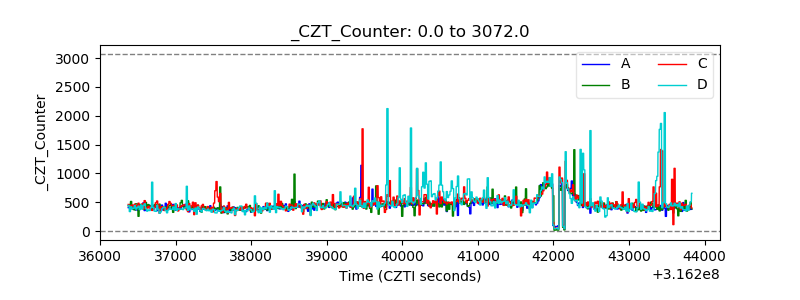 |
| +2.5 Volts monitor |  |
| +5 Volts monitor | 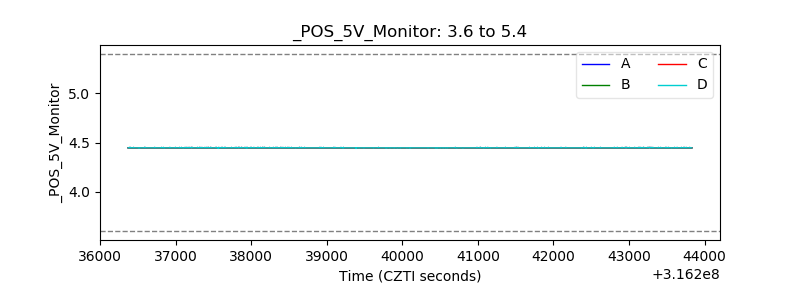 |
| _ROLL_ROT | 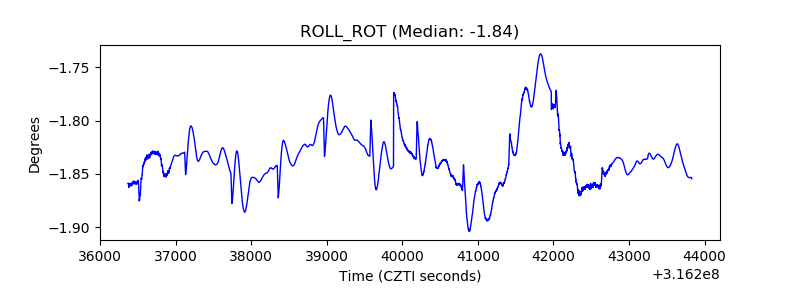 |
| _Roll_DEC | 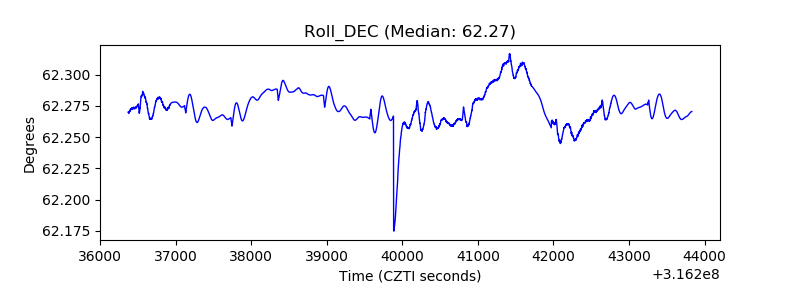 |
| _Roll_RA |  |
| Veto Counter | 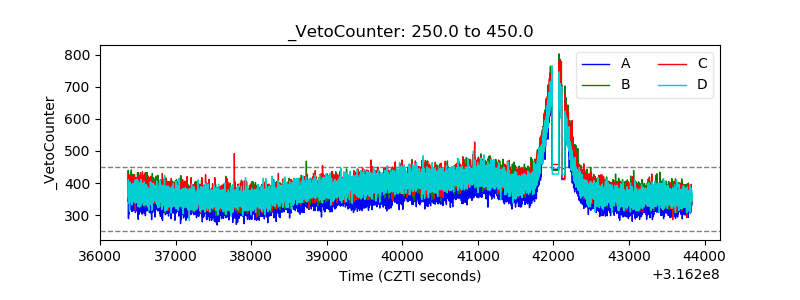 |