| Param | Original file | Final file |
|---|---|---|
| Filename | modeM0/AS1A08_009T01_9000003422_23153cztM0_level2.evt | modeM0/AS1A08_009T01_9000003422_23153cztM0_level2_quad_clean.evt |
| Size (bytes) | 970,539,840 | 188,406,720 |
| Size | 925.6 MB | 179.7 MB |
| Events in quadrant A | 6,567,702 | 1,186,516 |
| Events in quadrant B | 6,720,848 | 1,215,390 |
| Events in quadrant C | 6,822,985 | 1,168,621 |
| Events in quadrant D | 8,300,682 | 1,135,623 |
| Mode M0 | |||
|---|---|---|---|
| Quadrant | BADHDUFLAG | Total packets | Discarded packets |
| A | 0 | 29349 | 2 |
| B | 0 | 29587 | 2 |
| C | 0 | 29721 | 2 |
| D | 0 | 34340 | 2 |
| Mode SS | |||
|---|---|---|---|
| Quadrant | BADHDUFLAG | Total packets | Discarded packets |
| A | 0 | 292 | 0 |
| B | 0 | 292 | 0 |
| C | 0 | 292 | 0 |
| D | 0 | 292 | 0 |
| Mode M9 | |||
|---|---|---|---|
| Quadrant | BADHDUFLAG | Total packets | Discarded packets |
| A | 0 | 10 | 0 |
| B | 0 | 10 | 0 |
| C | 0 | 10 | 0 |
| D | 0 | 10 | 0 |
| Quadrant | Total seconds | Saturated seconds | Saturation percentage |
|---|---|---|---|
| A | 14490 | 174 | 1.200828% |
| B | 14491 | 190 | 1.311159% |
| C | 14491 | 222 | 1.531985% |
| D | 14491 | 379 | 2.615416% |
Noise dominated data is calculated using 1-second bins in cleaned event files. If a bin has >2000 counts, and if more than 50% of those come from <1% of pixels, then it is considered to be noise-dominated and hence unusable.
| Quadrant | # 1 sec bins | Bins with >0 counts | Bins with >2000 counts | High rate bins dominated by noise | Noise dominated (total time) | Noise dominated (detector-on time) | Marked lightcurve |
|---|---|---|---|---|---|---|---|
| A | 15320 | 14491 | 0 | 0 | 0.00% | 0.00% | 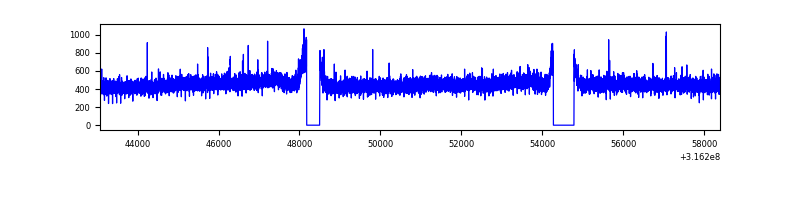 |
| B | 15321 | 14493 | 5 | 5 | 0.03% | 0.03% | 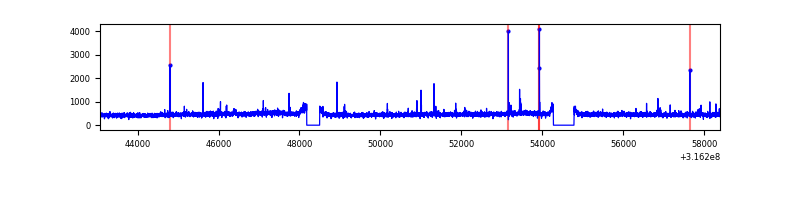 |
| C | 15321 | 14491 | 13 | 13 | 0.08% | 0.09% | 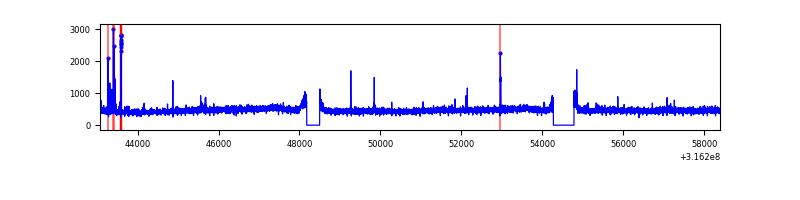 |
| D | 15321 | 14493 | 207 | 207 | 1.35% | 1.43% | 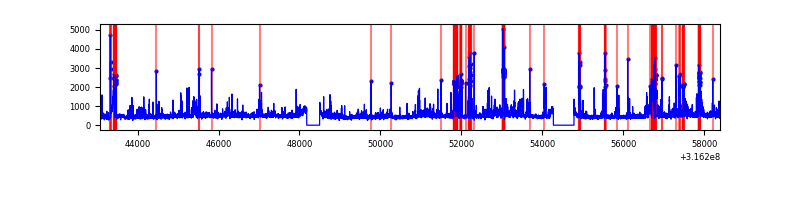 |
Top three noisy pixels from each quadrant. If the there are fewer than three noisy pixels in the level2.evt file, extra rows are filled as -1
| Pixel properties | Quadrant properties | ||||||
|---|---|---|---|---|---|---|---|
| Quadrant | DetID | PixID | Counts | Sigma | Mean | Median | Sigma |
| A | 6 | 16 | 28792 | 79.31 | 1696 | 1657 | 342.1 |
| A | 13 | 254 | 18993 | 50.67 | 1696 | 1657 | 342.1 |
| A | 3 | 137 | 15341 | 40.0 | 1696 | 1657 | 342.1 |
| B | 0 | 190 | 47360 | 142.15 | 1688 | 1640 | 321.6 |
| B | 12 | 111 | 39838 | 118.77 | 1688 | 1640 | 321.6 |
| B | 11 | 111 | 35874 | 106.44 | 1688 | 1640 | 321.6 |
| C | 14 | 238 | 257202 | 675.25 | 1623 | 1630 | 378.5 |
| C | 0 | 10 | 104801 | 272.59 | 1623 | 1630 | 378.5 |
| C | 9 | 15 | 69107 | 178.28 | 1623 | 1630 | 378.5 |
| D | 1 | 52 | 1246030 | 3127.26 | 1642 | 1591 | 397.9 |
| D | 7 | 238 | 165870 | 412.83 | 1642 | 1591 | 397.9 |
| D | 13 | 153 | 158311 | 393.84 | 1642 | 1591 | 397.9 |
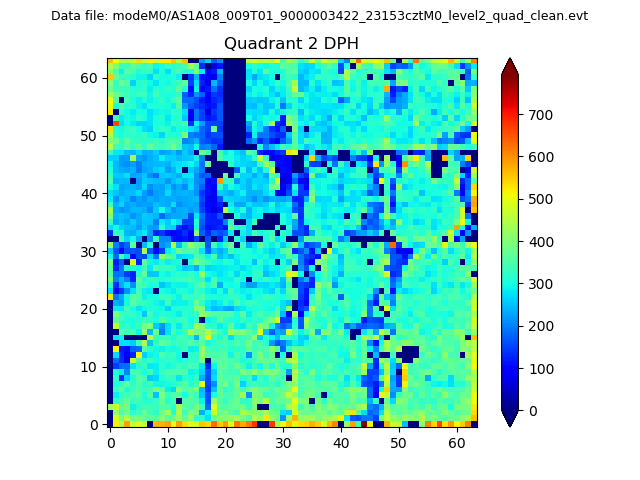
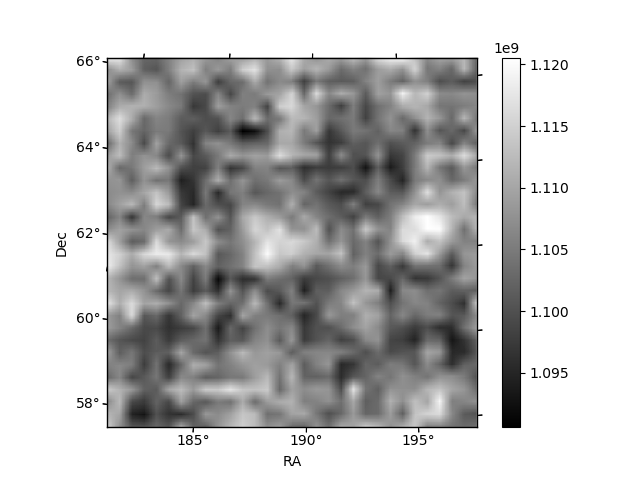
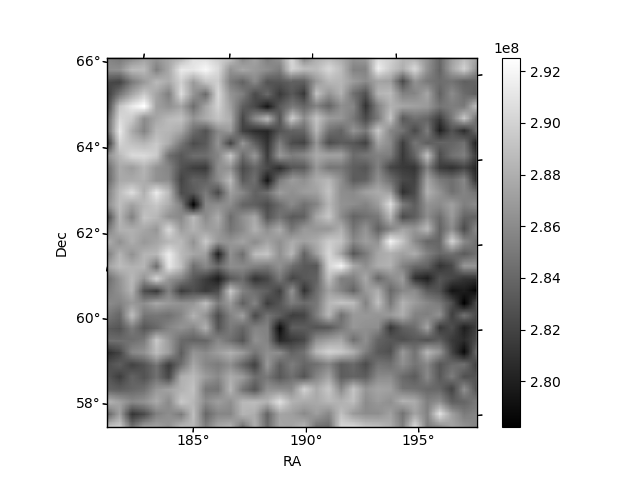
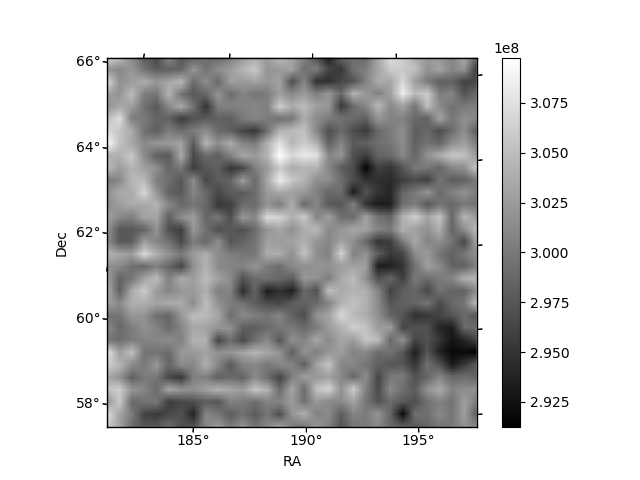
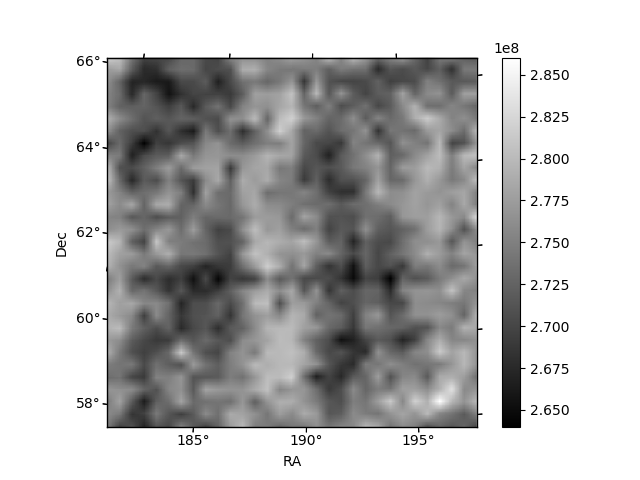
Histogram calculated using DETX and DETY for each event in the final _common_clean file
| Quadrant A | 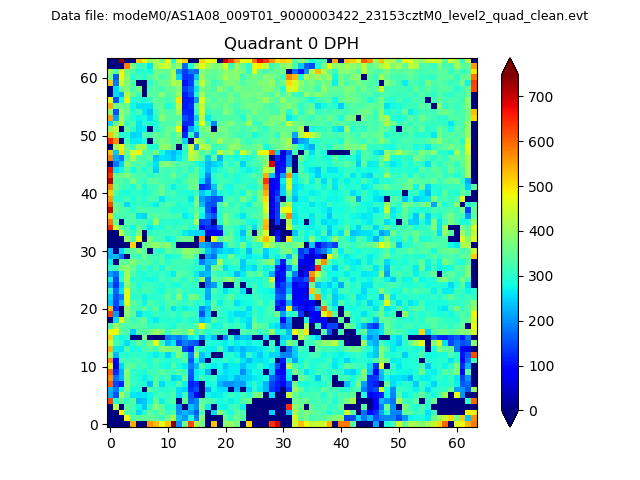 |
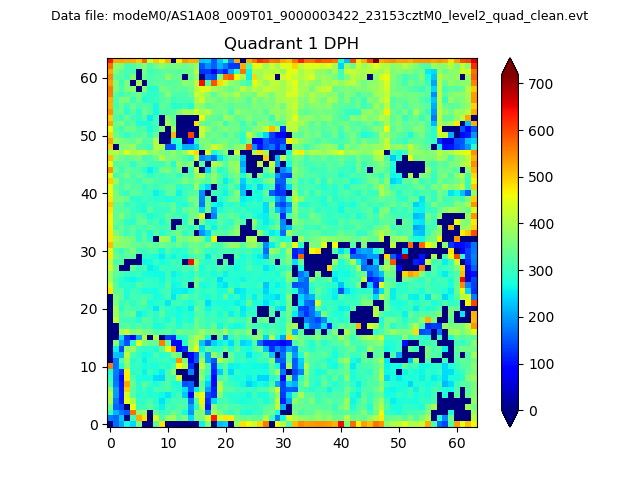 |
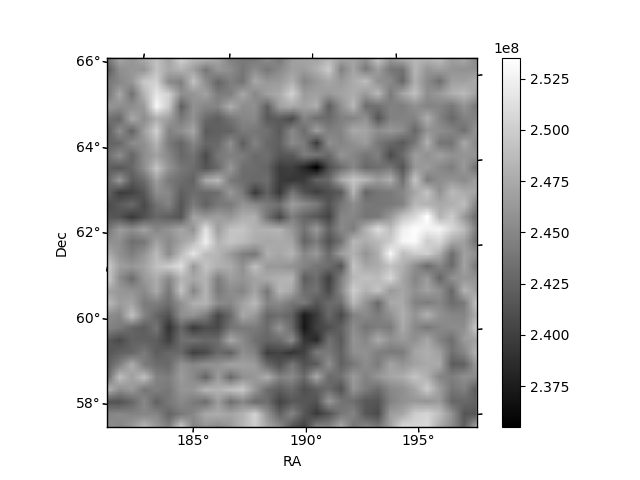
Quadrant B |
|---|---|---|---|
| Quadrant D | 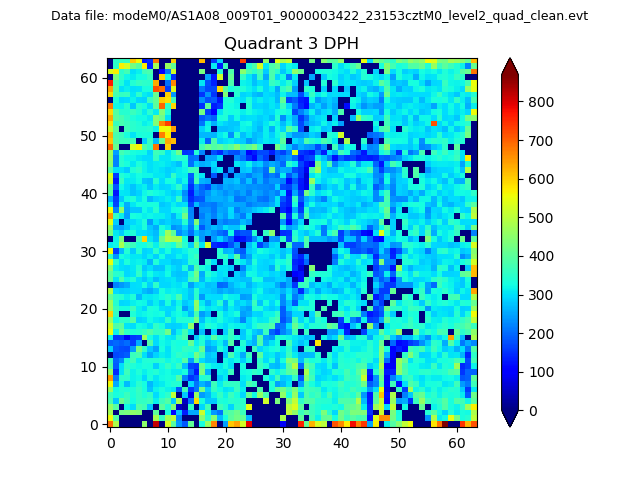 |
 |
Quadrant C |
| Plot type | Count rate plots | Images |
|---|---|---|
| Comparison with Poisson distribution Blue bars denote a histogram of data divided into 1 sec bins. Red curve is a Poisson curve with rate = median count rate of data. |
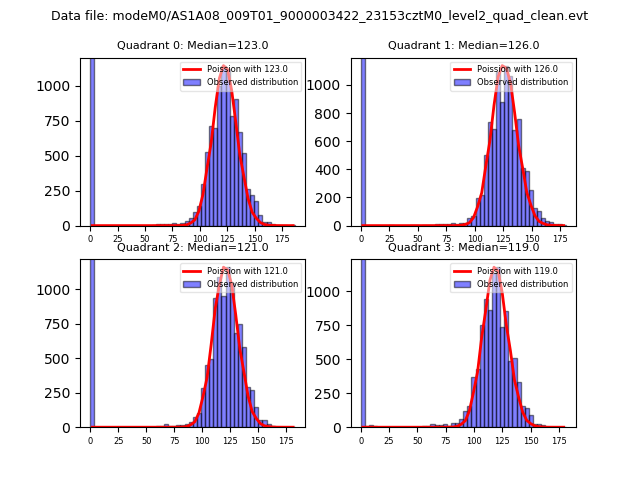 |
 |
| Quadrant-wise count rates Data is divided into 100 sec bins |
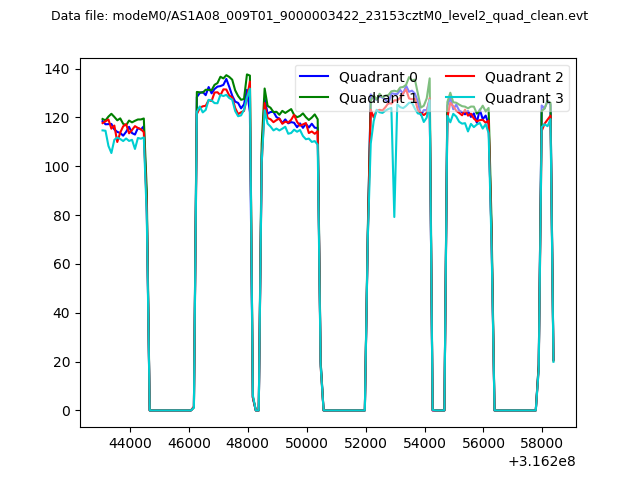 |
|
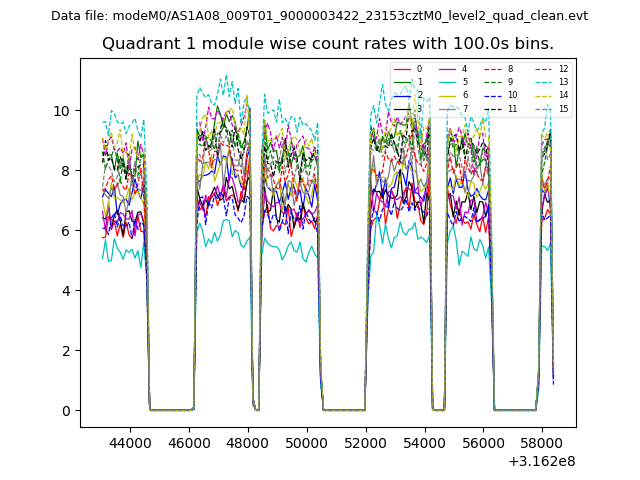
| Module-wise count rates for Quadrant A Data is divided into 100 sec bins |
 |
 |
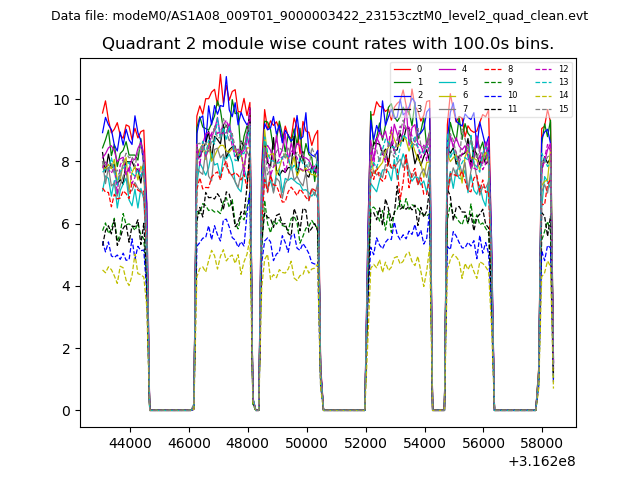
| Module-wise count rates for Quadrant B Data is divided into 100 sec bins |
 |
 |
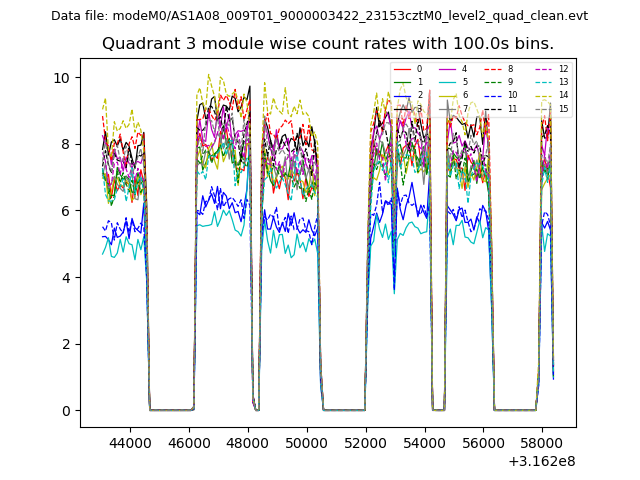
| Module-wise count rates for Quadrant C Data is divided into 100 sec bins |
 |
 |
| Module-wise count rates for Quadrant D Data is divided into 100 sec bins |
 |
 |
| Parameter | Plot |
|---|---|
| CZT HV Monitor | 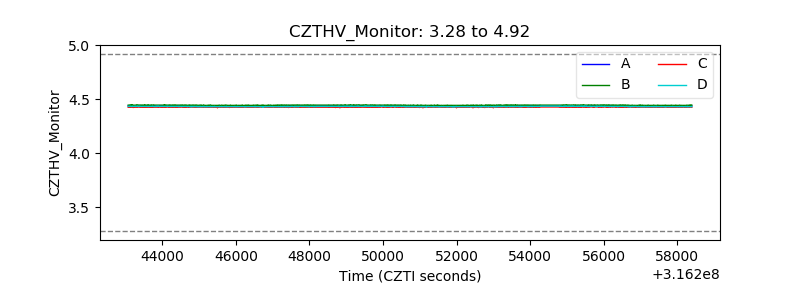 |
| D_VDD | 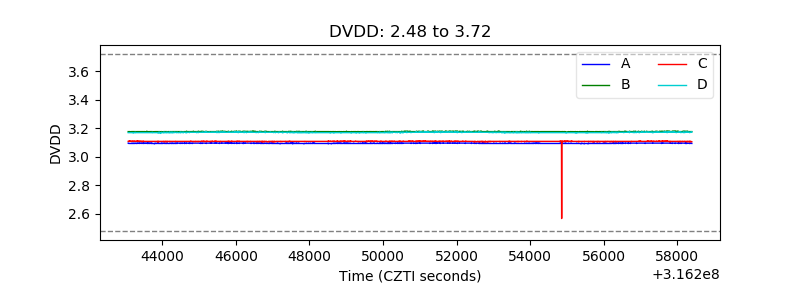 |
| Temperature 1 | 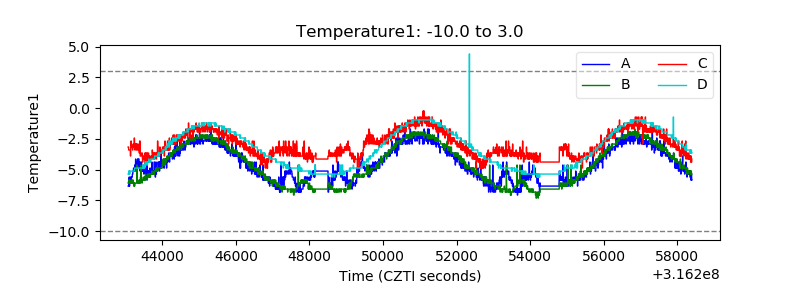 |
| Veto HV Monitor | 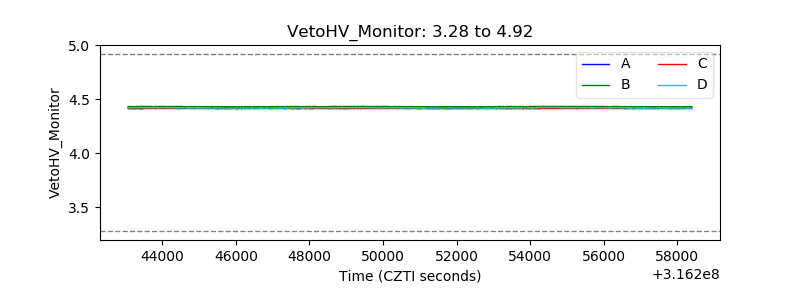 |
| Veto LLD | 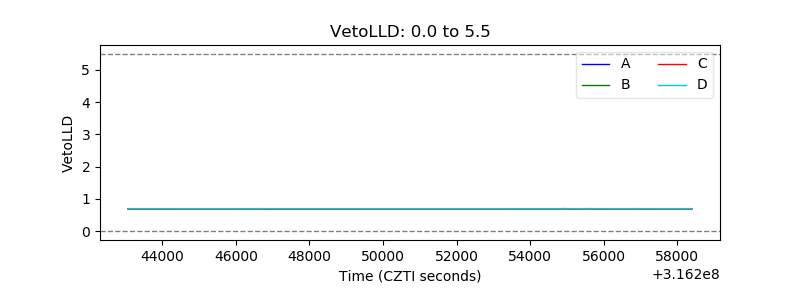 |
| Alpha Counter | 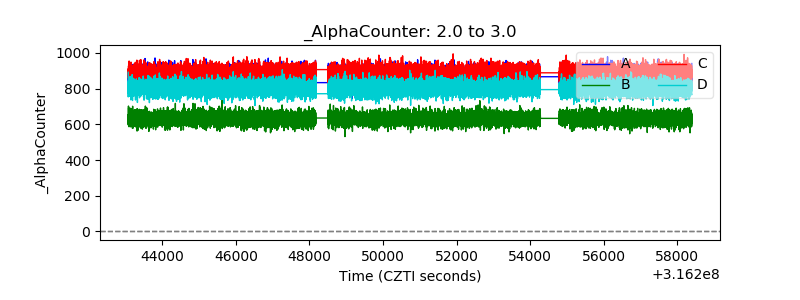 |
| _CPM_Rate | 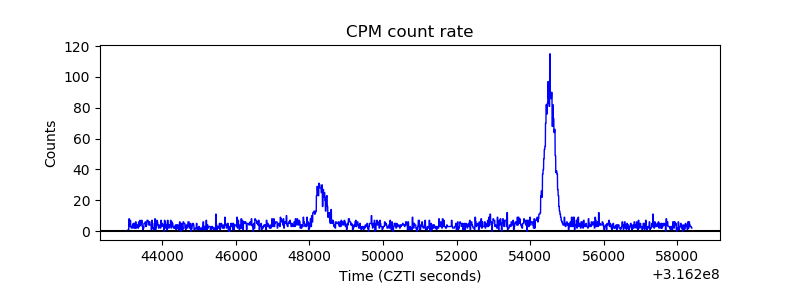 |
| CZT Counter | 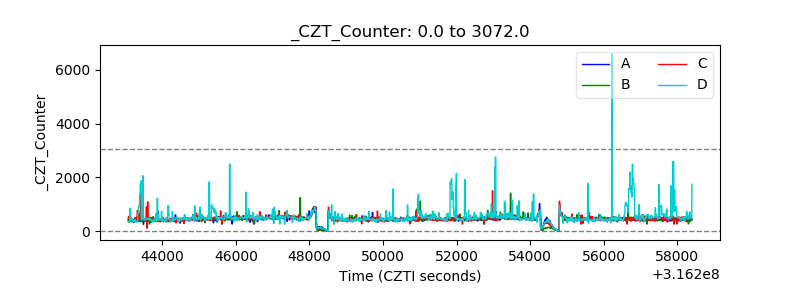 |
| +2.5 Volts monitor | 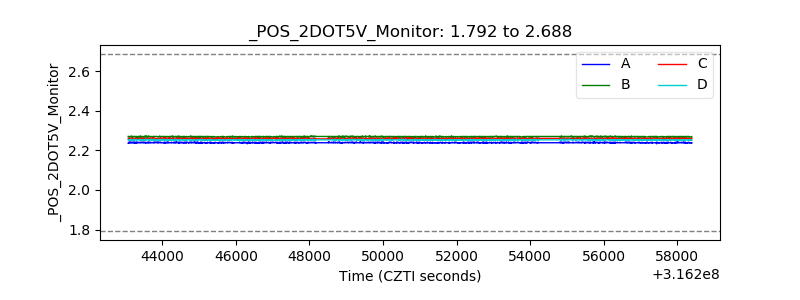 |
| +5 Volts monitor |  |
| _ROLL_ROT | 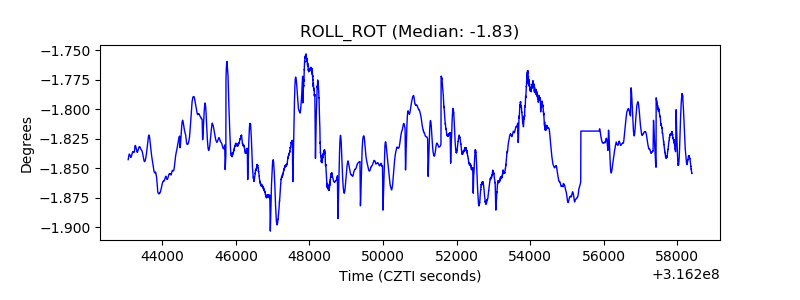 |
| _Roll_DEC | 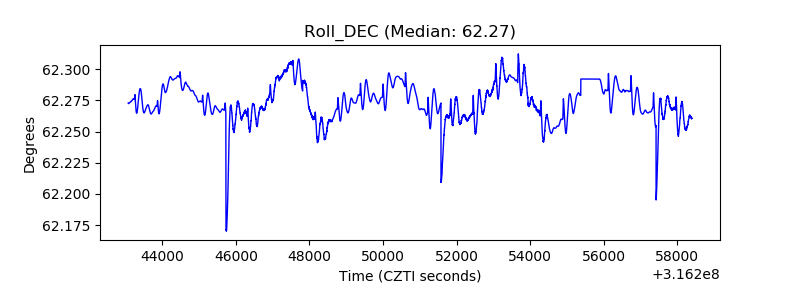 |
| _Roll_RA | 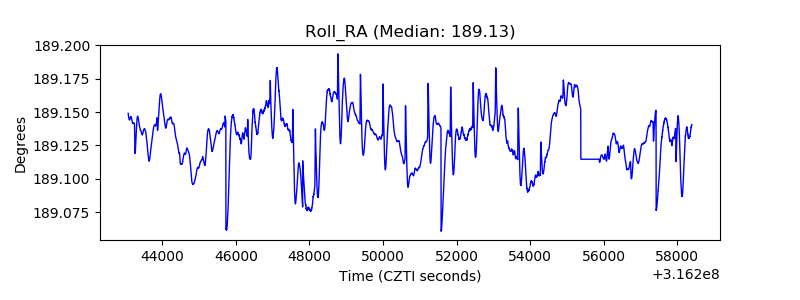 |
| Veto Counter |  |