| Param | Original file | Final file |
|---|---|---|
| Filename | modeM0/AS1A08_009T01_9000003422_23154cztM0_level2.evt | modeM0/AS1A08_009T01_9000003422_23154cztM0_level2_quad_clean.evt |
| Size (bytes) | 810,449,280 | 126,169,920 |
| Size | 772.9 MB | 120.3 MB |
| Events in quadrant A | 4,343,180 | 826,998 |
| Events in quadrant B | 4,321,482 | 842,134 |
| Events in quadrant C | 4,415,909 | 811,238 |
| Events in quadrant D | 10,854,714 | 715,148 |
| Mode M0 | |||
|---|---|---|---|
| Quadrant | BADHDUFLAG | Total packets | Discarded packets |
| A | 0 | 18712 | 2 |
| B | 0 | 18491 | 2 |
| C | 0 | 18635 | 2 |
| D | 0 | 38415 | 2 |
| Mode SS | |||
|---|---|---|---|
| Quadrant | BADHDUFLAG | Total packets | Discarded packets |
| A | 0 | 184 | 0 |
| B | 0 | 184 | 0 |
| C | 0 | 184 | 0 |
| D | 0 | 184 | 0 |
| Mode M9 | |||
|---|---|---|---|
| Quadrant | BADHDUFLAG | Total packets | Discarded packets |
| A | 0 | 16 | 0 |
| B | 0 | 16 | 0 |
| C | 0 | 16 | 0 |
| D | 0 | 16 | 0 |
| Quadrant | Total seconds | Saturated seconds | Saturation percentage |
|---|---|---|---|
| A | 9005 | 162 | 1.799001% |
| B | 9006 | 105 | 1.165889% |
| C | 9006 | 157 | 1.743282% |
| D | 9006 | 2138 | 23.739729% |
Noise dominated data is calculated using 1-second bins in cleaned event files. If a bin has >2000 counts, and if more than 50% of those come from <1% of pixels, then it is considered to be noise-dominated and hence unusable.
| Quadrant | # 1 sec bins | Bins with >0 counts | Bins with >2000 counts | High rate bins dominated by noise | Noise dominated (total time) | Noise dominated (detector-on time) | Marked lightcurve |
|---|---|---|---|---|---|---|---|
| A | 10605 | 9005 | 39 | 39 | 0.37% | 0.43% | 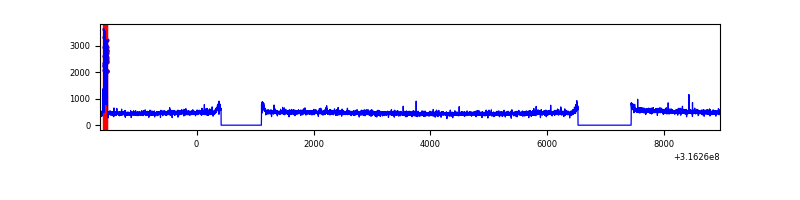 |
| B | 10606 | 9007 | 2 | 2 | 0.02% | 0.02% | 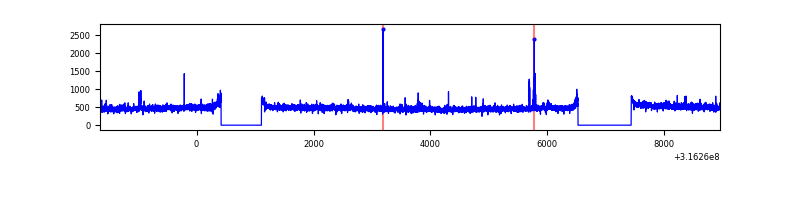 |
| C | 10606 | 9006 | 0 | 0 | 0.00% | 0.00% | 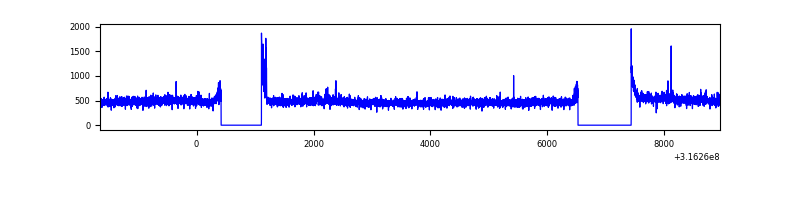 |
| D | 10606 | 9007 | 1804 | 1804 | 17.01% | 20.03% | 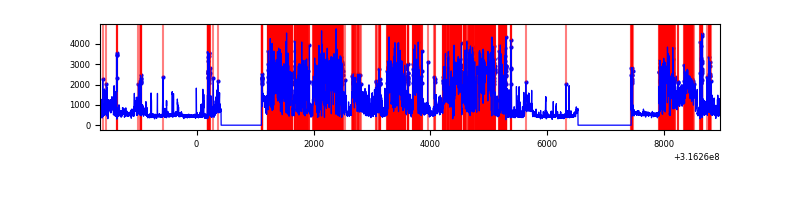 |
Top three noisy pixels from each quadrant. If the there are fewer than three noisy pixels in the level2.evt file, extra rows are filled as -1
| Pixel properties | Quadrant properties | ||||||
|---|---|---|---|---|---|---|---|
| Quadrant | DetID | PixID | Counts | Sigma | Mean | Median | Sigma |
| A | 15 | 174 | 138520 | 624.35 | 1088 | 1062 | 220.2 |
| A | 13 | 254 | 12324 | 51.15 | 1088 | 1062 | 220.2 |
| A | 6 | 16 | 11703 | 48.33 | 1088 | 1062 | 220.2 |
| B | 12 | 111 | 25532 | 117.37 | 1087 | 1056 | 208.5 |
| B | 0 | 245 | 23137 | 105.89 | 1087 | 1056 | 208.5 |
| B | 11 | 111 | 22971 | 105.09 | 1087 | 1056 | 208.5 |
| C | 14 | 238 | 166271 | 675.32 | 1047 | 1051 | 244.7 |
| C | 0 | 10 | 110893 | 448.97 | 1047 | 1051 | 244.7 |
| C | 7 | 247 | 48142 | 192.48 | 1047 | 1051 | 244.7 |
| D | 1 | 52 | 6683061 | 28506.2 | 961 | 932 | 234.4 |
| D | 7 | 238 | 276261 | 1174.56 | 961 | 932 | 234.4 |
| D | 1 | 239 | 52299 | 219.13 | 961 | 932 | 234.4 |
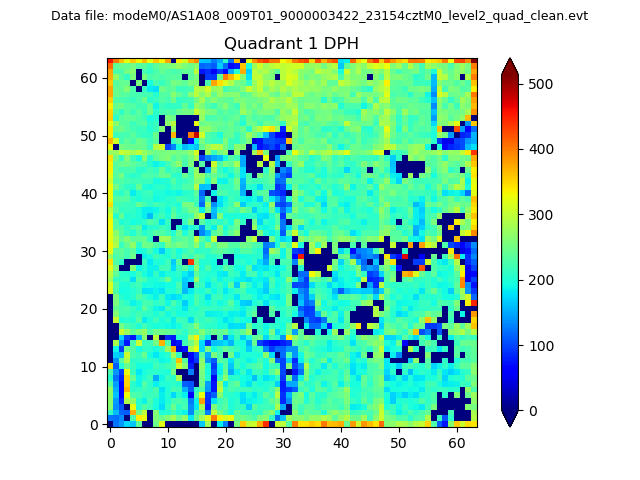
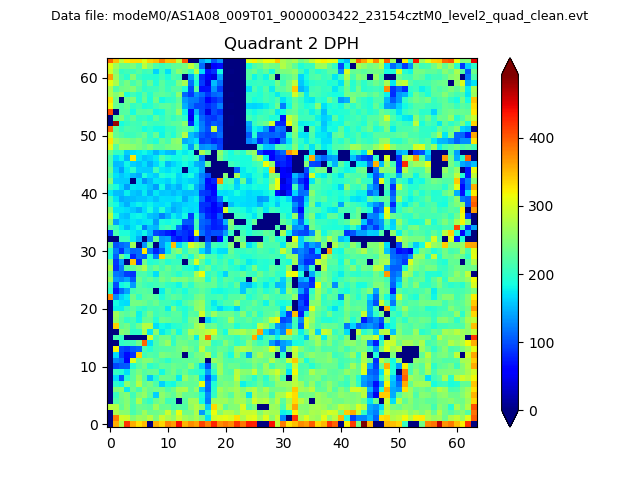
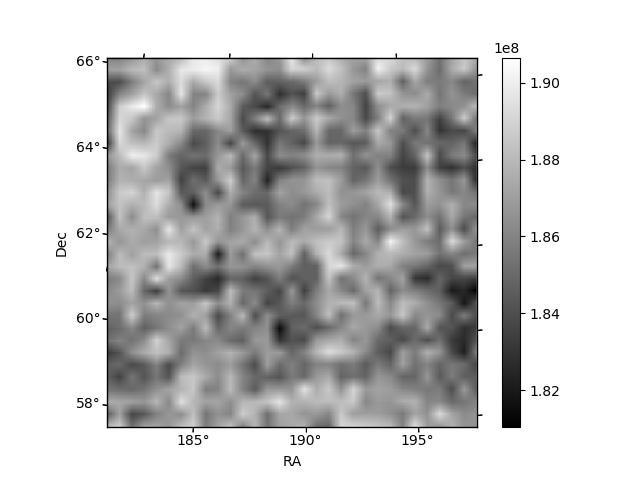
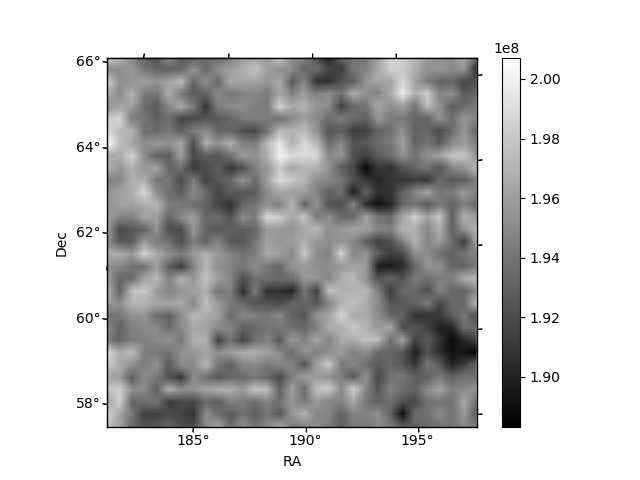
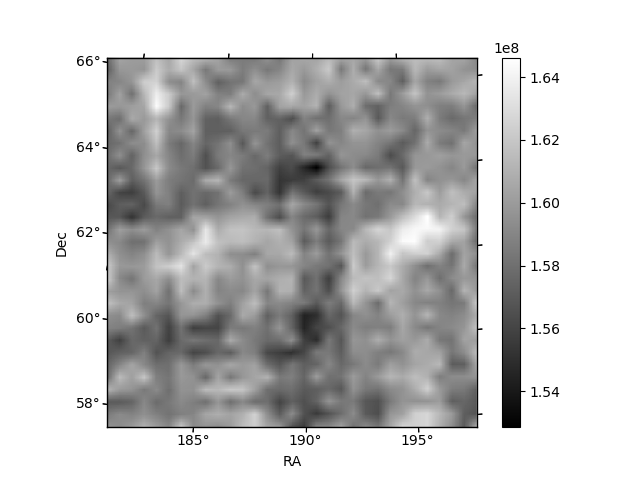
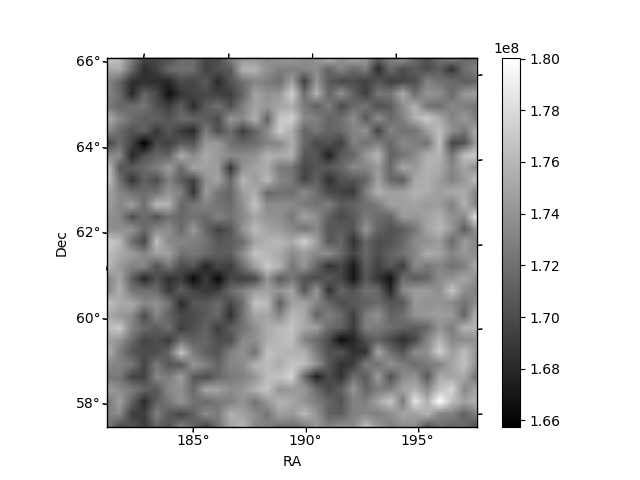
Histogram calculated using DETX and DETY for each event in the final _common_clean file
| Quadrant A |  |
 |
Quadrant B |
|---|---|---|---|
| Quadrant D |  |
 |
Quadrant C |
| Plot type | Count rate plots | Images |
|---|---|---|
| Comparison with Poisson distribution Blue bars denote a histogram of data divided into 1 sec bins. Red curve is a Poisson curve with rate = median count rate of data. |
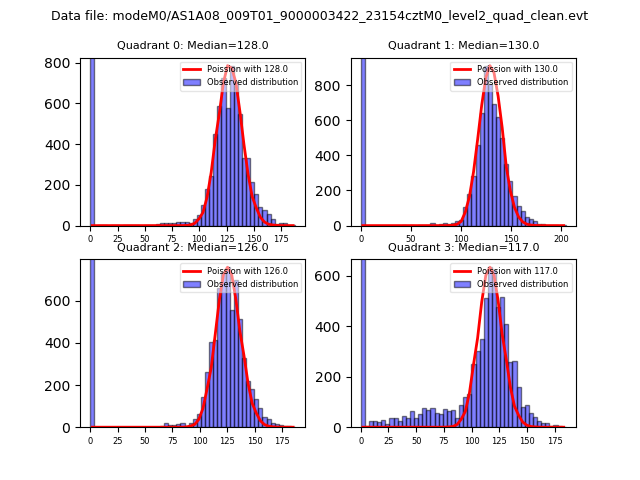 |
 |
| Quadrant-wise count rates Data is divided into 100 sec bins |
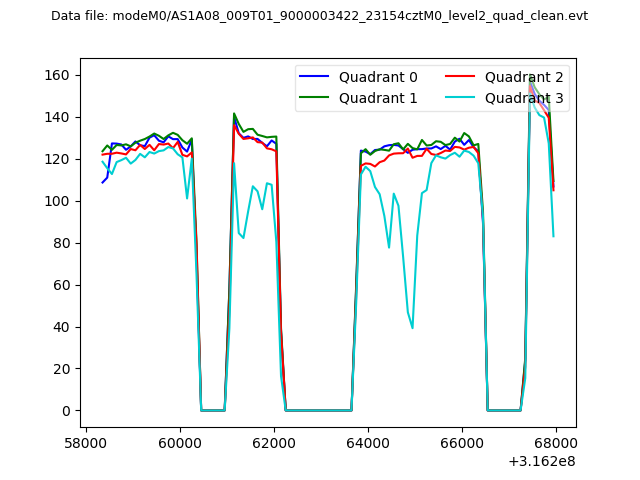 |
|
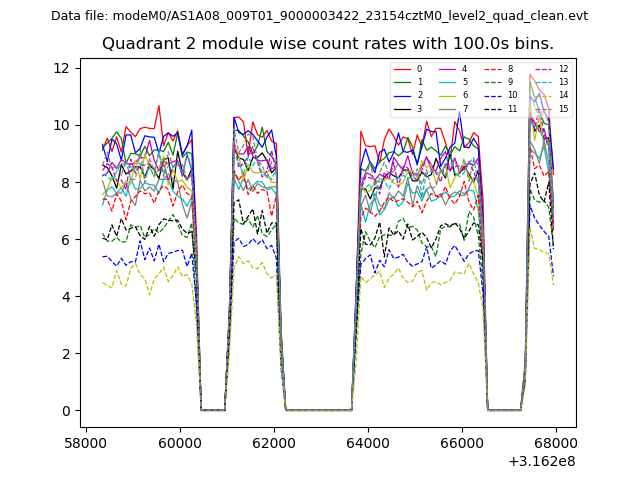
| Module-wise count rates for Quadrant A Data is divided into 100 sec bins |
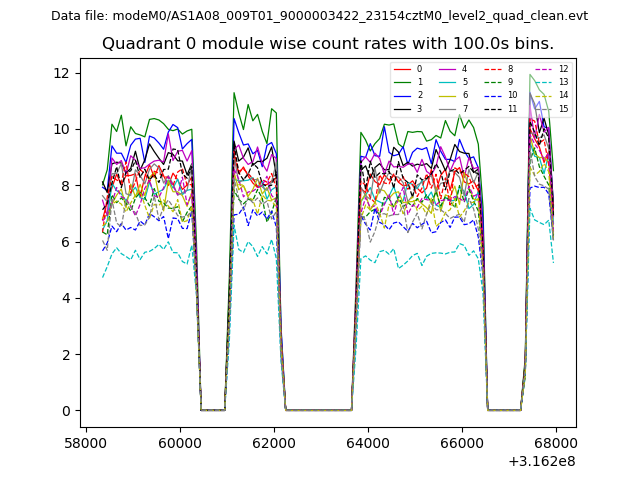 |
 |
| Module-wise count rates for Quadrant B Data is divided into 100 sec bins |
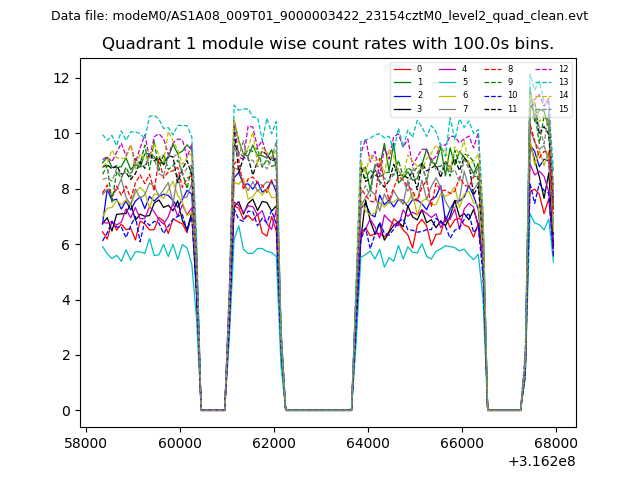 |
 |
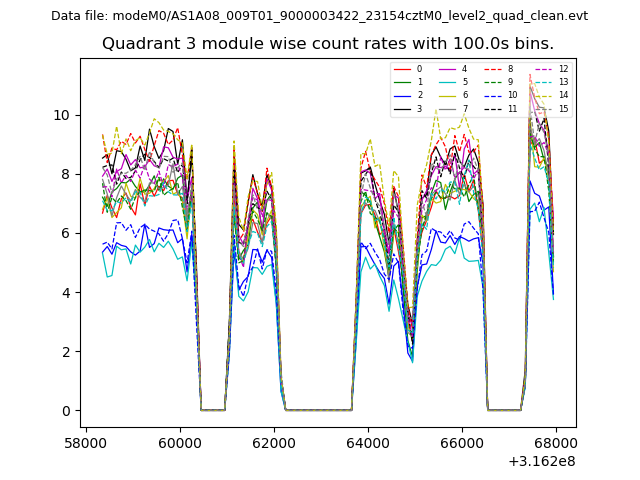
| Module-wise count rates for Quadrant C Data is divided into 100 sec bins |
 |
 |
| Module-wise count rates for Quadrant D Data is divided into 100 sec bins |
 |
 |
| Parameter | Plot |
|---|---|
| CZT HV Monitor | 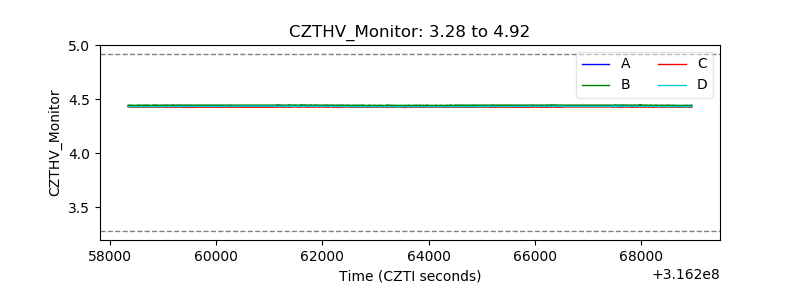 |
| D_VDD | 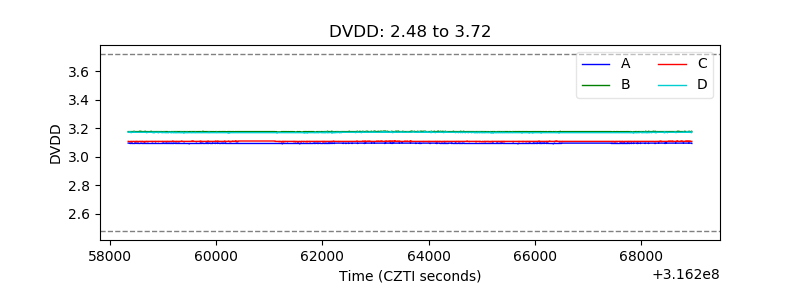 |
| Temperature 1 | 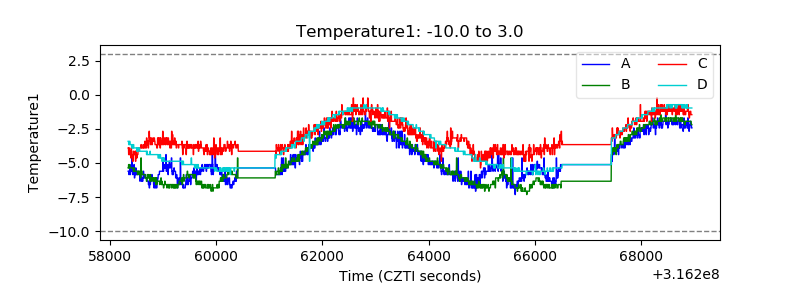 |
| Veto HV Monitor |  |
| Veto LLD | 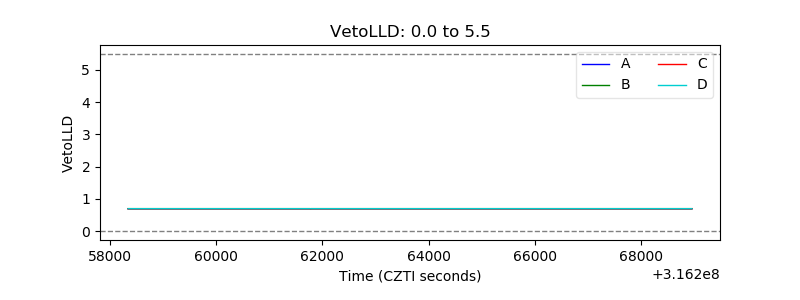 |
| Alpha Counter | 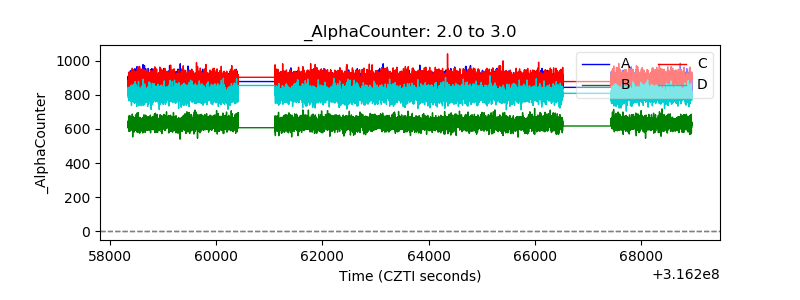 |
| _CPM_Rate | 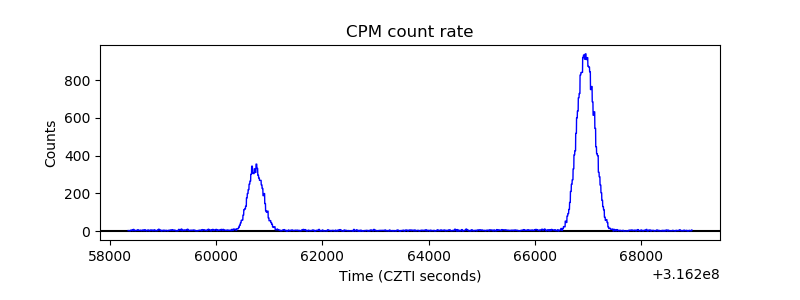 |
| CZT Counter | 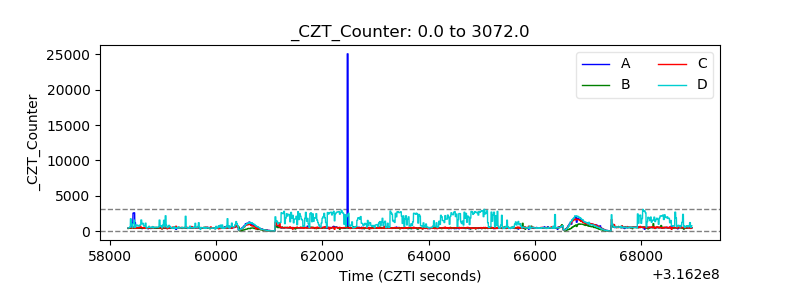 |
| +2.5 Volts monitor | 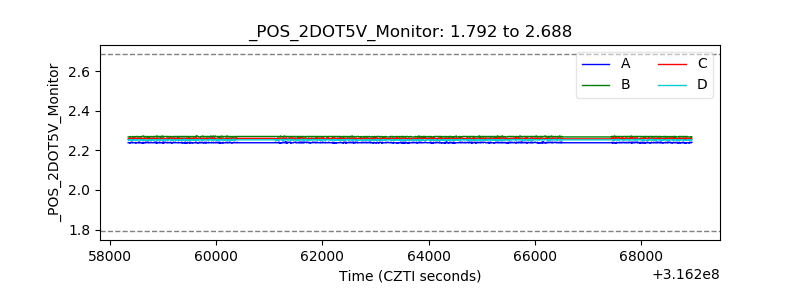 |
| +5 Volts monitor |  |
| _ROLL_ROT | 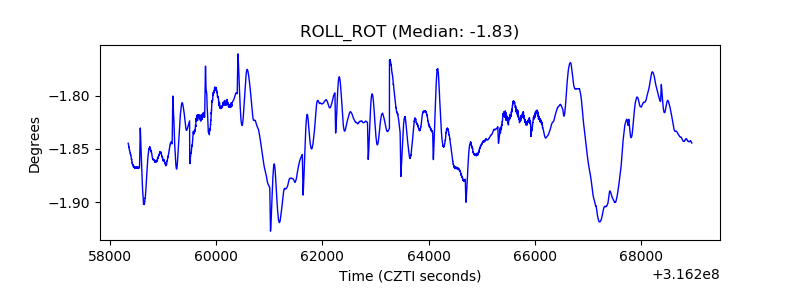 |
| _Roll_DEC | 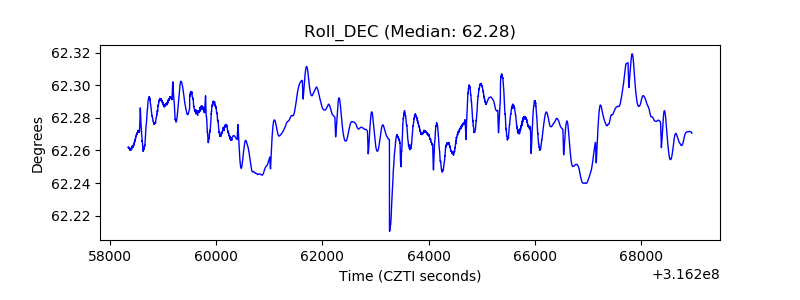 |
| _Roll_RA | 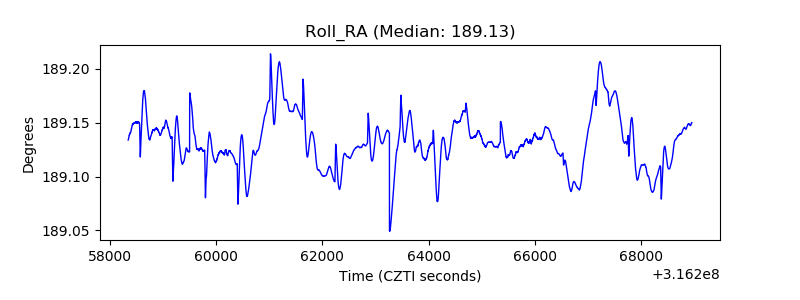 |
| Veto Counter | 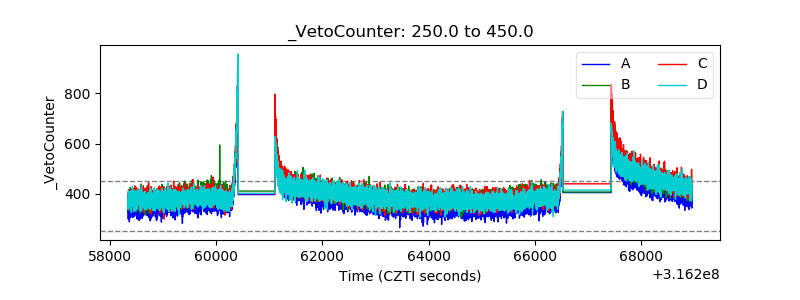 |