| Param | Original file | Final file |
|---|---|---|
| Filename | modeM0/AS1A08_009T01_9000003422_23155cztM0_level2.evt | modeM0/AS1A08_009T01_9000003422_23155cztM0_level2_quad_clean.evt |
| Size (bytes) | 576,636,480 | 78,307,200 |
| Size | 549.9 MB | 74.7 MB |
| Events in quadrant A | 3,257,580 | 494,288 |
| Events in quadrant B | 3,337,572 | 500,432 |
| Events in quadrant C | 3,392,778 | 481,976 |
| Events in quadrant D | 7,020,242 | 426,115 |
| Mode M0 | |||
|---|---|---|---|
| Quadrant | BADHDUFLAG | Total packets | Discarded packets |
| A | 0 | 14065 | 2 |
| B | 0 | 14215 | 2 |
| C | 0 | 14326 | 2 |
| D | 0 | 25504 | 3 |
| Mode SS | |||
|---|---|---|---|
| Quadrant | BADHDUFLAG | Total packets | Discarded packets |
| A | 0 | 136 | 0 |
| B | 0 | 136 | 0 |
| C | 0 | 136 | 0 |
| D | 0 | 136 | 0 |
| Mode M9 | |||
|---|---|---|---|
| Quadrant | BADHDUFLAG | Total packets | Discarded packets |
| A | 0 | 11 | 0 |
| B | 0 | 12 | 0 |
| C | 0 | 12 | 0 |
| D | 0 | 12 | 0 |
| Quadrant | Total seconds | Saturated seconds | Saturation percentage |
|---|---|---|---|
| A | 6715 | 61 | 0.908414% |
| B | 6715 | 64 | 0.953090% |
| C | 6715 | 118 | 1.757260% |
| D | 6714 | 1184 | 17.634793% |
Noise dominated data is calculated using 1-second bins in cleaned event files. If a bin has >2000 counts, and if more than 50% of those come from <1% of pixels, then it is considered to be noise-dominated and hence unusable.
| Quadrant | # 1 sec bins | Bins with >0 counts | Bins with >2000 counts | High rate bins dominated by noise | Noise dominated (total time) | Noise dominated (detector-on time) | Marked lightcurve |
|---|---|---|---|---|---|---|---|
| A | 7780 | 6715 | 0 | 0 | 0.00% | 0.00% | 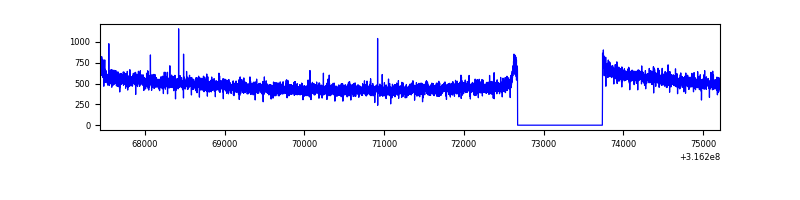 |
| B | 7780 | 6715 | 2 | 2 | 0.03% | 0.03% | 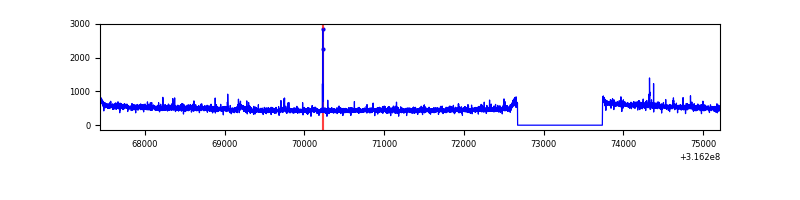 |
| C | 7780 | 6715 | 0 | 0 | 0.00% | 0.00% | 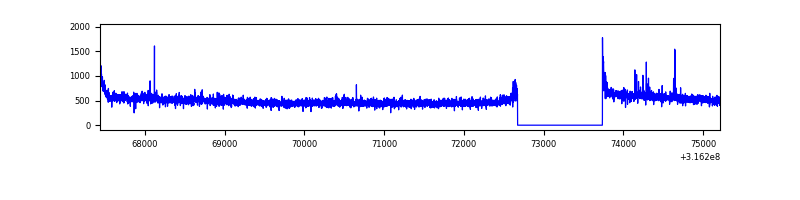 |
| D | 7779 | 6714 | 989 | 989 | 12.71% | 14.73% | 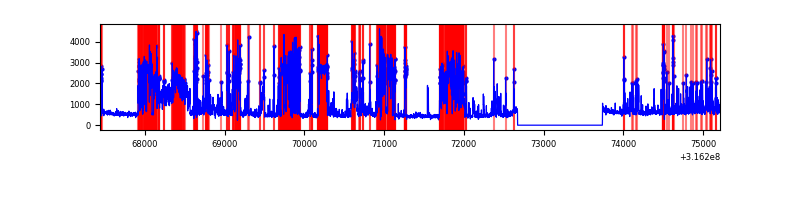 |
Top three noisy pixels from each quadrant. If the there are fewer than three noisy pixels in the level2.evt file, extra rows are filled as -1
| Pixel properties | Quadrant properties | ||||||
|---|---|---|---|---|---|---|---|
| Quadrant | DetID | PixID | Counts | Sigma | Mean | Median | Sigma |
| A | 13 | 254 | 9061 | 48.84 | 844 | 827 | 168.6 |
| A | 0 | 226 | 7431 | 39.17 | 844 | 827 | 168.6 |
| A | 3 | 137 | 7368 | 38.79 | 844 | 827 | 168.6 |
| B | 0 | 190 | 36710 | 223.12 | 840 | 819 | 160.9 |
| B | 12 | 111 | 19000 | 113.02 | 840 | 819 | 160.9 |
| B | 11 | 111 | 16826 | 99.51 | 840 | 819 | 160.9 |
| C | 14 | 238 | 129791 | 685.52 | 809 | 814 | 188.1 |
| C | 0 | 10 | 53464 | 279.84 | 809 | 814 | 188.1 |
| C | 7 | 247 | 38682 | 201.27 | 809 | 814 | 188.1 |
| D | 1 | 52 | 3742094 | 19809.24 | 773 | 751 | 188.9 |
| D | 7 | 238 | 132342 | 696.73 | 773 | 751 | 188.9 |
| D | 12 | 233 | 132201 | 695.99 | 773 | 751 | 188.9 |
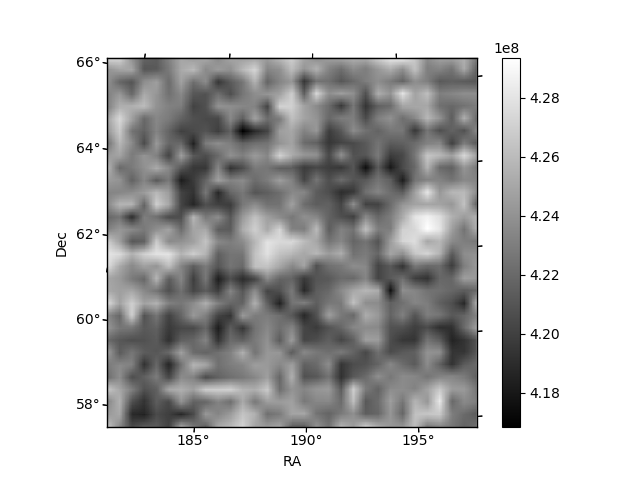
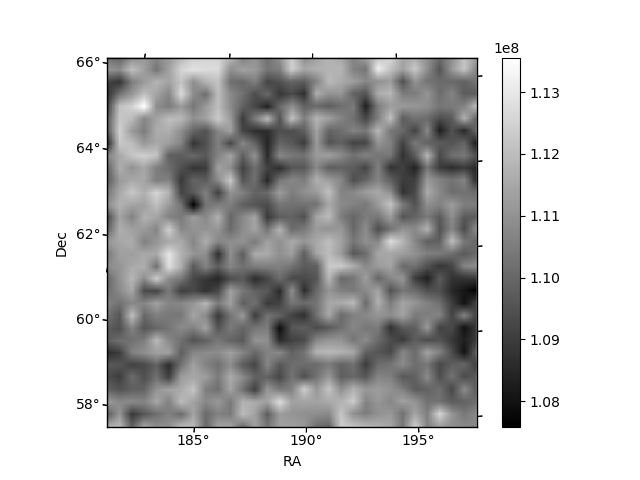
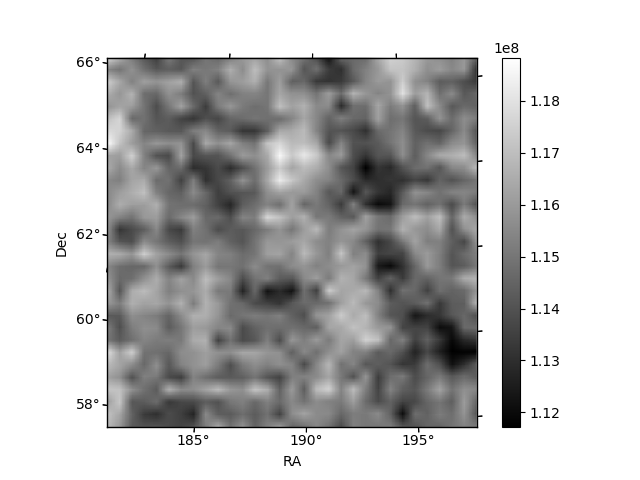
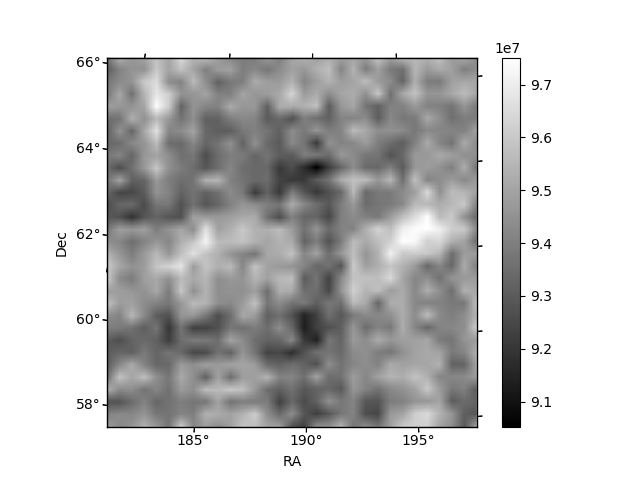
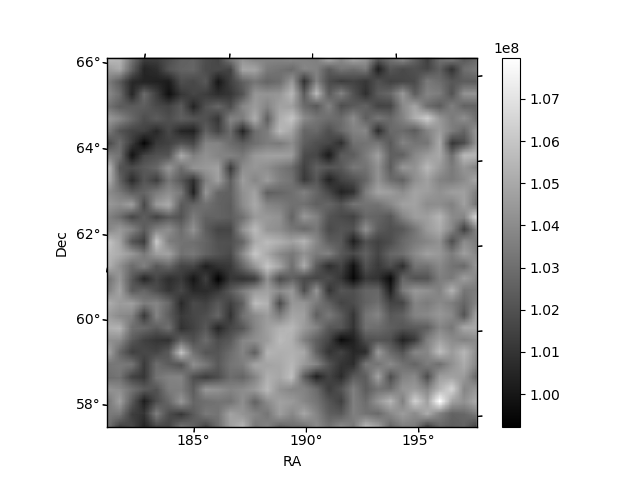
Histogram calculated using DETX and DETY for each event in the final _common_clean file
| Quadrant A | 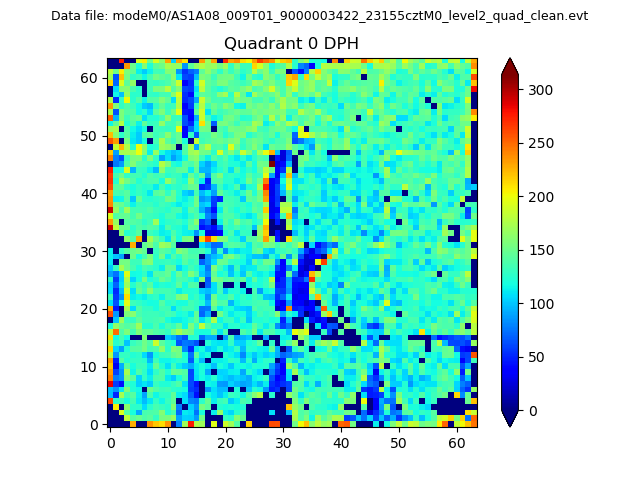 |
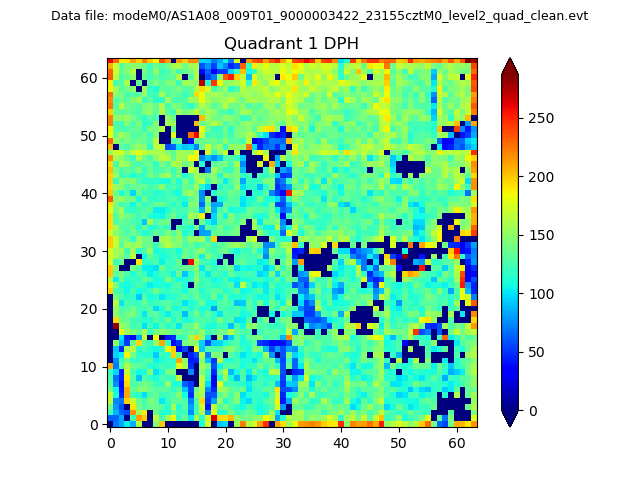 |
Quadrant B |
|---|---|---|---|
| Quadrant D | 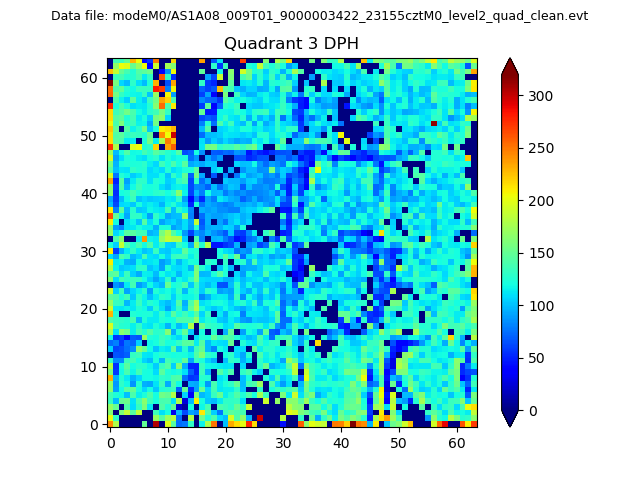 |
 |
Quadrant C |
| Plot type | Count rate plots | Images |
|---|---|---|
| Comparison with Poisson distribution Blue bars denote a histogram of data divided into 1 sec bins. Red curve is a Poisson curve with rate = median count rate of data. |
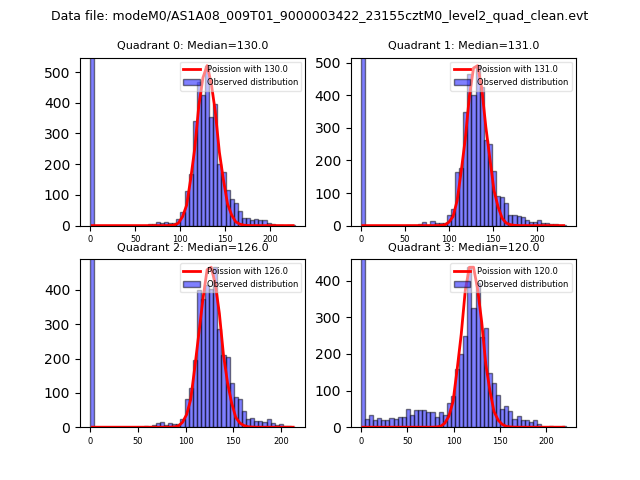 |
 |
| Quadrant-wise count rates Data is divided into 100 sec bins |
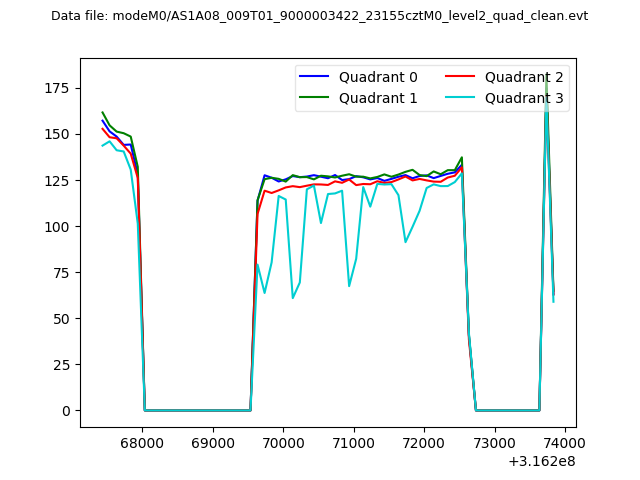 |
|
| Module-wise count rates for Quadrant A Data is divided into 100 sec bins |
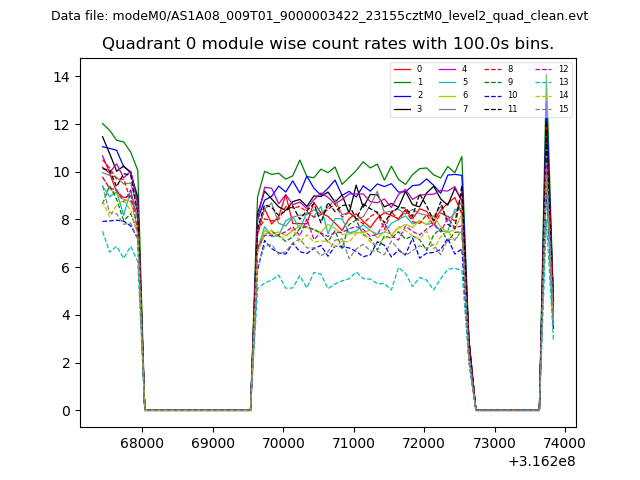 |
 |
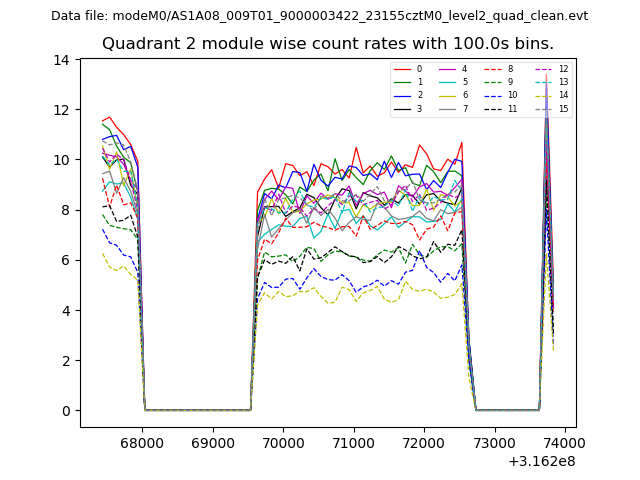
| Module-wise count rates for Quadrant B Data is divided into 100 sec bins |
 |
 |
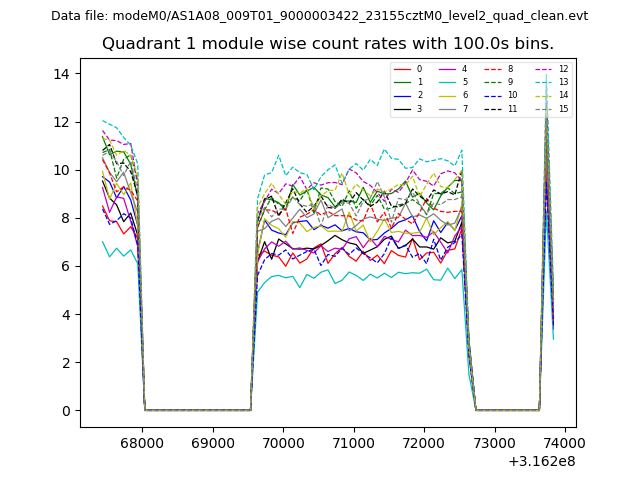
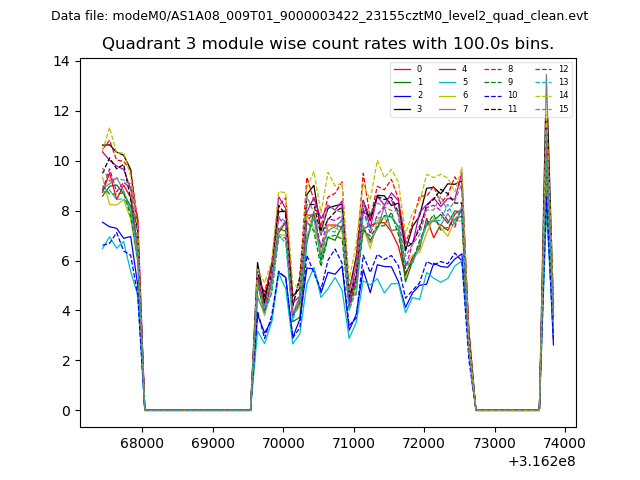
| Module-wise count rates for Quadrant C Data is divided into 100 sec bins |
 |
 |
| Module-wise count rates for Quadrant D Data is divided into 100 sec bins |
 |
 |
| Parameter | Plot |
|---|---|
| CZT HV Monitor | 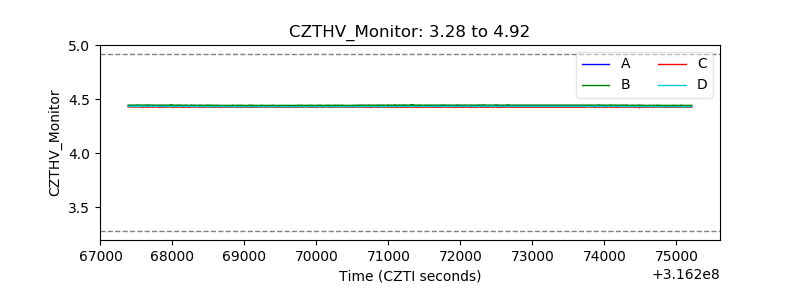 |
| D_VDD | 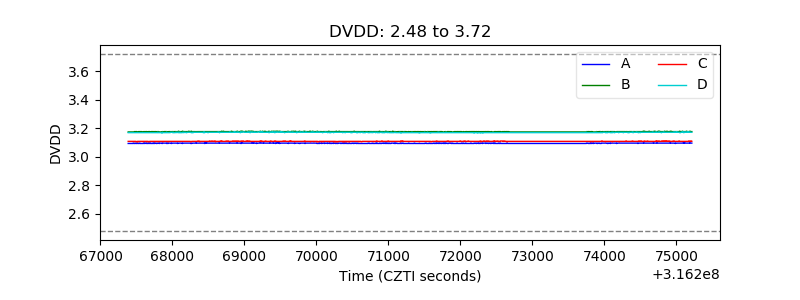 |
| Temperature 1 | 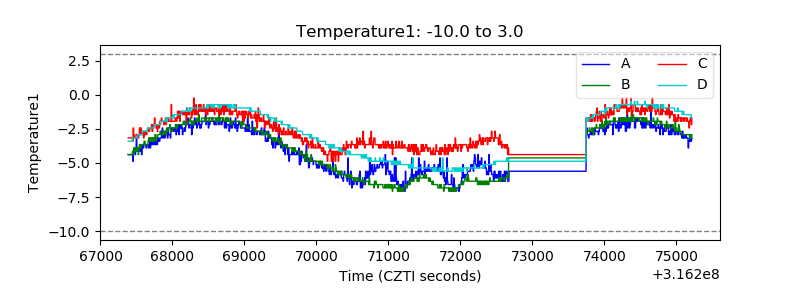 |
| Veto HV Monitor | 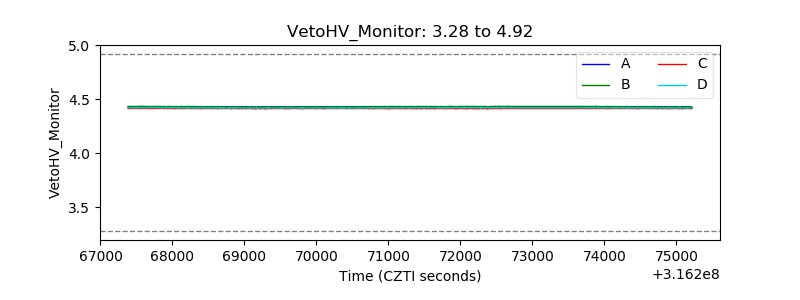 |
| Veto LLD | 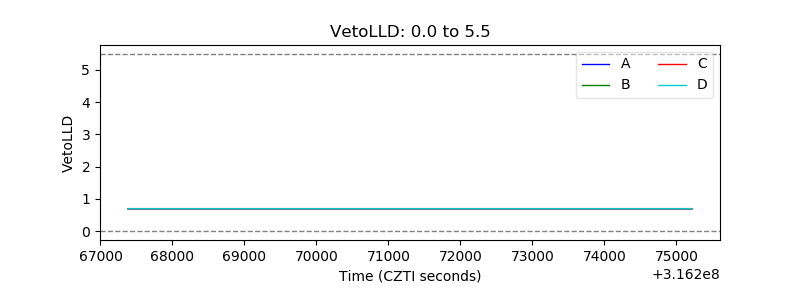 |
| Alpha Counter | 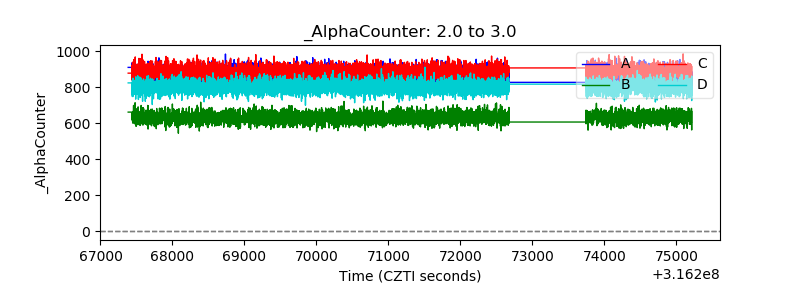 |
| _CPM_Rate |  |
| CZT Counter | 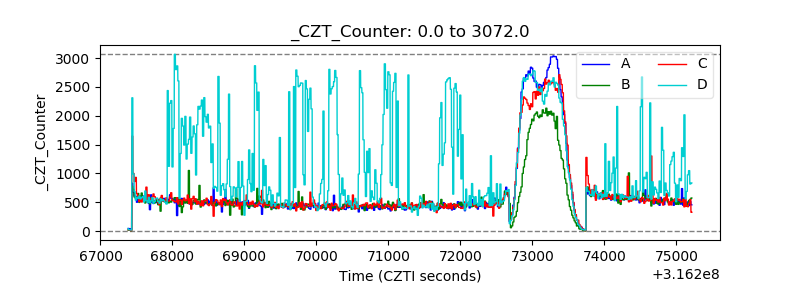 |
| +2.5 Volts monitor |  |
| +5 Volts monitor |  |
| _ROLL_ROT |  |
| _Roll_DEC | 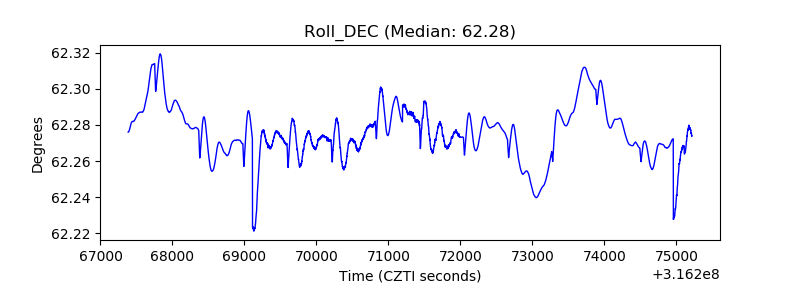 |
| _Roll_RA | 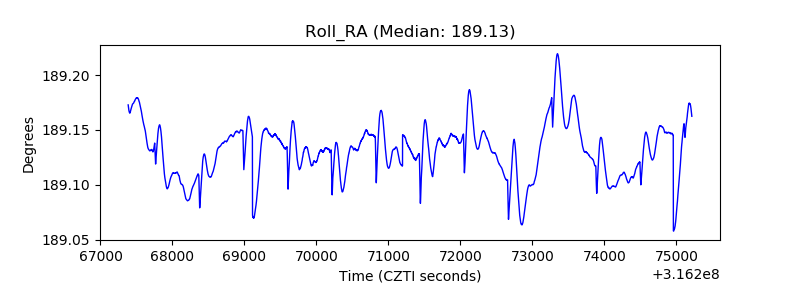 |
| Veto Counter | 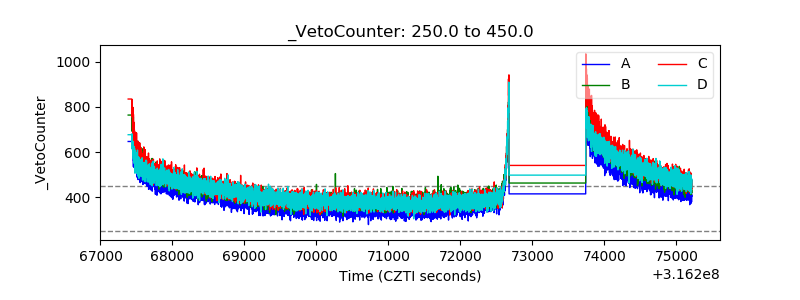 |