| Param | Original file | Final file |
|---|---|---|
| Filename | modeM0/AS1A08_009T01_9000003422_23157cztM0_level2.evt | modeM0/AS1A08_009T01_9000003422_23157cztM0_level2_quad_clean.evt |
| Size (bytes) | 567,432,000 | 71,919,360 |
| Size | 541.1 MB | 68.6 MB |
| Events in quadrant A | 3,209,473 | 457,114 |
| Events in quadrant B | 3,284,710 | 461,866 |
| Events in quadrant C | 3,424,179 | 448,751 |
| Events in quadrant D | 6,834,878 | 365,295 |
| Mode M0 | |||
|---|---|---|---|
| Quadrant | BADHDUFLAG | Total packets | Discarded packets |
| A | 0 | 13799 | 1 |
| B | 0 | 14000 | 1 |
| C | 0 | 14392 | 2 |
| D | 0 | 24850 | 1 |
| Mode SS | |||
|---|---|---|---|
| Quadrant | BADHDUFLAG | Total packets | Discarded packets |
| A | 0 | 130 | 0 |
| B | 0 | 130 | 0 |
| C | 0 | 130 | 0 |
| D | 0 | 130 | 0 |
| Mode M9 | |||
|---|---|---|---|
| Quadrant | BADHDUFLAG | Total packets | Discarded packets |
| A | 0 | 12 | 0 |
| B | 0 | 12 | 0 |
| C | 0 | 12 | 0 |
| D | 0 | 12 | 0 |
| Quadrant | Total seconds | Saturated seconds | Saturation percentage |
|---|---|---|---|
| A | 6364 | 39 | 0.612822% |
| B | 6365 | 41 | 0.644148% |
| C | 6364 | 111 | 1.744186% |
| D | 6364 | 1044 | 16.404777% |
Noise dominated data is calculated using 1-second bins in cleaned event files. If a bin has >2000 counts, and if more than 50% of those come from <1% of pixels, then it is considered to be noise-dominated and hence unusable.
| Quadrant | # 1 sec bins | Bins with >0 counts | Bins with >2000 counts | High rate bins dominated by noise | Noise dominated (total time) | Noise dominated (detector-on time) | Marked lightcurve |
|---|---|---|---|---|---|---|---|
| A | 7594 | 6365 | 0 | 0 | 0.00% | 0.00% | 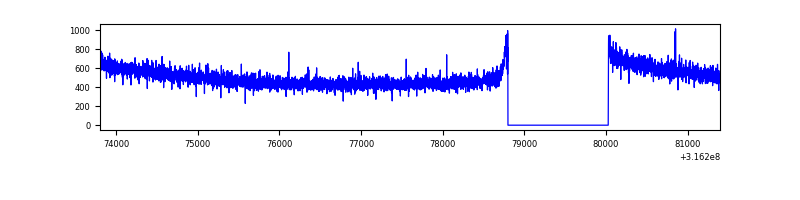 |
| B | 7595 | 6365 | 1 | 1 | 0.01% | 0.02% | 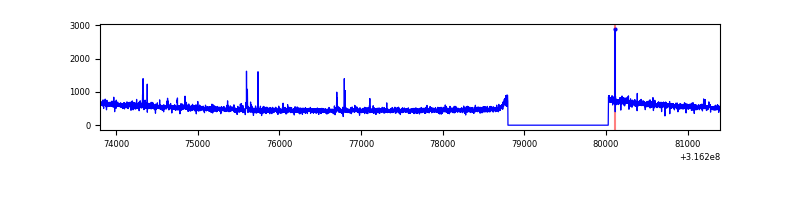 |
| C | 7594 | 6364 | 3 | 3 | 0.04% | 0.05% | 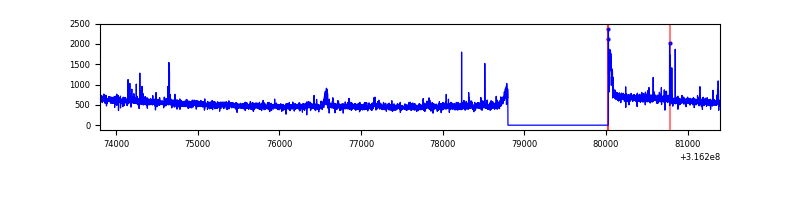 |
| D | 7594 | 6365 | 951 | 951 | 12.52% | 14.94% | 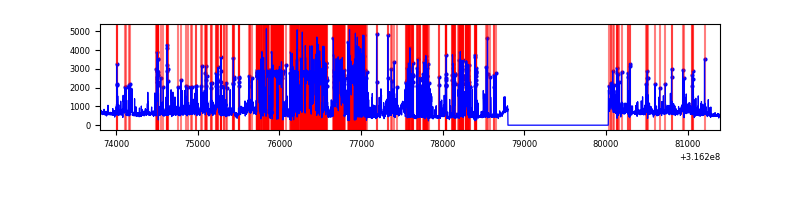 |
Top three noisy pixels from each quadrant. If the there are fewer than three noisy pixels in the level2.evt file, extra rows are filled as -1
| Pixel properties | Quadrant properties | ||||||
|---|---|---|---|---|---|---|---|
| Quadrant | DetID | PixID | Counts | Sigma | Mean | Median | Sigma |
| A | 6 | 16 | 12832 | 74.32 | 829 | 813 | 161.7 |
| A | 13 | 254 | 8738 | 49.0 | 829 | 813 | 161.7 |
| A | 0 | 226 | 7312 | 40.19 | 829 | 813 | 161.7 |
| B | 0 | 190 | 33048 | 208.96 | 827 | 808 | 154.3 |
| B | 12 | 111 | 17715 | 109.58 | 827 | 808 | 154.3 |
| B | 11 | 111 | 15782 | 97.05 | 827 | 808 | 154.3 |
| C | 14 | 238 | 129744 | 695.21 | 803 | 809 | 185.5 |
| C | 0 | 10 | 69180 | 368.65 | 803 | 809 | 185.5 |
| C | 7 | 247 | 57774 | 307.15 | 803 | 809 | 185.5 |
| D | 1 | 239 | 2725206 | 15023.25 | 755 | 733 | 181.4 |
| D | 1 | 52 | 706656 | 3892.59 | 755 | 733 | 181.4 |
| D | 12 | 233 | 299006 | 1644.73 | 755 | 733 | 181.4 |
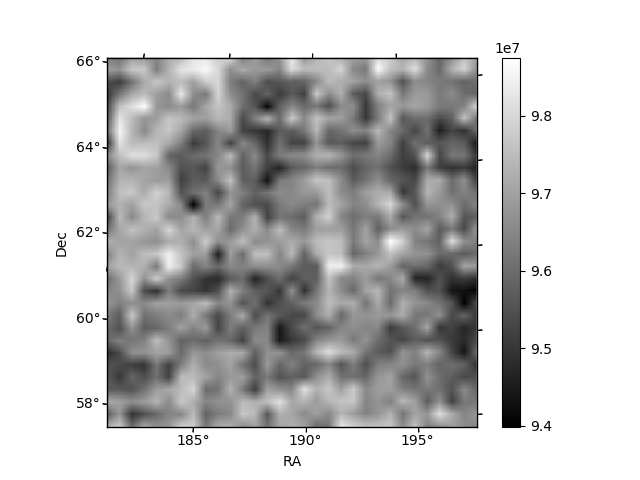
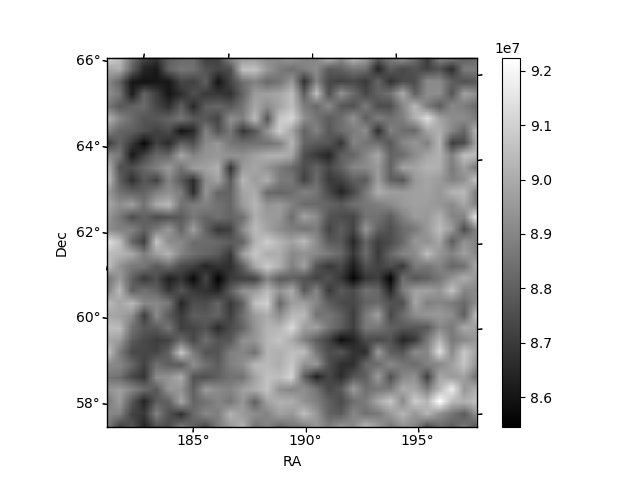
Histogram calculated using DETX and DETY for each event in the final _common_clean file
| Quadrant A | 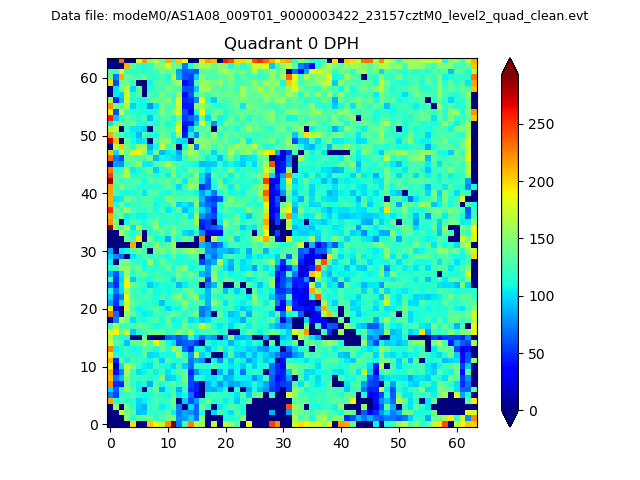 |
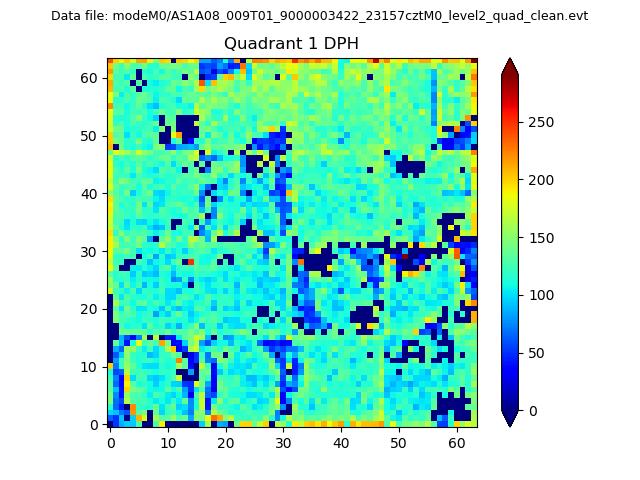 |
Quadrant B |
|---|---|---|---|
| Quadrant D |  |
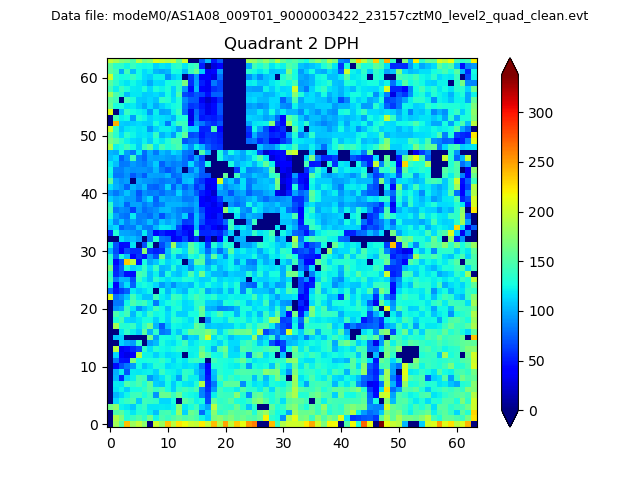 |
Quadrant C |
| Plot type | Count rate plots | Images |
|---|---|---|
| Comparison with Poisson distribution Blue bars denote a histogram of data divided into 1 sec bins. Red curve is a Poisson curve with rate = median count rate of data. |
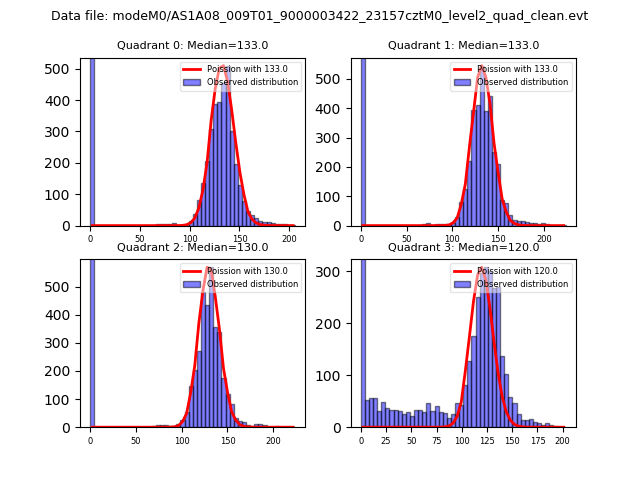 |
 |
| Quadrant-wise count rates Data is divided into 100 sec bins |
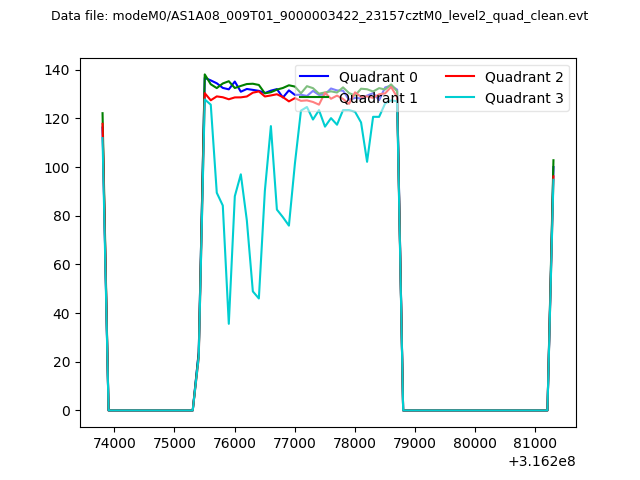 |
|
| Module-wise count rates for Quadrant A Data is divided into 100 sec bins |
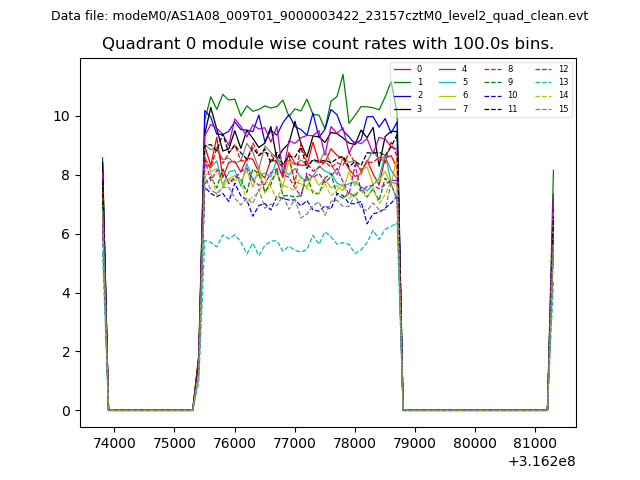 |
 |
| Module-wise count rates for Quadrant B Data is divided into 100 sec bins |
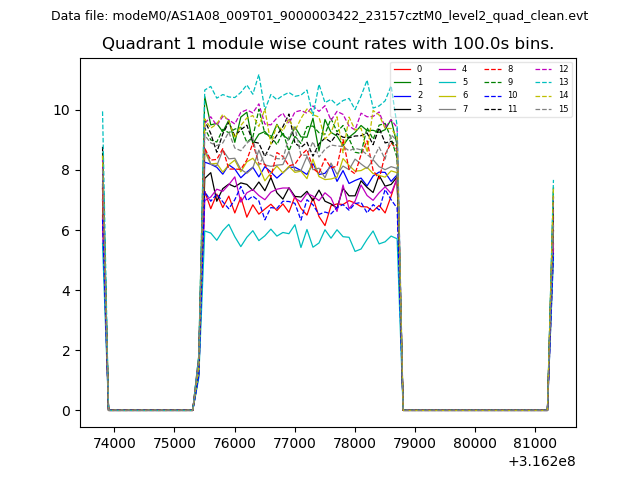 |
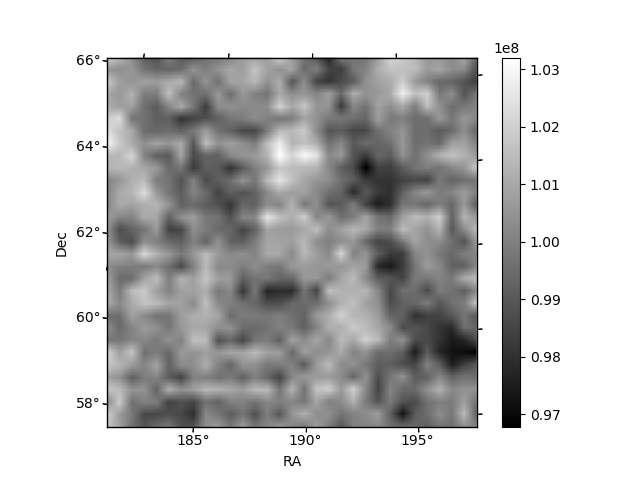 |
| Module-wise count rates for Quadrant C Data is divided into 100 sec bins |
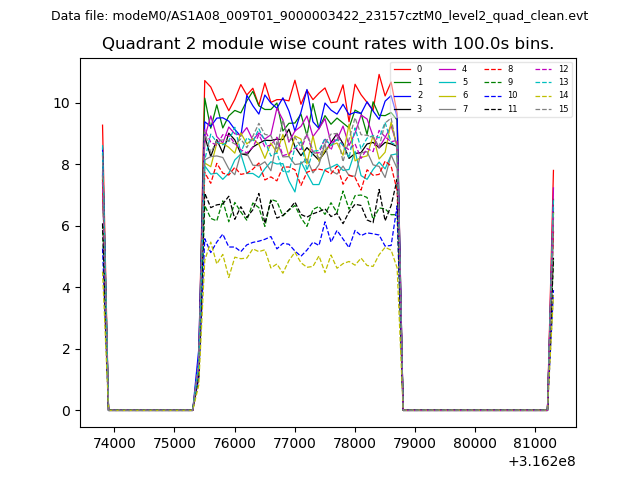 |
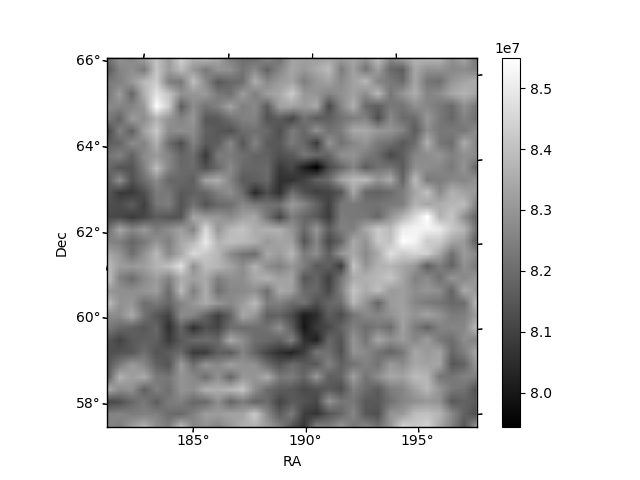 |
| Module-wise count rates for Quadrant D Data is divided into 100 sec bins |
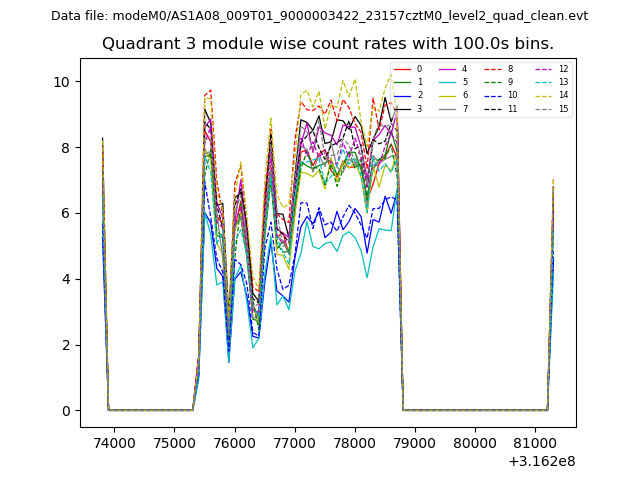 |
 |
| Parameter | Plot |
|---|---|
| CZT HV Monitor | 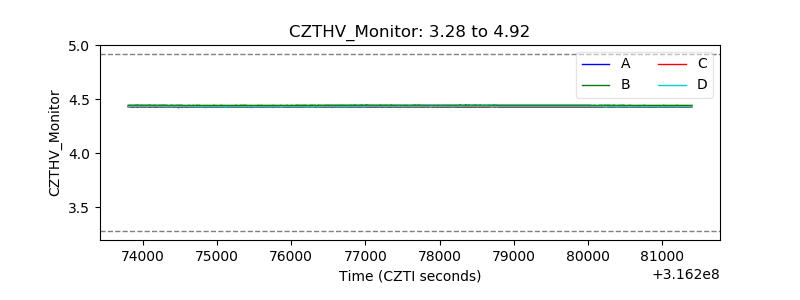 |
| D_VDD | 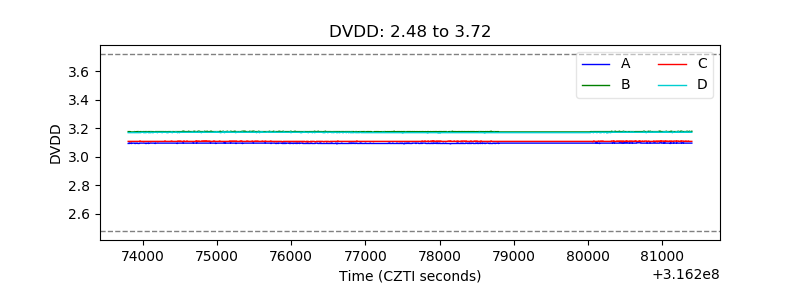 |
| Temperature 1 | 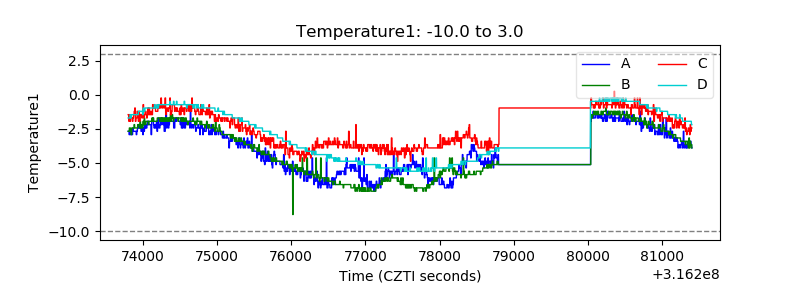 |
| Veto HV Monitor | 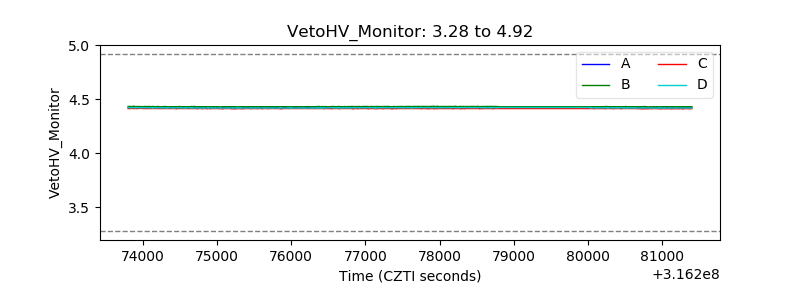 |
| Veto LLD | 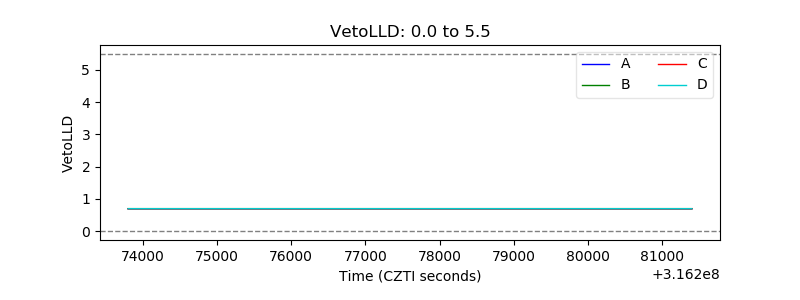 |
| Alpha Counter | 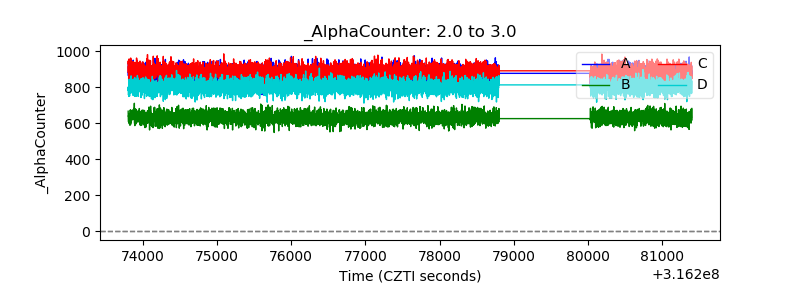 |
| _CPM_Rate | 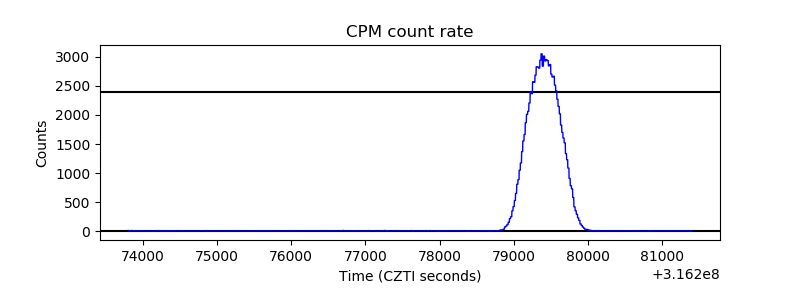 |
| CZT Counter | 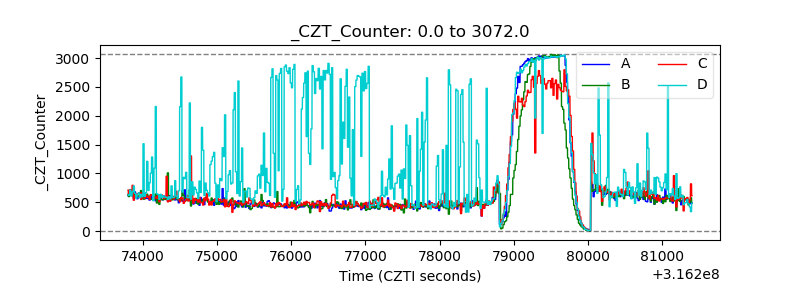 |
| +2.5 Volts monitor |  |
| +5 Volts monitor |  |
| _ROLL_ROT | 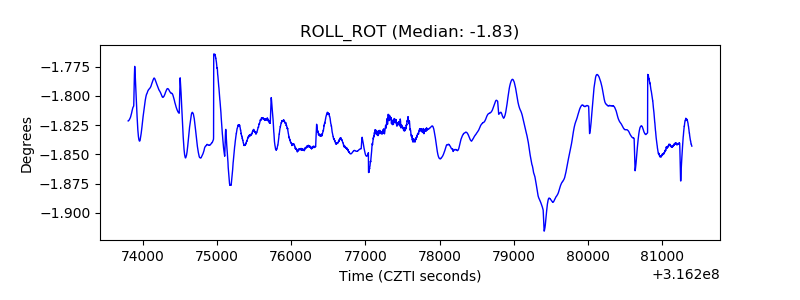 |
| _Roll_DEC | 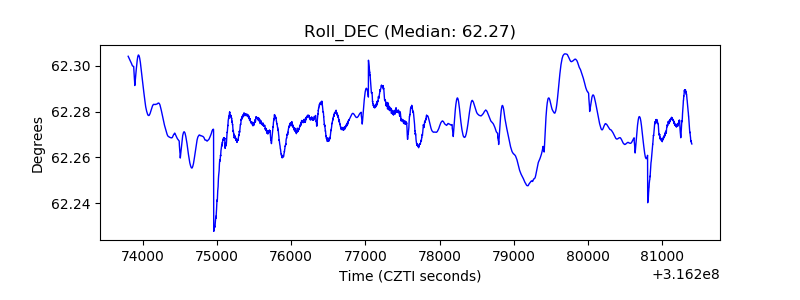 |
| _Roll_RA | 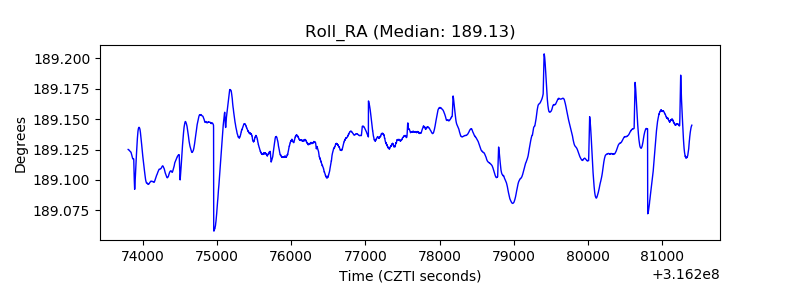 |
| Veto Counter | 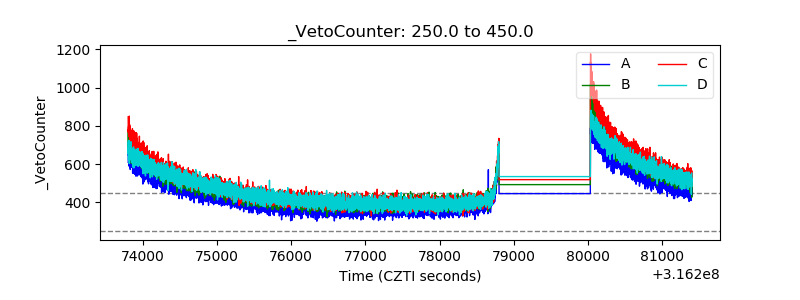 |