| Param | Original file | Final file |
|---|---|---|
| Filename | modeM0/AS1A08_009T01_9000003422_23158cztM0_level2.evt | modeM0/AS1A08_009T01_9000003422_23158cztM0_level2_quad_clean.evt |
| Size (bytes) | 487,563,840 | 89,032,320 |
| Size | 465.0 MB | 84.9 MB |
| Events in quadrant A | 3,272,827 | 569,321 |
| Events in quadrant B | 3,359,844 | 578,860 |
| Events in quadrant C | 3,808,734 | 562,273 |
| Events in quadrant D | 3,902,227 | 551,536 |
| Mode M0 | |||
|---|---|---|---|
| Quadrant | BADHDUFLAG | Total packets | Discarded packets |
| A | 0 | 13941 | 2 |
| B | 0 | 14150 | 2 |
| C | 0 | 15436 | 3 |
| D | 0 | 15980 | 2 |
| Mode SS | |||
|---|---|---|---|
| Quadrant | BADHDUFLAG | Total packets | Discarded packets |
| A | 0 | 126 | 0 |
| B | 0 | 126 | 0 |
| C | 0 | 126 | 0 |
| D | 0 | 126 | 0 |
| Mode M9 | |||
|---|---|---|---|
| Quadrant | BADHDUFLAG | Total packets | Discarded packets |
| A | 0 | 19 | 0 |
| B | 0 | 20 | 0 |
| C | 0 | 20 | 0 |
| D | 0 | 20 | 0 |
| Quadrant | Total seconds | Saturated seconds | Saturation percentage |
|---|---|---|---|
| A | 6224 | 63 | 1.012211% |
| B | 6224 | 77 | 1.237147% |
| C | 6223 | 225 | 3.615619% |
| D | 6223 | 184 | 2.956773% |
Noise dominated data is calculated using 1-second bins in cleaned event files. If a bin has >2000 counts, and if more than 50% of those come from <1% of pixels, then it is considered to be noise-dominated and hence unusable.
| Quadrant | # 1 sec bins | Bins with >0 counts | Bins with >2000 counts | High rate bins dominated by noise | Noise dominated (total time) | Noise dominated (detector-on time) | Marked lightcurve |
|---|---|---|---|---|---|---|---|
| A | 7529 | 6224 | 0 | 0 | 0.00% | 0.00% | 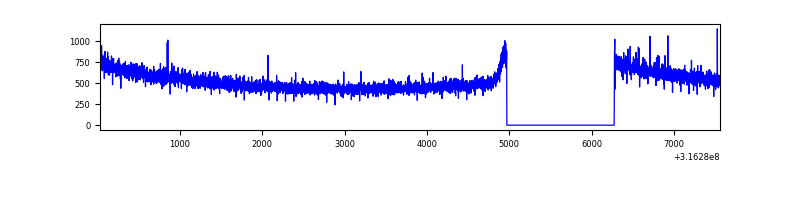 |
| B | 7529 | 6224 | 5 | 5 | 0.07% | 0.08% | 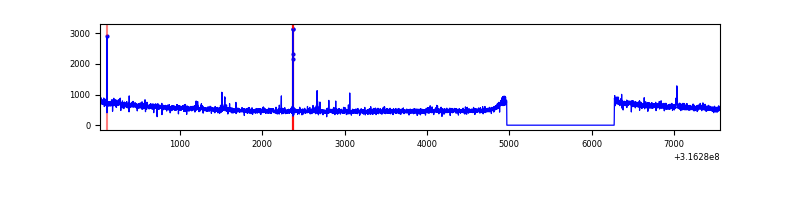 |
| C | 7528 | 6223 | 25 | 25 | 0.33% | 0.40% | 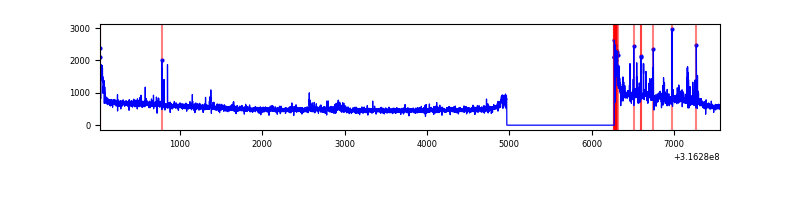 |
| D | 7528 | 6224 | 102 | 102 | 1.35% | 1.64% | 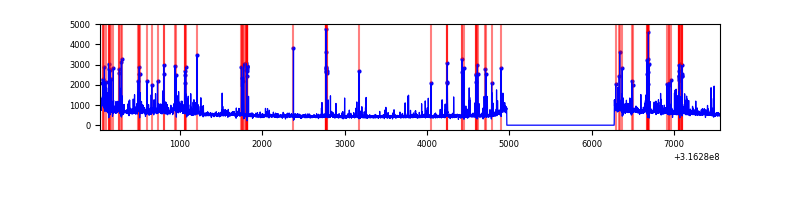 |
Top three noisy pixels from each quadrant. If the there are fewer than three noisy pixels in the level2.evt file, extra rows are filled as -1
| Pixel properties | Quadrant properties | ||||||
|---|---|---|---|---|---|---|---|
| Quadrant | DetID | PixID | Counts | Sigma | Mean | Median | Sigma |
| A | 4 | 2 | 10173 | 55.91 | 845 | 830 | 167.1 |
| A | 13 | 254 | 9421 | 51.41 | 845 | 830 | 167.1 |
| A | 6 | 16 | 7428 | 39.49 | 845 | 830 | 167.1 |
| B | 0 | 190 | 21344 | 129.82 | 846 | 829 | 158.0 |
| B | 0 | 228 | 19232 | 116.45 | 846 | 829 | 158.0 |
| B | 12 | 111 | 17428 | 105.04 | 846 | 829 | 158.0 |
| C | 8 | 208 | 270259 | 1437.94 | 821 | 829 | 187.4 |
| C | 0 | 10 | 133294 | 706.96 | 821 | 829 | 187.4 |
| C | 14 | 238 | 132696 | 703.77 | 821 | 829 | 187.4 |
| D | 1 | 52 | 396285 | 1972.47 | 829 | 808 | 200.5 |
| D | 12 | 233 | 130917 | 648.93 | 829 | 808 | 200.5 |
| D | 7 | 38 | 71883 | 354.49 | 829 | 808 | 200.5 |
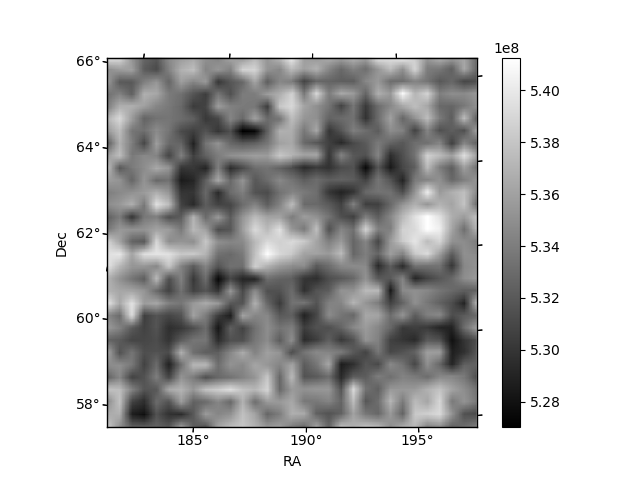
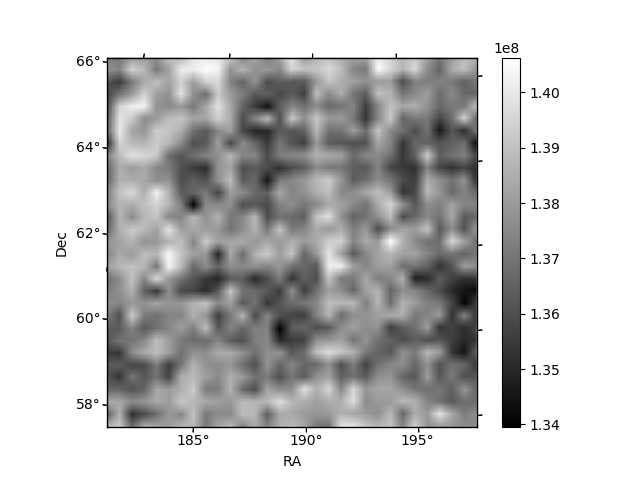
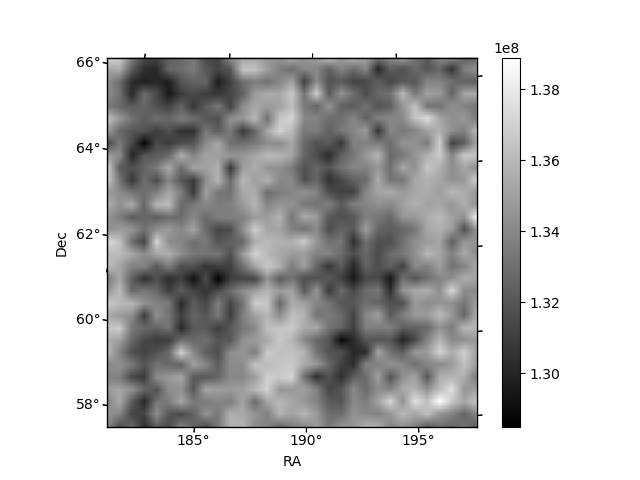
Histogram calculated using DETX and DETY for each event in the final _common_clean file
| Quadrant A | 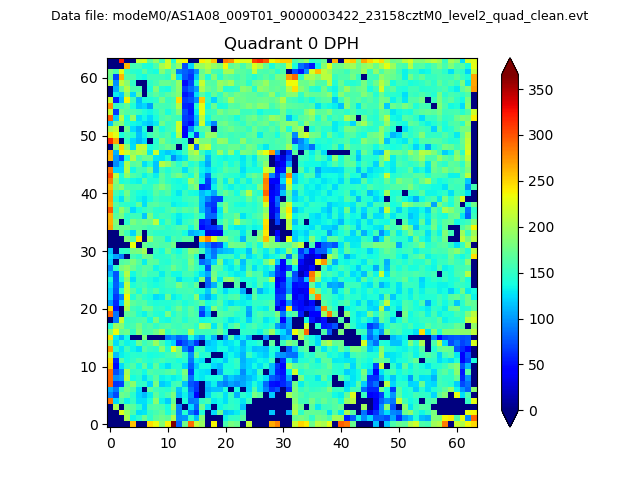 |
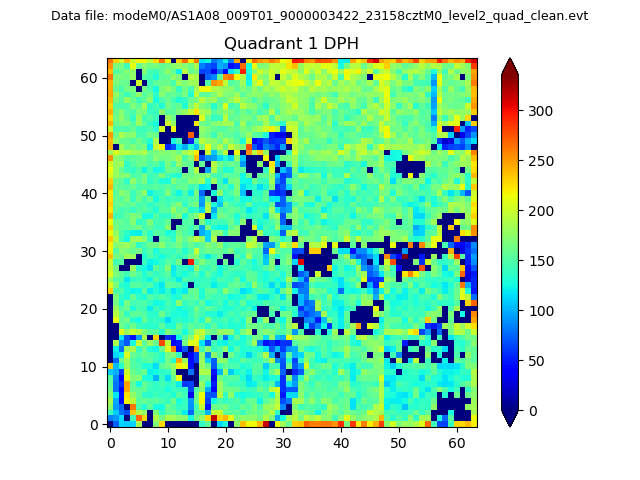 |
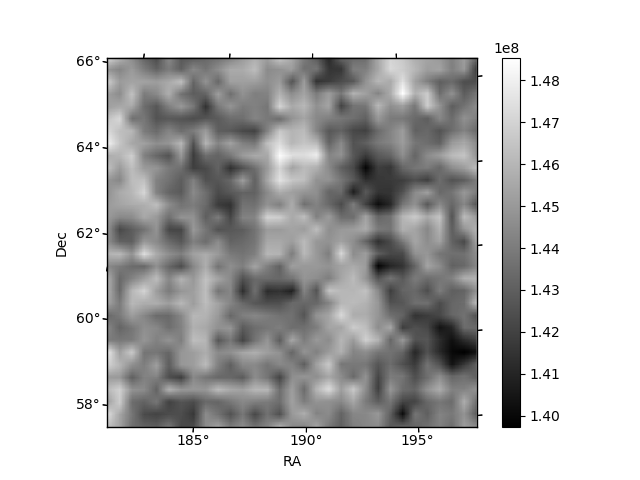
Quadrant B |
|---|---|---|---|
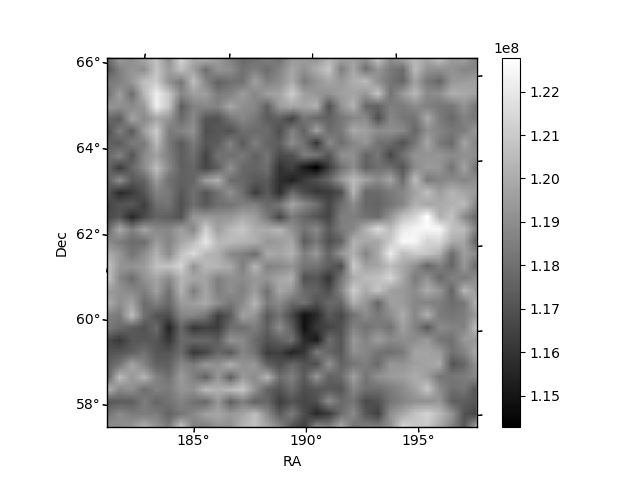
| Quadrant D | 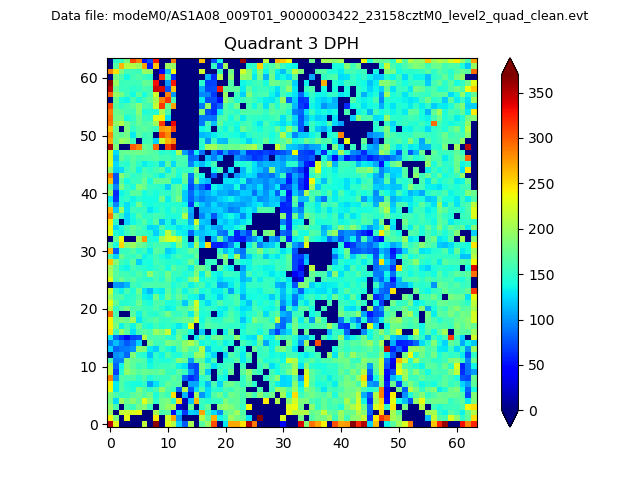 |
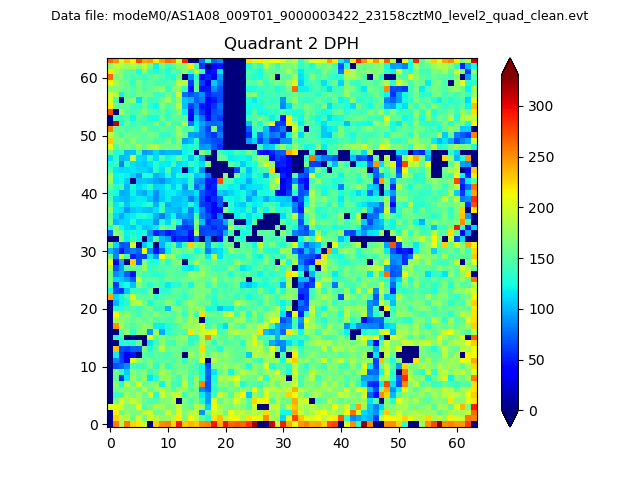 |
Quadrant C |
| Plot type | Count rate plots | Images |
|---|---|---|
| Comparison with Poisson distribution Blue bars denote a histogram of data divided into 1 sec bins. Red curve is a Poisson curve with rate = median count rate of data. |
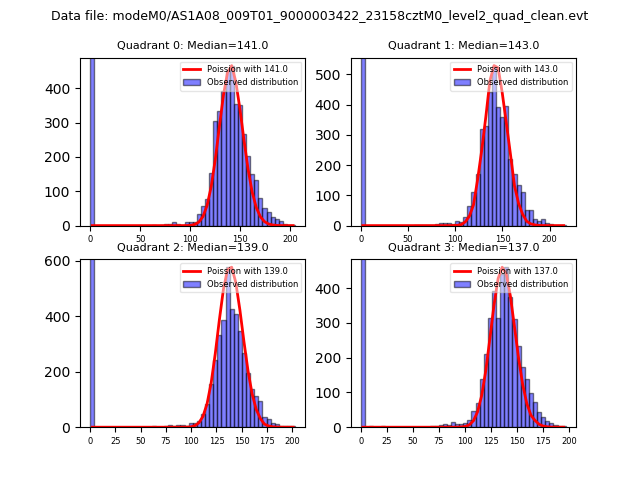 |
 |
| Quadrant-wise count rates Data is divided into 100 sec bins |
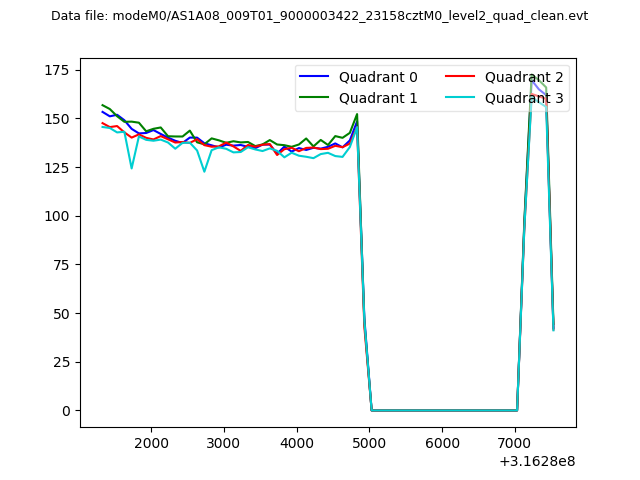 |
|
| Module-wise count rates for Quadrant A Data is divided into 100 sec bins |
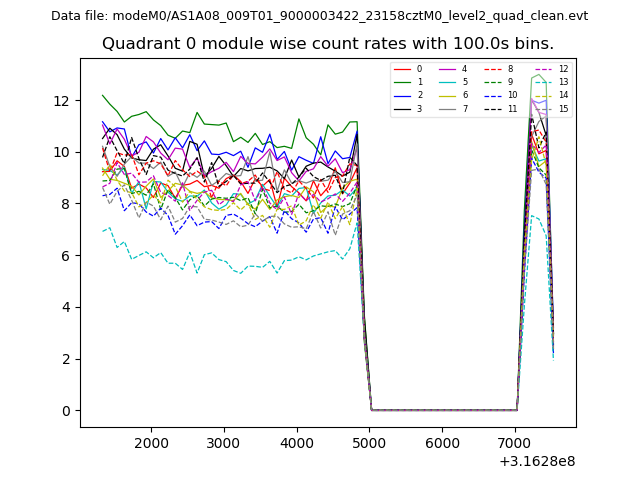 |
 |
| Module-wise count rates for Quadrant B Data is divided into 100 sec bins |
 |
 |
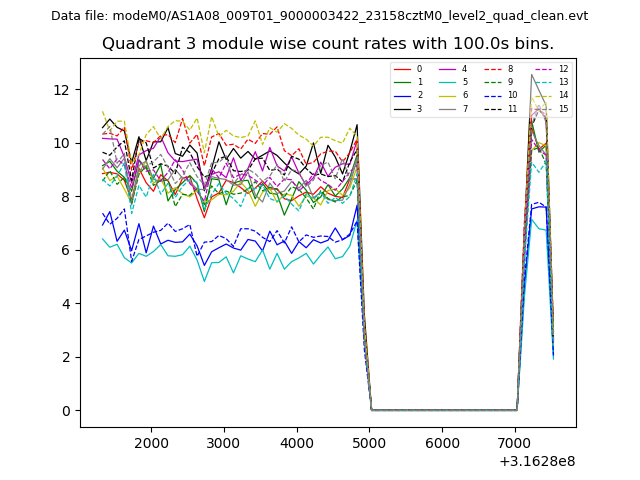
| Module-wise count rates for Quadrant C Data is divided into 100 sec bins |
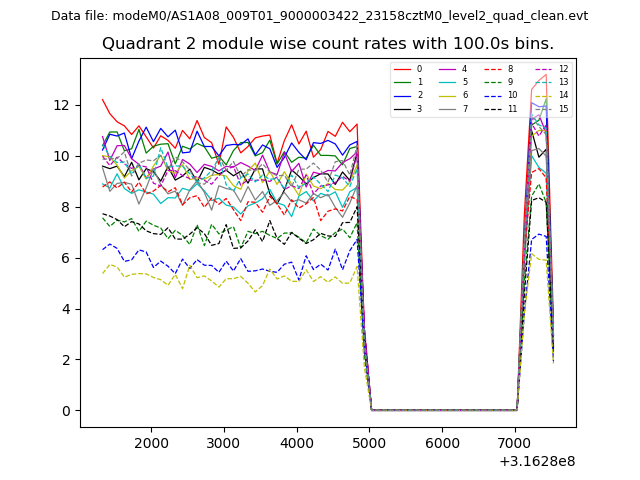 |
 |
| Module-wise count rates for Quadrant D Data is divided into 100 sec bins |
 |
 |
| Parameter | Plot |
|---|---|
| CZT HV Monitor |  |
| D_VDD | 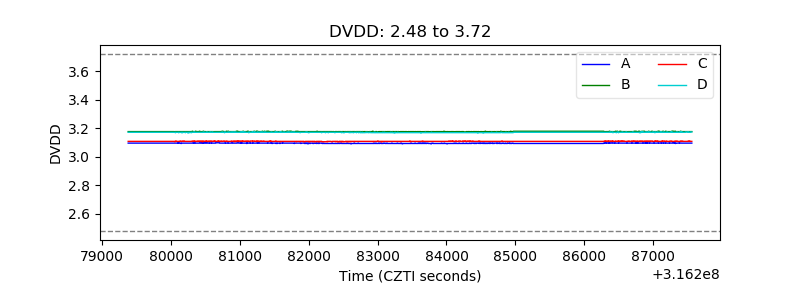 |
| Temperature 1 | 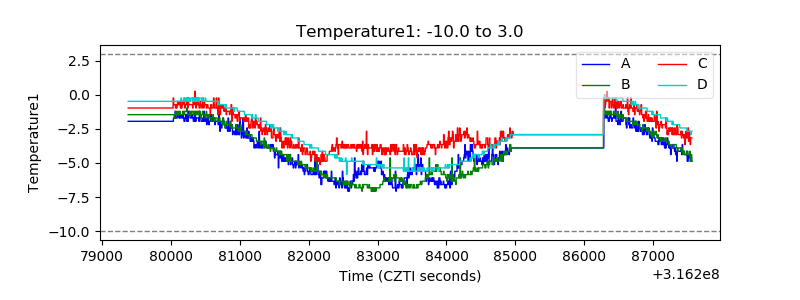 |
| Veto HV Monitor | 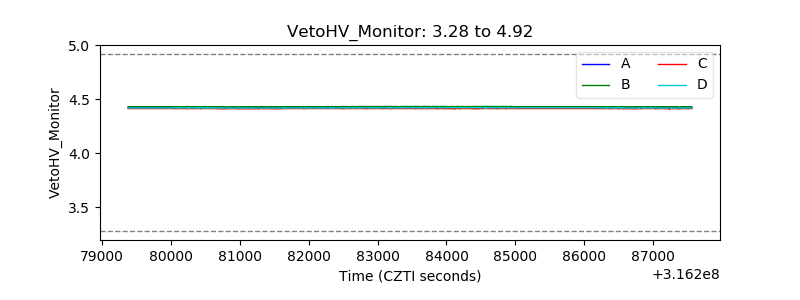 |
| Veto LLD | 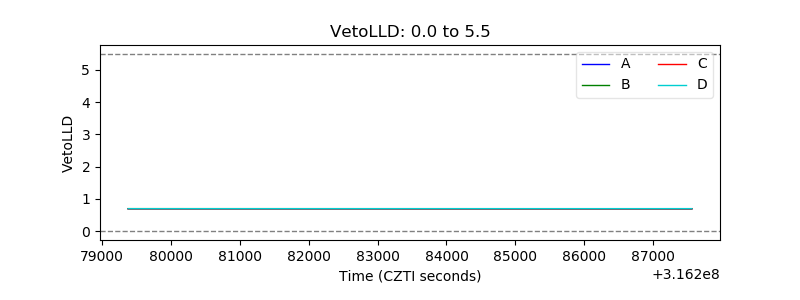 |
| Alpha Counter | 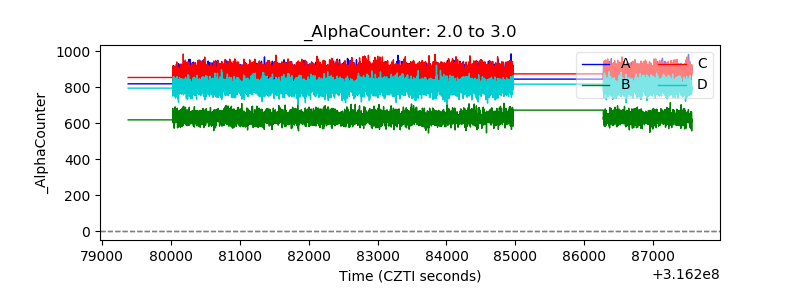 |
| _CPM_Rate | 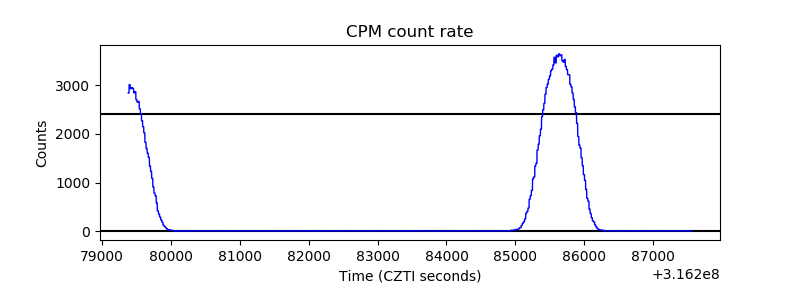 |
| CZT Counter | 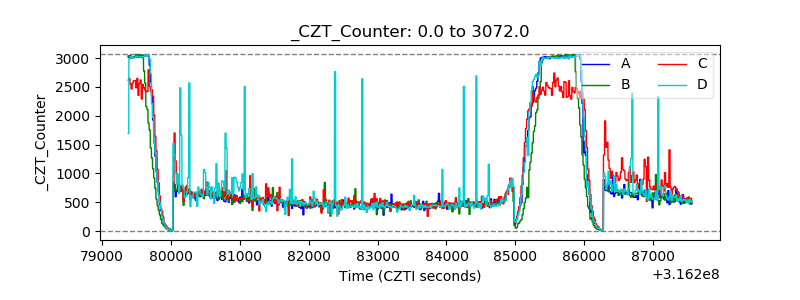 |
| +2.5 Volts monitor | 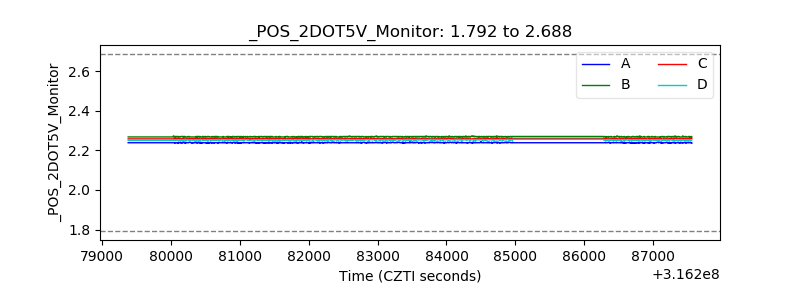 |
| +5 Volts monitor |  |
| _ROLL_ROT | 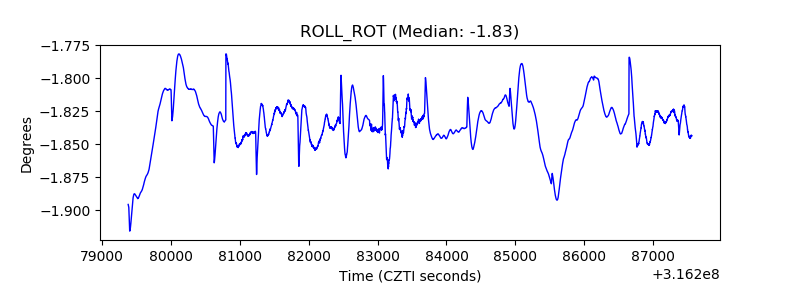 |
| _Roll_DEC | 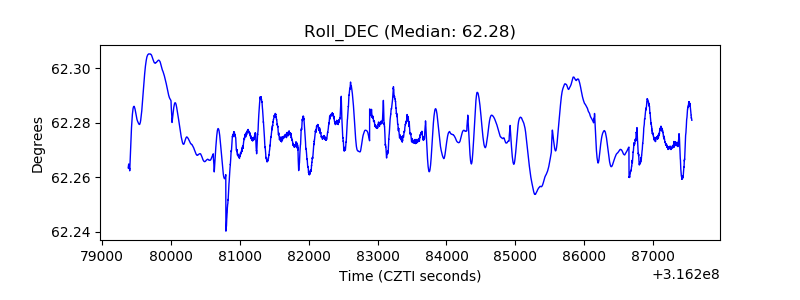 |
| _Roll_RA | 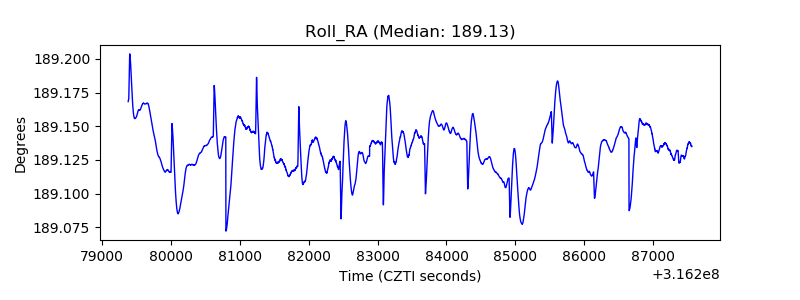 |
| Veto Counter | 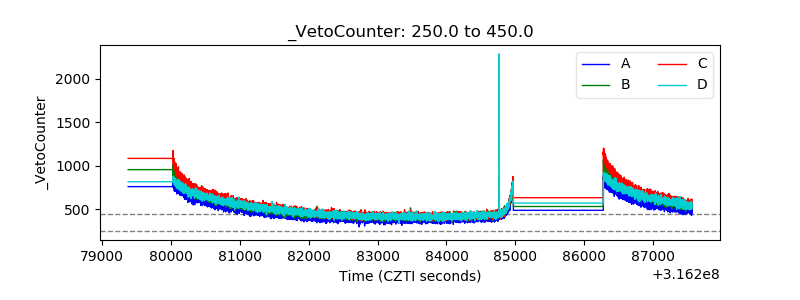 |