| Param | Original file | Final file |
|---|---|---|
| Filename | modeM0/AS1A08_009T01_9000003422_23159cztM0_level2.evt | modeM0/AS1A08_009T01_9000003422_23159cztM0_level2_quad_clean.evt |
| Size (bytes) | 487,681,920 | 105,629,760 |
| Size | 465.1 MB | 100.7 MB |
| Events in quadrant A | 3,224,905 | 695,069 |
| Events in quadrant B | 3,435,497 | 716,227 |
| Events in quadrant C | 3,824,734 | 695,208 |
| Events in quadrant D | 3,871,278 | 667,671 |
| Mode M0 | |||
|---|---|---|---|
| Quadrant | BADHDUFLAG | Total packets | Discarded packets |
| A | 0 | 13615 | 2 |
| B | 0 | 14201 | 2 |
| C | 0 | 15212 | 2 |
| D | 0 | 15784 | 3 |
| Mode SS | |||
|---|---|---|---|
| Quadrant | BADHDUFLAG | Total packets | Discarded packets |
| A | 0 | 124 | 0 |
| B | 0 | 124 | 0 |
| C | 0 | 124 | 0 |
| D | 0 | 124 | 0 |
| Mode M9 | |||
|---|---|---|---|
| Quadrant | BADHDUFLAG | Total packets | Discarded packets |
| A | 0 | 24 | 0 |
| B | 0 | 25 | 0 |
| C | 0 | 25 | 0 |
| D | 0 | 25 | 0 |
| Quadrant | Total seconds | Saturated seconds | Saturation percentage |
|---|---|---|---|
| A | 6085 | 73 | 1.199671% |
| B | 6085 | 150 | 2.465078% |
| C | 6085 | 238 | 3.911257% |
| D | 6084 | 199 | 3.270874% |
Noise dominated data is calculated using 1-second bins in cleaned event files. If a bin has >2000 counts, and if more than 50% of those come from <1% of pixels, then it is considered to be noise-dominated and hence unusable.
| Quadrant | # 1 sec bins | Bins with >0 counts | Bins with >2000 counts | High rate bins dominated by noise | Noise dominated (total time) | Noise dominated (detector-on time) | Marked lightcurve |
|---|---|---|---|---|---|---|---|
| A | 7440 | 6086 | 0 | 0 | 0.00% | 0.00% | 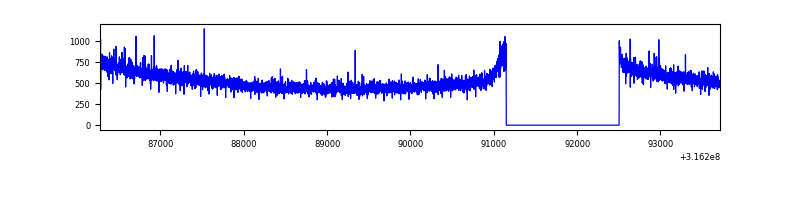 |
| B | 7440 | 6086 | 45 | 45 | 0.60% | 0.74% | 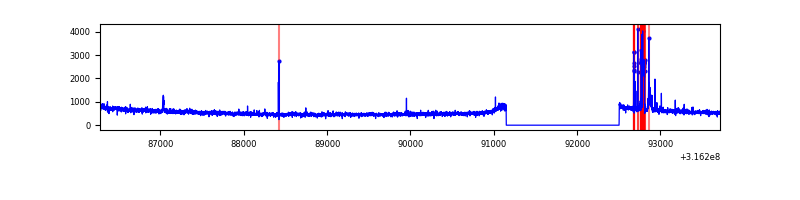 |
| C | 7440 | 6086 | 38 | 38 | 0.51% | 0.62% | 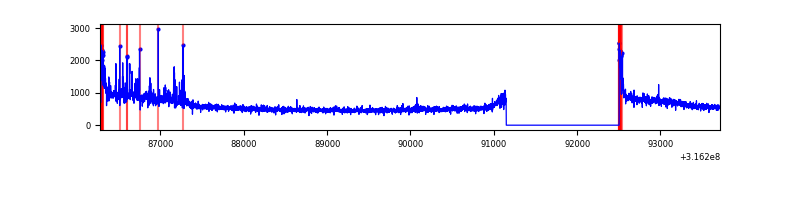 |
| D | 7439 | 6084 | 116 | 116 | 1.56% | 1.91% | 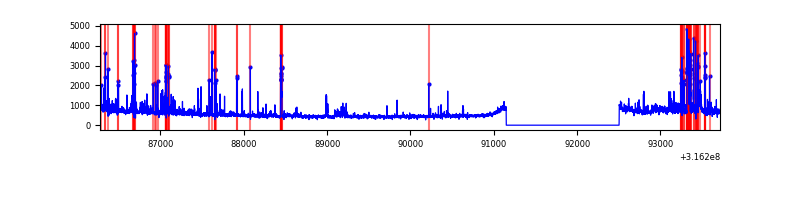 |
Top three noisy pixels from each quadrant. If the there are fewer than three noisy pixels in the level2.evt file, extra rows are filled as -1
| Pixel properties | Quadrant properties | ||||||
|---|---|---|---|---|---|---|---|
| Quadrant | DetID | PixID | Counts | Sigma | Mean | Median | Sigma |
| A | 4 | 2 | 14770 | 84.66 | 831 | 818 | 164.8 |
| A | 13 | 254 | 8920 | 49.16 | 831 | 818 | 164.8 |
| A | 0 | 226 | 7272 | 39.16 | 831 | 818 | 164.8 |
| B | 10 | 247 | 138661 | 906.4 | 830 | 811 | 152.1 |
| B | 0 | 190 | 45238 | 292.12 | 830 | 811 | 152.1 |
| B | 12 | 111 | 16864 | 105.55 | 830 | 811 | 152.1 |
| C | 8 | 208 | 356350 | 1914.48 | 813 | 823 | 185.7 |
| C | 14 | 238 | 131455 | 703.44 | 813 | 823 | 185.7 |
| C | 0 | 10 | 127835 | 683.95 | 813 | 823 | 185.7 |
| D | 1 | 52 | 519646 | 2675.24 | 816 | 796 | 193.9 |
| D | 7 | 238 | 150437 | 771.56 | 816 | 796 | 193.9 |
| D | 13 | 153 | 32875 | 165.4 | 816 | 796 | 193.9 |
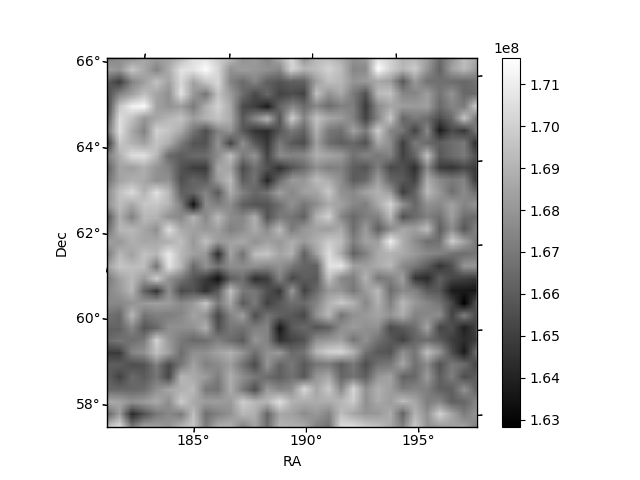
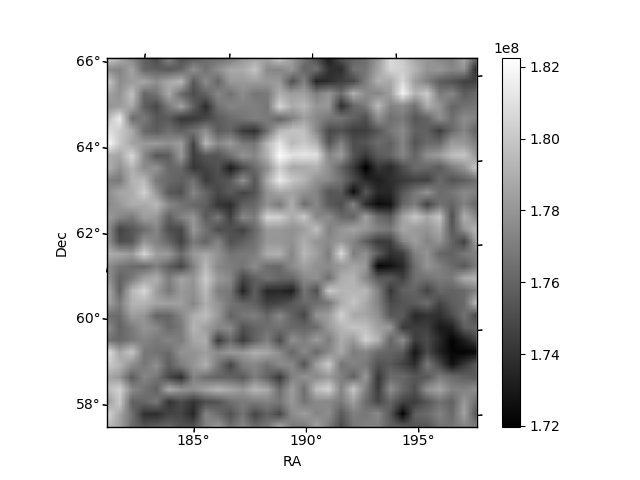
Histogram calculated using DETX and DETY for each event in the final _common_clean file
| Quadrant A | 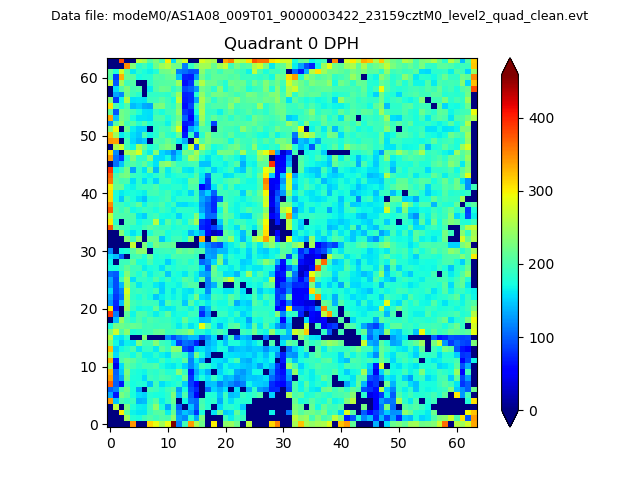 |
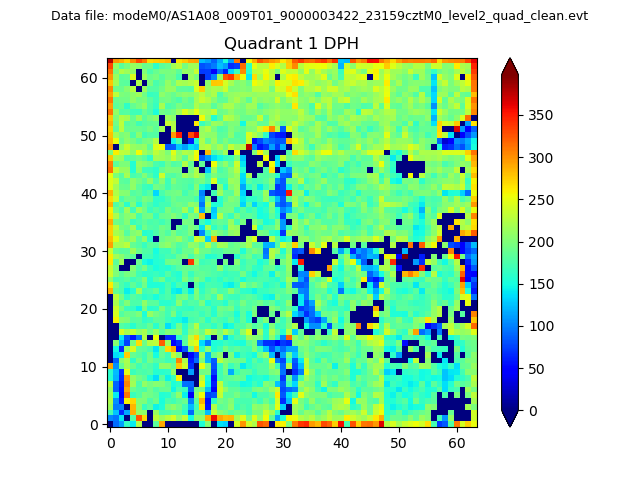 |
Quadrant B |
|---|---|---|---|
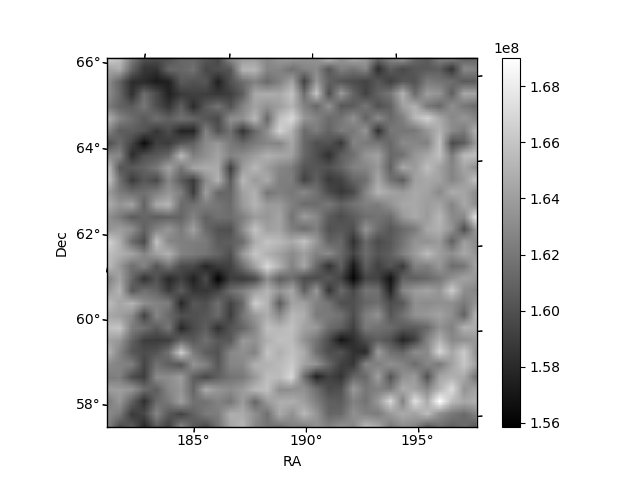
| Quadrant D |  |
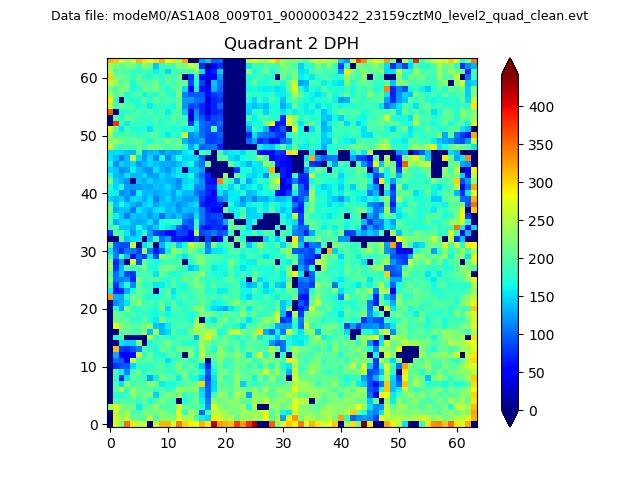 |
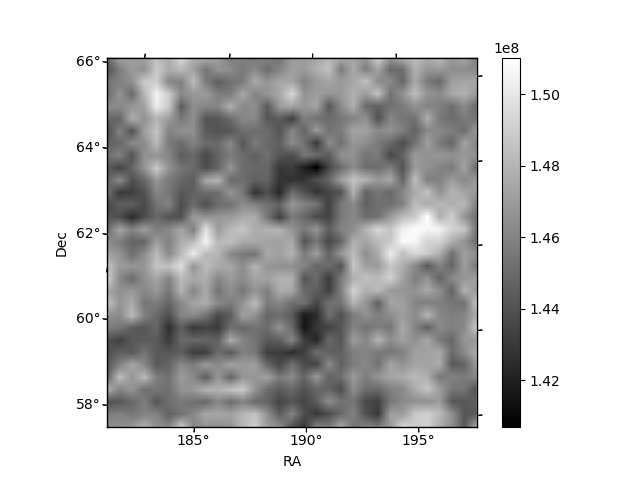
Quadrant C |
| Plot type | Count rate plots | Images |
|---|---|---|
| Comparison with Poisson distribution Blue bars denote a histogram of data divided into 1 sec bins. Red curve is a Poisson curve with rate = median count rate of data. |
 |
 |
| Quadrant-wise count rates Data is divided into 100 sec bins |
 |
|
| Module-wise count rates for Quadrant A Data is divided into 100 sec bins |
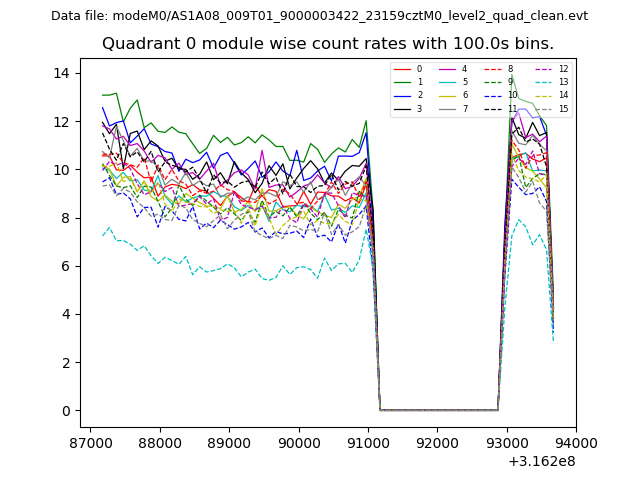 |
 |
| Module-wise count rates for Quadrant B Data is divided into 100 sec bins |
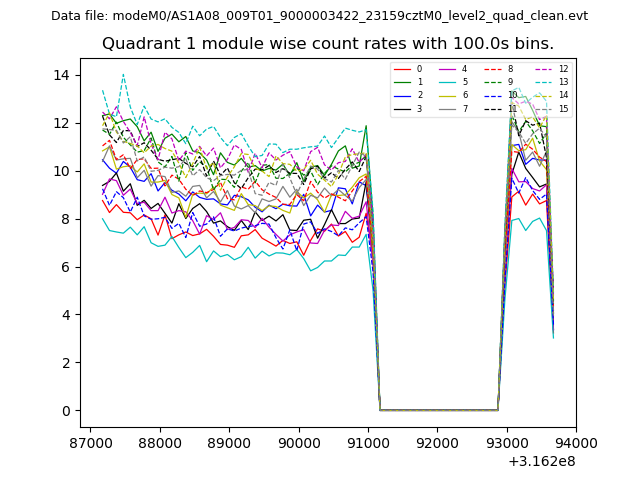 |
 |
| Module-wise count rates for Quadrant C Data is divided into 100 sec bins |
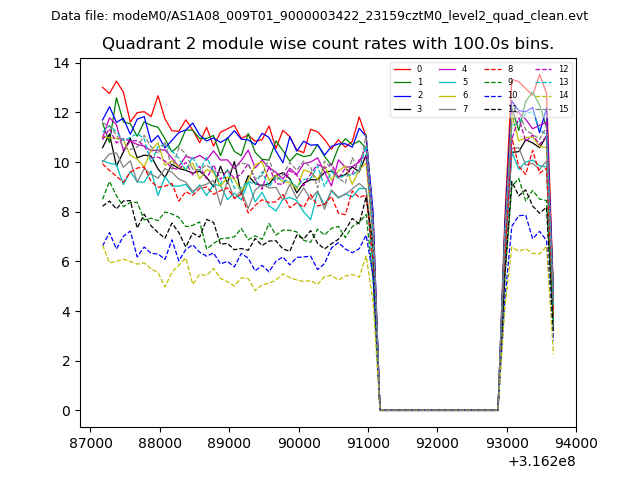 |
 |
| Module-wise count rates for Quadrant D Data is divided into 100 sec bins |
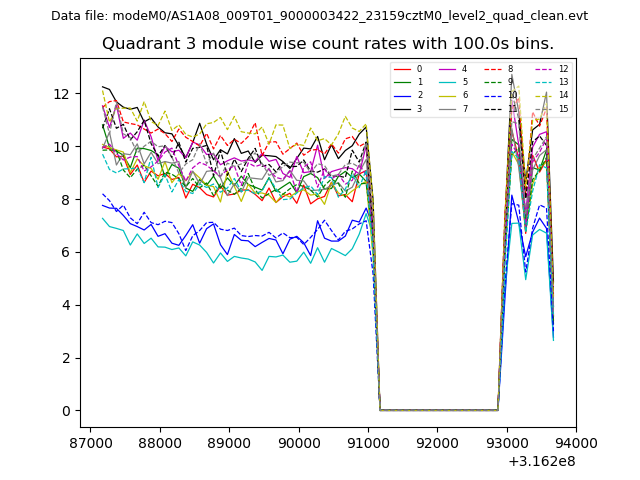 |
 |
| Parameter | Plot |
|---|---|
| CZT HV Monitor | 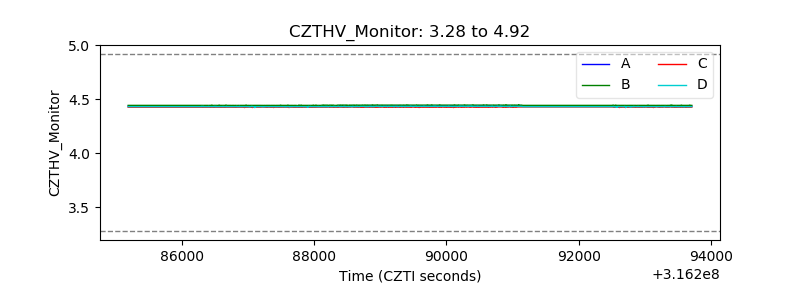 |
| D_VDD | 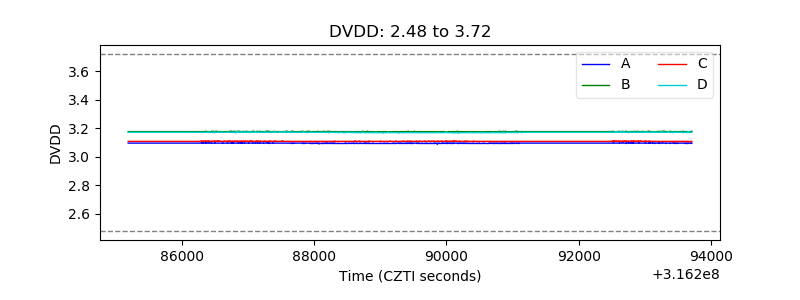 |
| Temperature 1 | 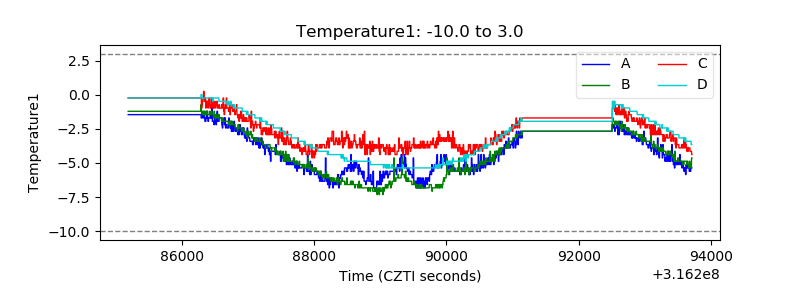 |
| Veto HV Monitor | 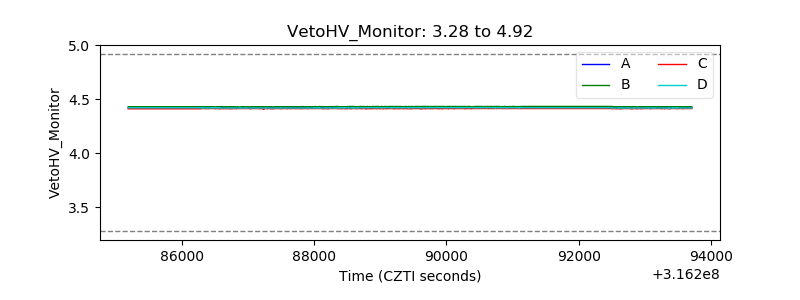 |
| Veto LLD | 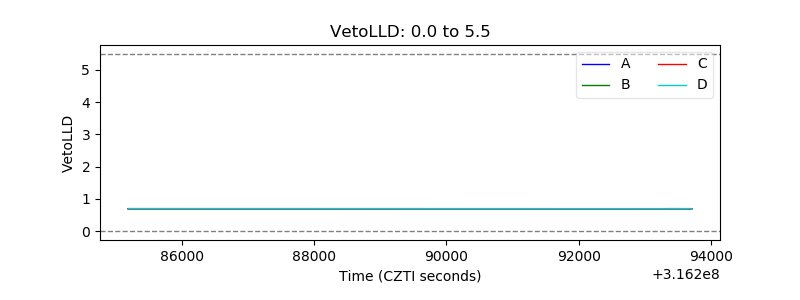 |
| Alpha Counter |  |
| _CPM_Rate |  |
| CZT Counter | 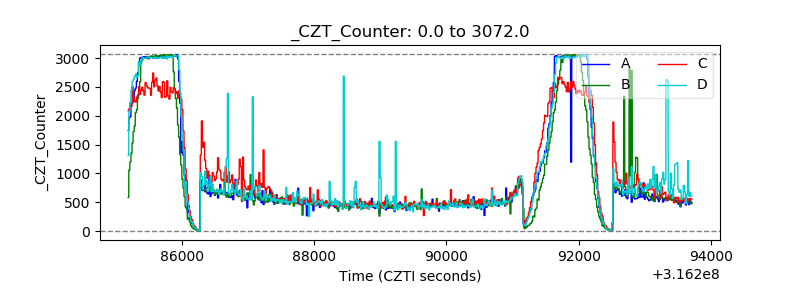 |
| +2.5 Volts monitor |  |
| +5 Volts monitor |  |
| _ROLL_ROT | 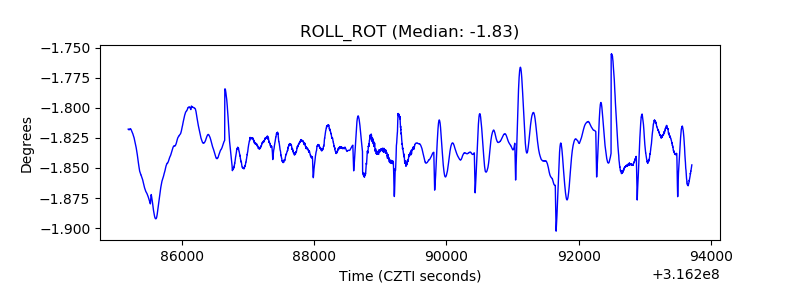 |
| _Roll_DEC | 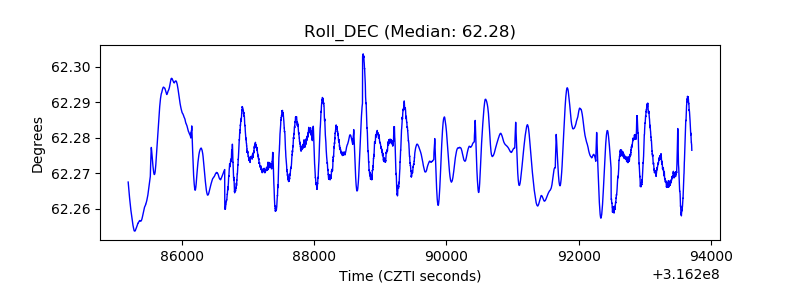 |
| _Roll_RA | 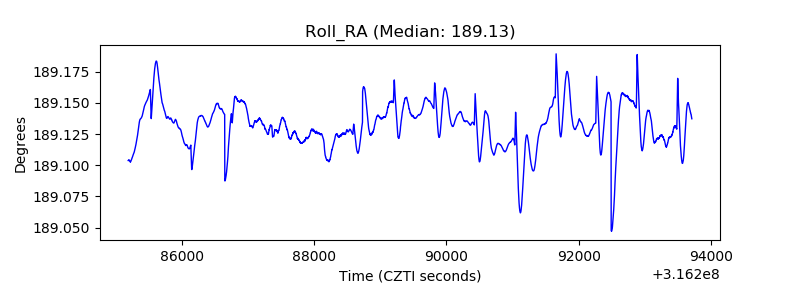 |
| Veto Counter | 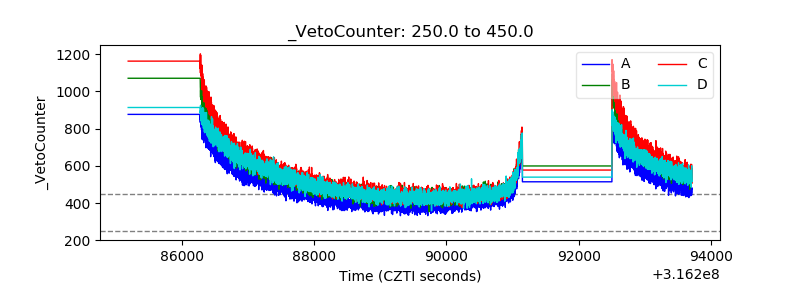 |