| Param | Original file | Final file |
|---|---|---|
| Filename | modeM0/AS1A08_009T01_9000003422_23160cztM0_level2.evt | modeM0/AS1A08_009T01_9000003422_23160cztM0_level2_quad_clean.evt |
| Size (bytes) | 485,254,080 | 119,545,920 |
| Size | 462.8 MB | 114.0 MB |
| Events in quadrant A | 3,081,742 | 801,563 |
| Events in quadrant B | 3,304,660 | 832,527 |
| Events in quadrant C | 4,088,427 | 794,992 |
| Events in quadrant D | 3,808,929 | 767,418 |
| Mode M0 | |||
|---|---|---|---|
| Quadrant | BADHDUFLAG | Total packets | Discarded packets |
| A | 0 | 13054 | 2 |
| B | 0 | 13644 | 1 |
| C | 0 | 16074 | 1 |
| D | 0 | 15587 | 1 |
| Mode SS | |||
|---|---|---|---|
| Quadrant | BADHDUFLAG | Total packets | Discarded packets |
| A | 0 | 122 | 0 |
| B | 0 | 122 | 0 |
| C | 0 | 122 | 0 |
| D | 0 | 122 | 0 |
| Mode M9 | |||
|---|---|---|---|
| Quadrant | BADHDUFLAG | Total packets | Discarded packets |
| A | 0 | 14 | 0 |
| B | 0 | 14 | 0 |
| C | 0 | 14 | 0 |
| D | 0 | 14 | 0 |
| Quadrant | Total seconds | Saturated seconds | Saturation percentage |
|---|---|---|---|
| A | 6078 | 49 | 0.806186% |
| B | 6079 | 115 | 1.891759% |
| C | 6079 | 382 | 6.283928% |
| D | 6079 | 177 | 2.911663% |
Noise dominated data is calculated using 1-second bins in cleaned event files. If a bin has >2000 counts, and if more than 50% of those come from <1% of pixels, then it is considered to be noise-dominated and hence unusable.
| Quadrant | # 1 sec bins | Bins with >0 counts | Bins with >2000 counts | High rate bins dominated by noise | Noise dominated (total time) | Noise dominated (detector-on time) | Marked lightcurve |
|---|---|---|---|---|---|---|---|
| A | 7448 | 6079 | 0 | 0 | 0.00% | 0.00% | 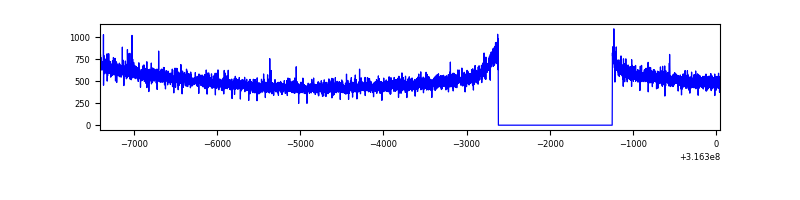 |
| B | 7449 | 6080 | 44 | 44 | 0.59% | 0.72% | 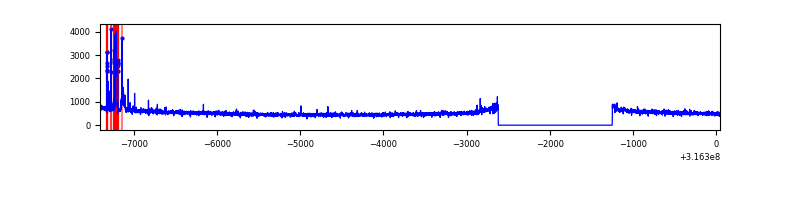 |
| C | 7449 | 6080 | 157 | 157 | 2.11% | 2.58% | 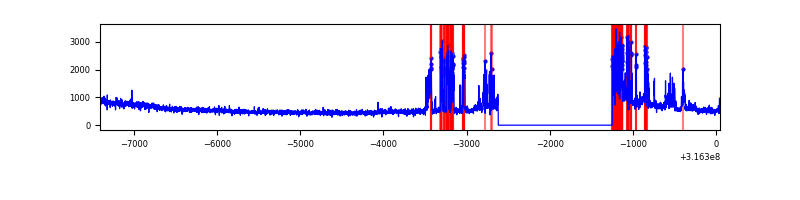 |
| D | 7449 | 6080 | 110 | 110 | 1.48% | 1.81% | 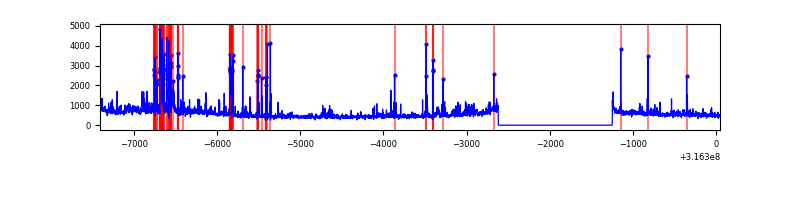 |
Top three noisy pixels from each quadrant. If the there are fewer than three noisy pixels in the level2.evt file, extra rows are filled as -1
| Pixel properties | Quadrant properties | ||||||
|---|---|---|---|---|---|---|---|
| Quadrant | DetID | PixID | Counts | Sigma | Mean | Median | Sigma |
| A | 13 | 254 | 9417 | 54.62 | 796 | 782 | 158.1 |
| A | 0 | 226 | 6759 | 37.81 | 796 | 782 | 158.1 |
| A | 3 | 137 | 6510 | 36.23 | 796 | 782 | 158.1 |
| B | 10 | 247 | 139268 | 942.43 | 798 | 779 | 146.9 |
| B | 0 | 190 | 38105 | 254.01 | 798 | 779 | 146.9 |
| B | 12 | 111 | 16753 | 108.7 | 798 | 779 | 146.9 |
| C | 3 | 233 | 480734 | 2716.54 | 772 | 778 | 176.7 |
| C | 8 | 208 | 351501 | 1985.08 | 772 | 778 | 176.7 |
| C | 14 | 238 | 124247 | 698.83 | 772 | 778 | 176.7 |
| D | 1 | 52 | 648885 | 3473.48 | 780 | 760 | 186.6 |
| D | 7 | 238 | 142164 | 757.82 | 780 | 760 | 186.6 |
| D | 2 | 234 | 25564 | 132.93 | 780 | 760 | 186.6 |
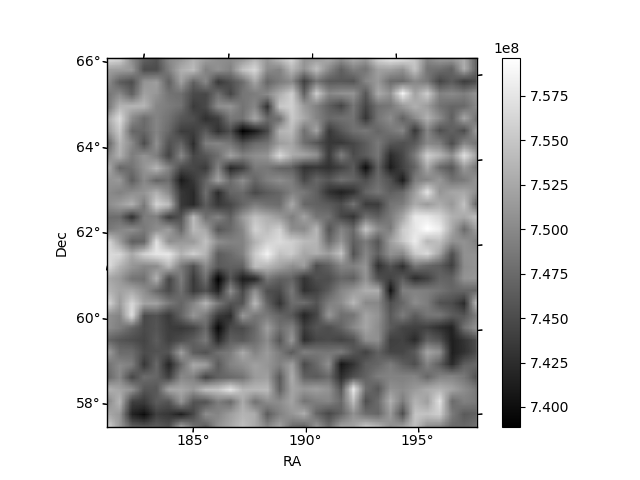
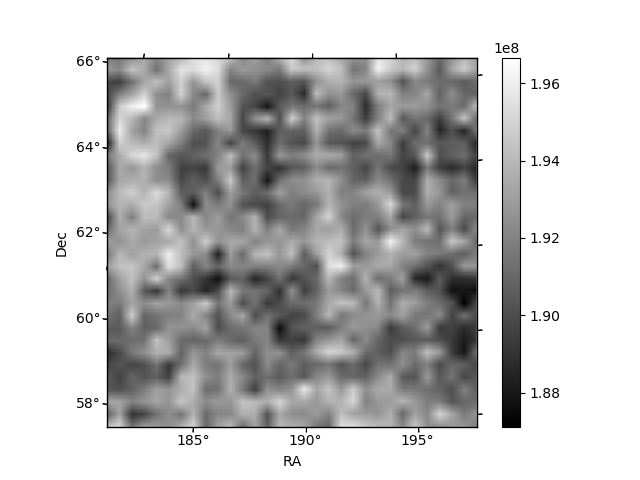
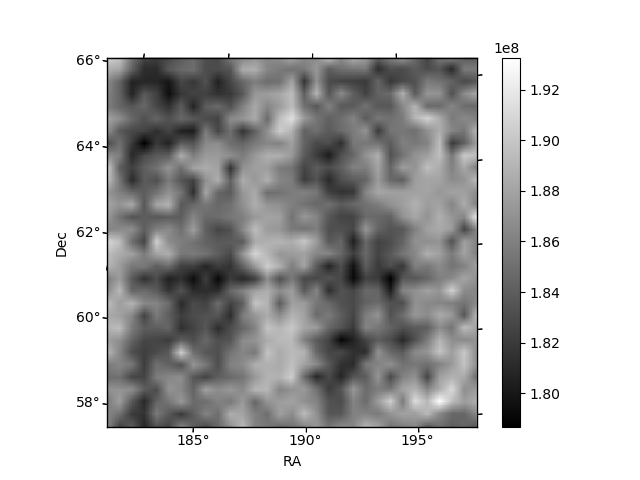
Histogram calculated using DETX and DETY for each event in the final _common_clean file
| Quadrant A | 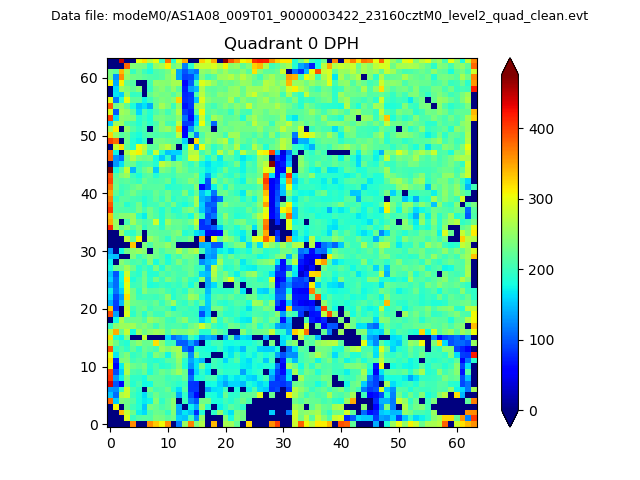 |
 |
Quadrant B |
|---|---|---|---|
| Quadrant D | 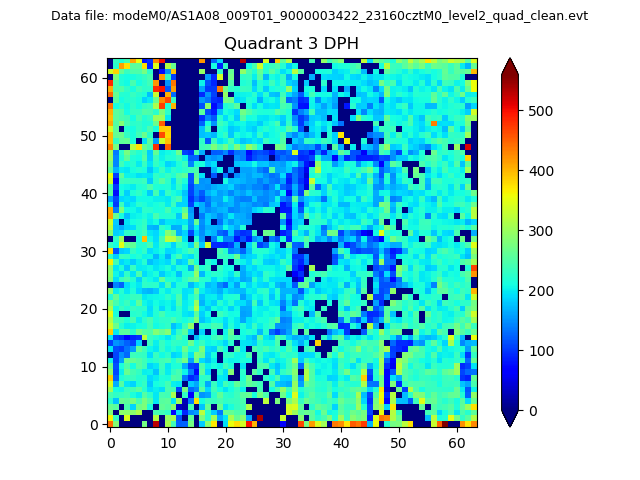 |
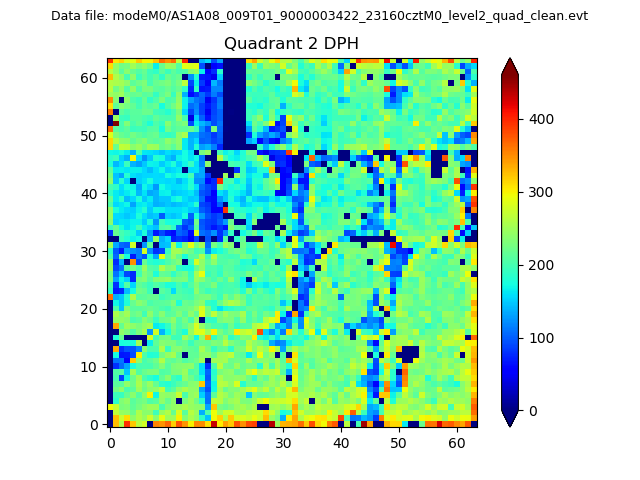 |
Quadrant C |
| Plot type | Count rate plots | Images |
|---|---|---|
| Comparison with Poisson distribution Blue bars denote a histogram of data divided into 1 sec bins. Red curve is a Poisson curve with rate = median count rate of data. |
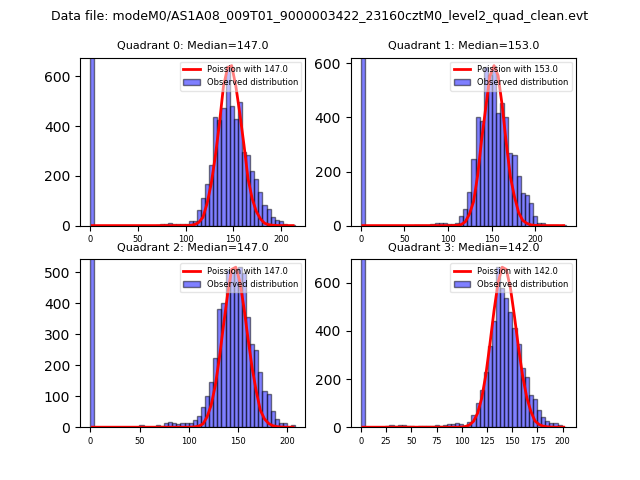 |
 |
| Quadrant-wise count rates Data is divided into 100 sec bins |
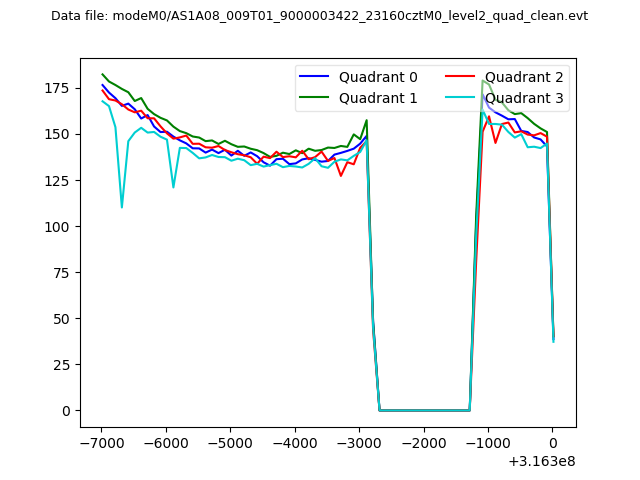 |
|
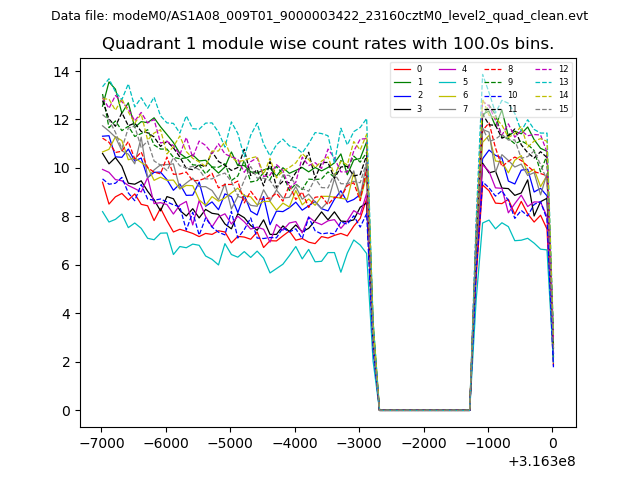
| Module-wise count rates for Quadrant A Data is divided into 100 sec bins |
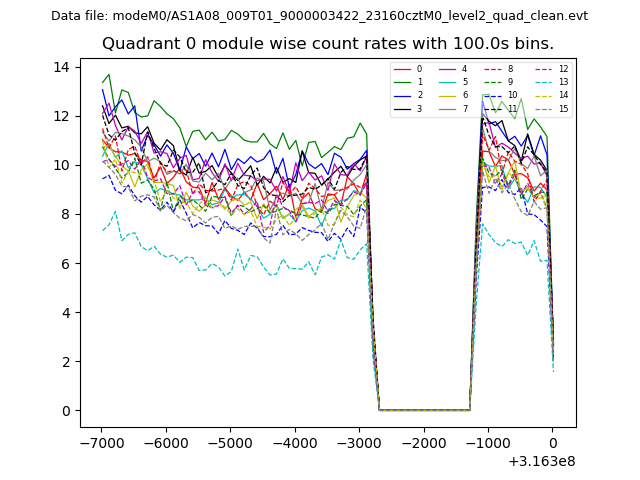 |
 |
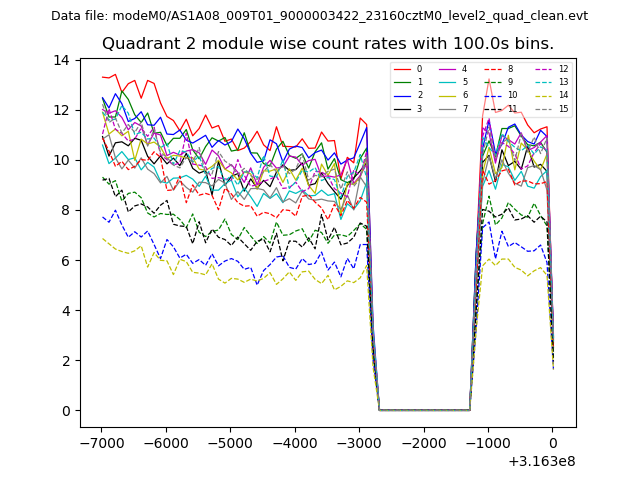
| Module-wise count rates for Quadrant B Data is divided into 100 sec bins |
 |
 |
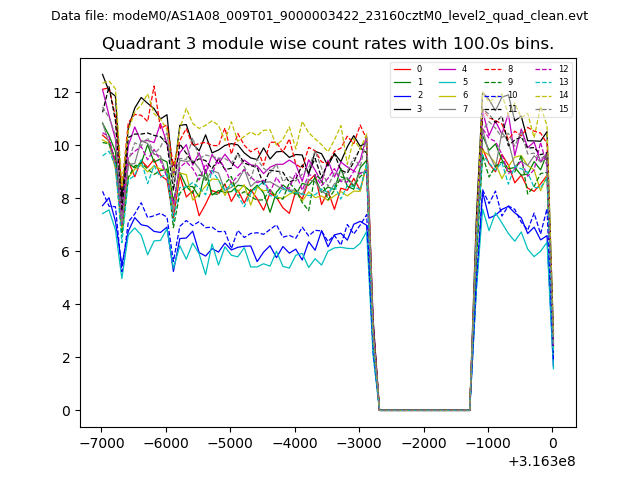
| Module-wise count rates for Quadrant C Data is divided into 100 sec bins |
 |
 |
| Module-wise count rates for Quadrant D Data is divided into 100 sec bins |
 |
 |
| Parameter | Plot |
|---|---|
| CZT HV Monitor | 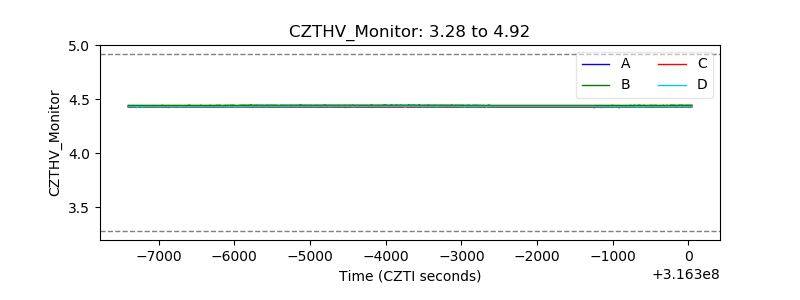 |
| D_VDD | 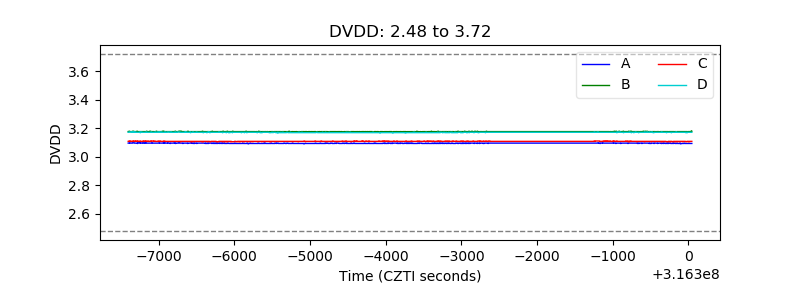 |
| Temperature 1 | 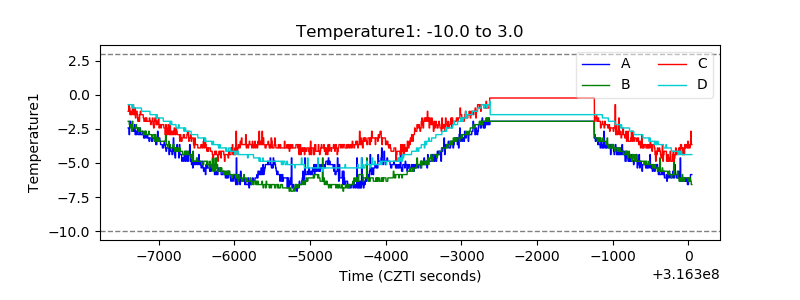 |
| Veto HV Monitor |  |
| Veto LLD |  |
| Alpha Counter | 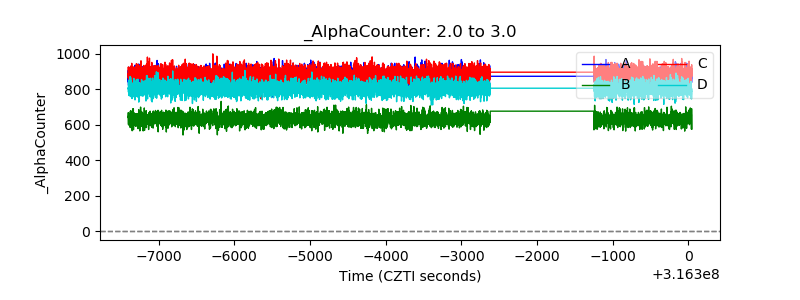 |
| _CPM_Rate | 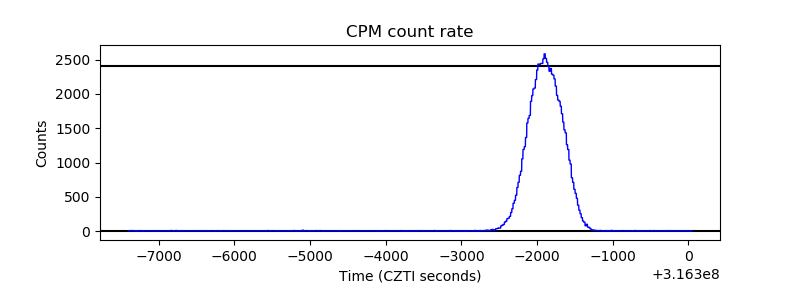 |
| CZT Counter | 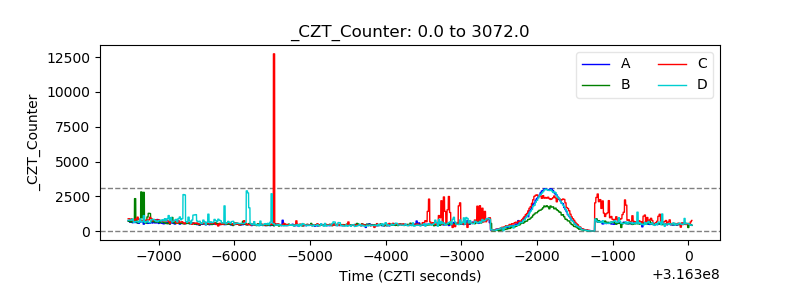 |
| +2.5 Volts monitor | 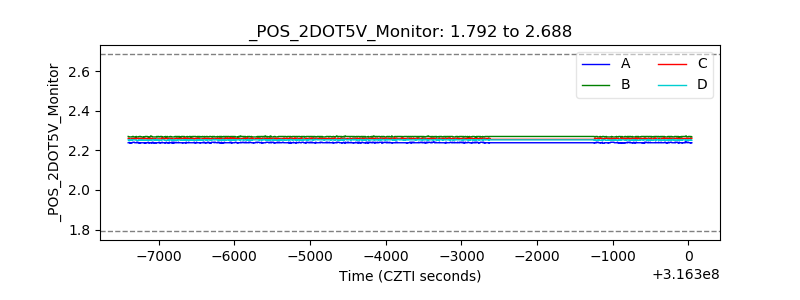 |
| +5 Volts monitor | 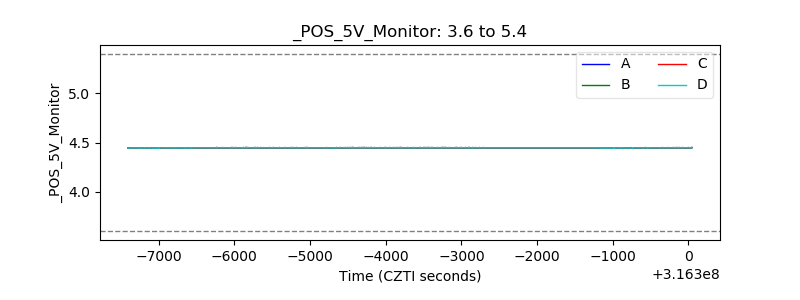 |
| _ROLL_ROT | 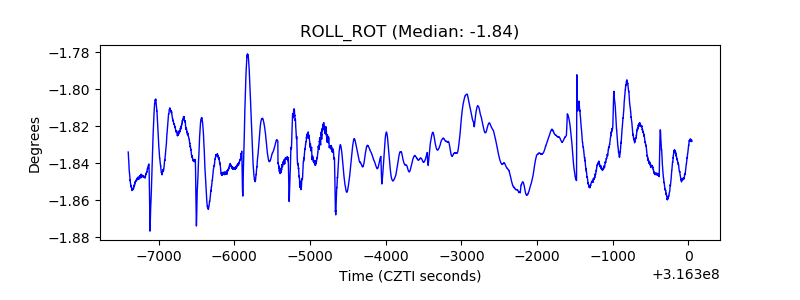 |
| _Roll_DEC | 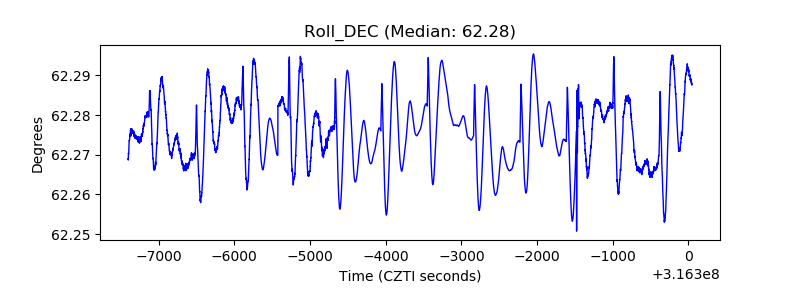 |
| _Roll_RA |  |
| Veto Counter | 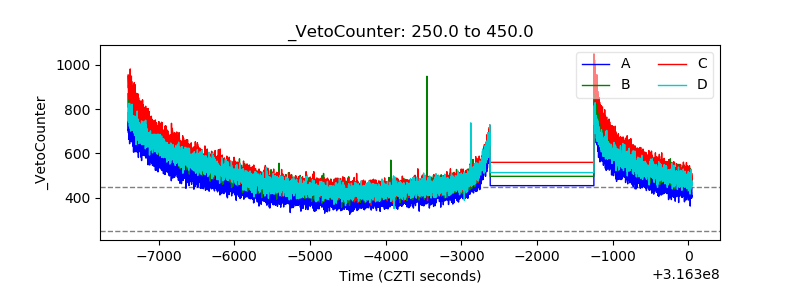 |