| Param | Original file | Final file |
|---|---|---|
| Filename | modeM0/AS1A08_009T01_9000003422_23161cztM0_level2.evt | modeM0/AS1A08_009T01_9000003422_23161cztM0_level2_quad_clean.evt |
| Size (bytes) | 454,942,080 | 115,531,200 |
| Size | 433.9 MB | 110.2 MB |
| Events in quadrant A | 3,009,556 | 767,193 |
| Events in quadrant B | 3,091,189 | 795,328 |
| Events in quadrant C | 3,850,004 | 760,008 |
| Events in quadrant D | 3,405,034 | 742,900 |
| Mode M0 | |||
|---|---|---|---|
| Quadrant | BADHDUFLAG | Total packets | Discarded packets |
| A | 0 | 13006 | 2 |
| B | 0 | 13176 | 3 |
| C | 0 | 15469 | 2 |
| D | 0 | 14257 | 2 |
| Mode SS | |||
|---|---|---|---|
| Quadrant | BADHDUFLAG | Total packets | Discarded packets |
| A | 0 | 126 | 0 |
| B | 0 | 126 | 0 |
| C | 0 | 126 | 0 |
| D | 0 | 126 | 0 |
| Mode M9 | |||
|---|---|---|---|
| Quadrant | BADHDUFLAG | Total packets | Discarded packets |
| A | 0 | 16 | 0 |
| B | 0 | 17 | 0 |
| C | 0 | 17 | 0 |
| D | 0 | 17 | 0 |
| Quadrant | Total seconds | Saturated seconds | Saturation percentage |
|---|---|---|---|
| A | 6214 | 26 | 0.418410% |
| B | 6213 | 32 | 0.515049% |
| C | 6213 | 303 | 4.876871% |
| D | 6213 | 107 | 1.722195% |
Noise dominated data is calculated using 1-second bins in cleaned event files. If a bin has >2000 counts, and if more than 50% of those come from <1% of pixels, then it is considered to be noise-dominated and hence unusable.
| Quadrant | # 1 sec bins | Bins with >0 counts | Bins with >2000 counts | High rate bins dominated by noise | Noise dominated (total time) | Noise dominated (detector-on time) | Marked lightcurve |
|---|---|---|---|---|---|---|---|
| A | 7464 | 6215 | 0 | 0 | 0.00% | 0.00% | 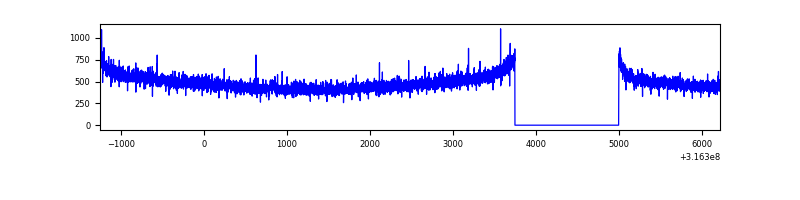 |
| B | 7463 | 6214 | 0 | 0 | 0.00% | 0.00% | 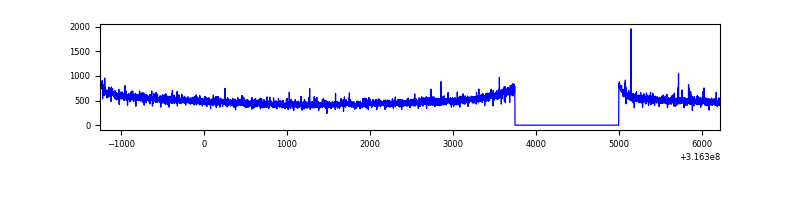 |
| C | 7463 | 6214 | 111 | 111 | 1.49% | 1.79% | 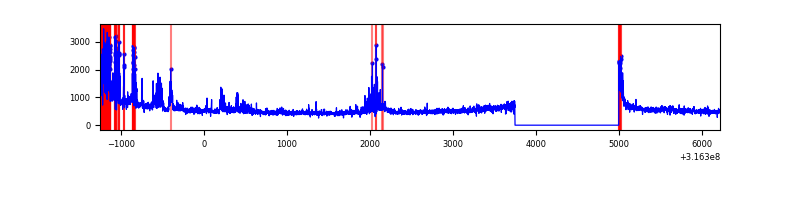 |
| D | 7463 | 6214 | 49 | 49 | 0.66% | 0.79% | 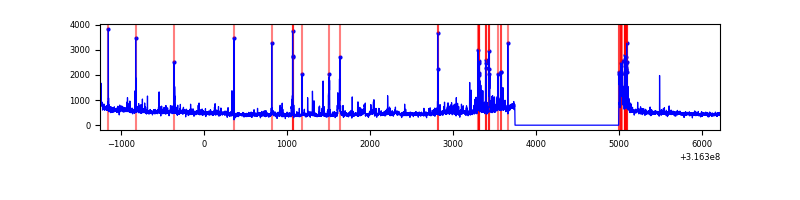 |
Top three noisy pixels from each quadrant. If the there are fewer than three noisy pixels in the level2.evt file, extra rows are filled as -1
| Pixel properties | Quadrant properties | ||||||
|---|---|---|---|---|---|---|---|
| Quadrant | DetID | PixID | Counts | Sigma | Mean | Median | Sigma |
| A | 6 | 16 | 11909 | 72.13 | 777 | 761 | 154.5 |
| A | 13 | 254 | 10242 | 61.34 | 777 | 761 | 154.5 |
| A | 0 | 226 | 6809 | 39.13 | 777 | 761 | 154.5 |
| B | 12 | 111 | 17164 | 112.28 | 784 | 766 | 146.0 |
| B | 11 | 111 | 15293 | 99.47 | 784 | 766 | 146.0 |
| B | 0 | 190 | 13884 | 89.82 | 784 | 766 | 146.0 |
| C | 8 | 208 | 354891 | 2056.56 | 749 | 755 | 172.2 |
| C | 3 | 233 | 219967 | 1273.02 | 749 | 755 | 172.2 |
| C | 0 | 10 | 192206 | 1111.81 | 749 | 755 | 172.2 |
| D | 13 | 153 | 228527 | 1247.86 | 760 | 738 | 182.5 |
| D | 12 | 17 | 122577 | 667.45 | 760 | 738 | 182.5 |
| D | 1 | 52 | 88644 | 481.56 | 760 | 738 | 182.5 |
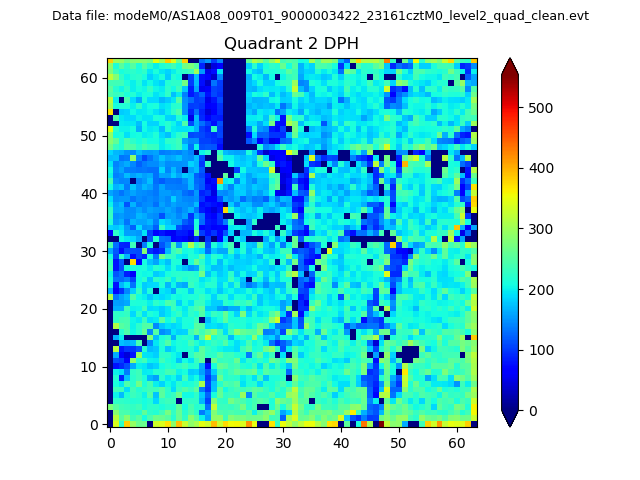
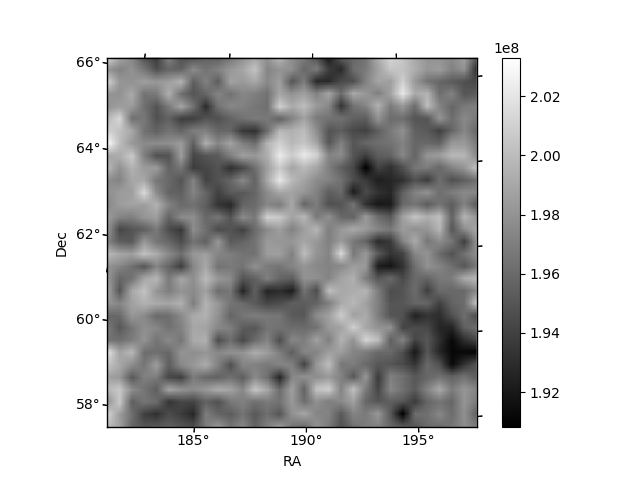
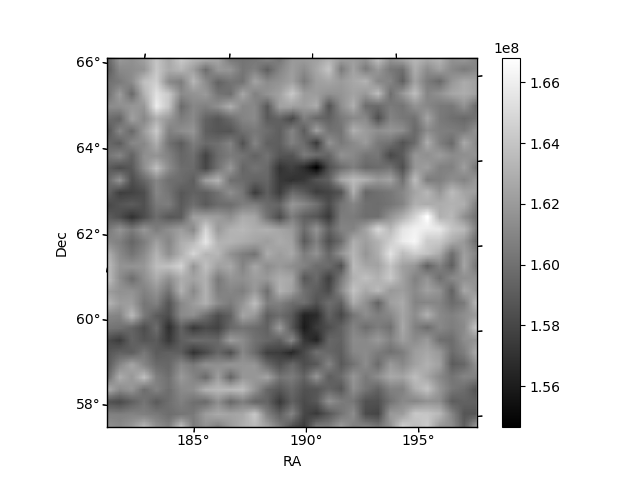
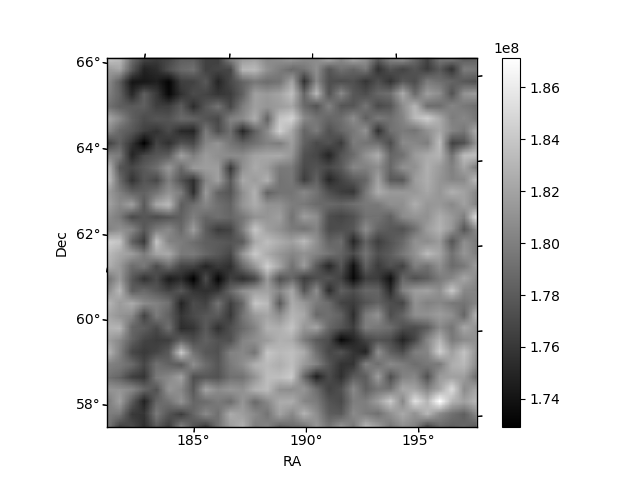
Histogram calculated using DETX and DETY for each event in the final _common_clean file
| Quadrant A | 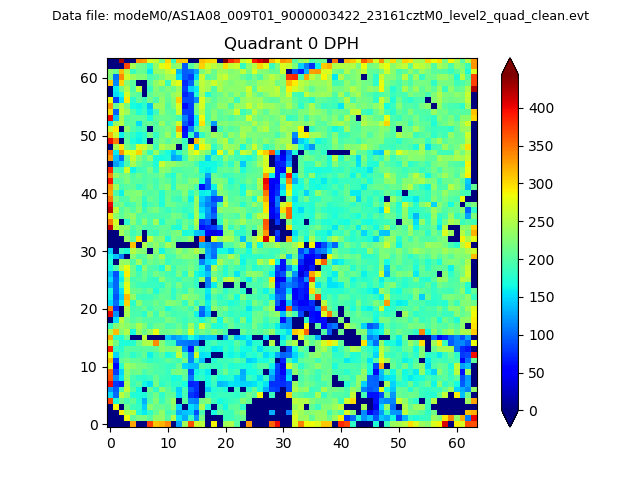 |
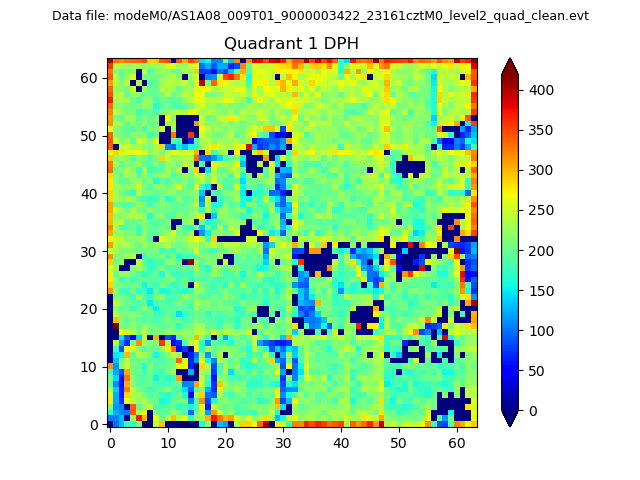 |
Quadrant B |
|---|---|---|---|
| Quadrant D | 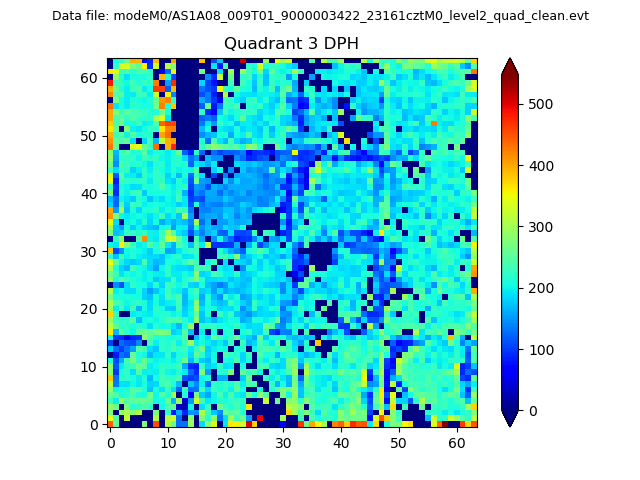 |
 |
Quadrant C |
| Plot type | Count rate plots | Images |
|---|---|---|
| Comparison with Poisson distribution Blue bars denote a histogram of data divided into 1 sec bins. Red curve is a Poisson curve with rate = median count rate of data. |
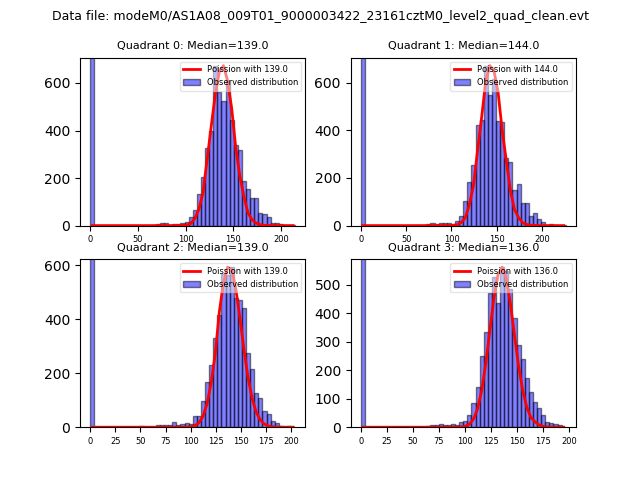 |
 |
| Quadrant-wise count rates Data is divided into 100 sec bins |
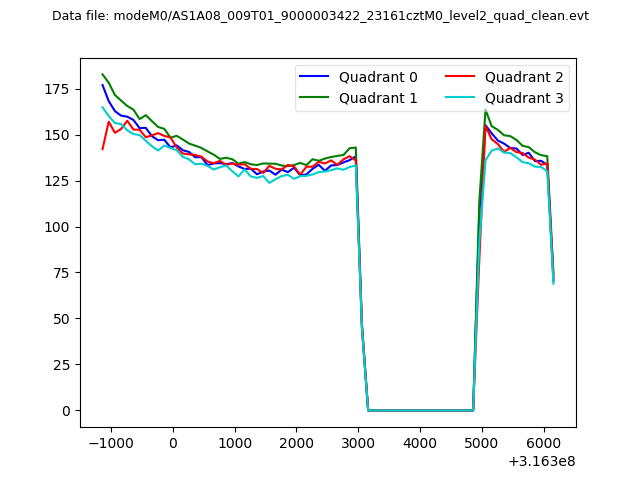 |
|
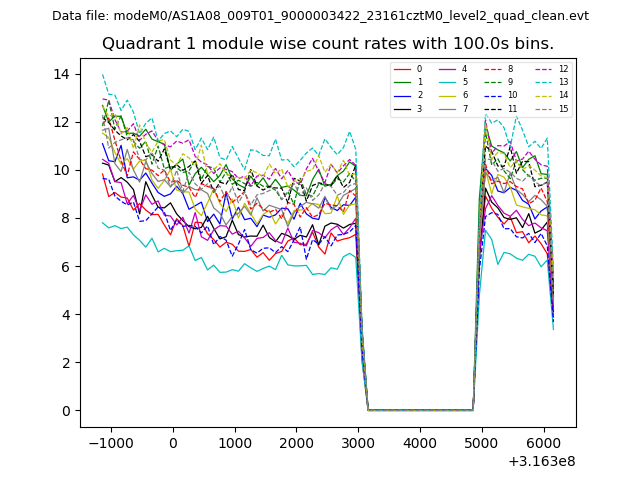
| Module-wise count rates for Quadrant A Data is divided into 100 sec bins |
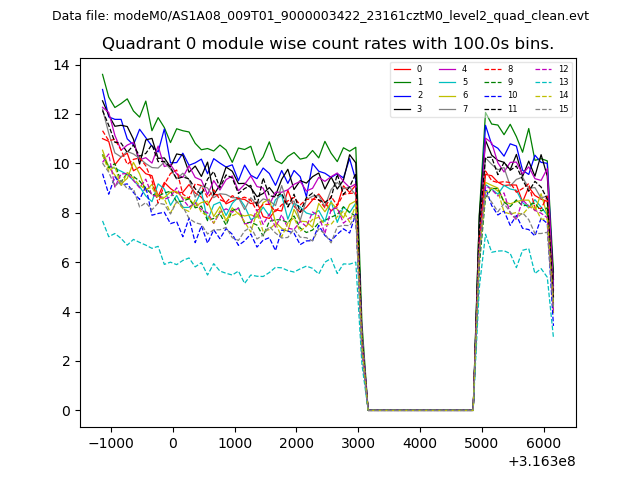 |
 |
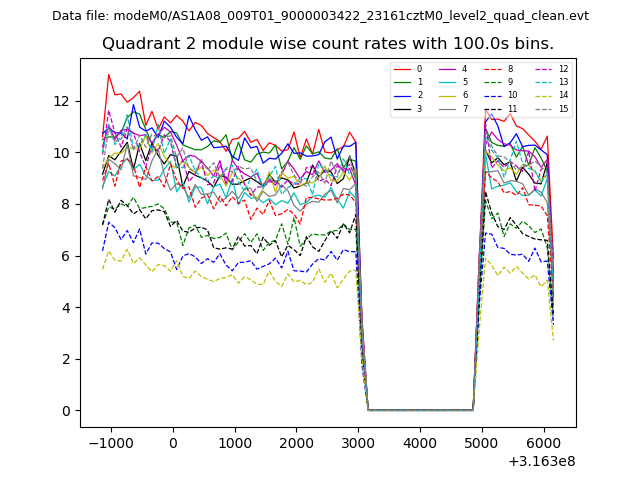
| Module-wise count rates for Quadrant B Data is divided into 100 sec bins |
 |
 |
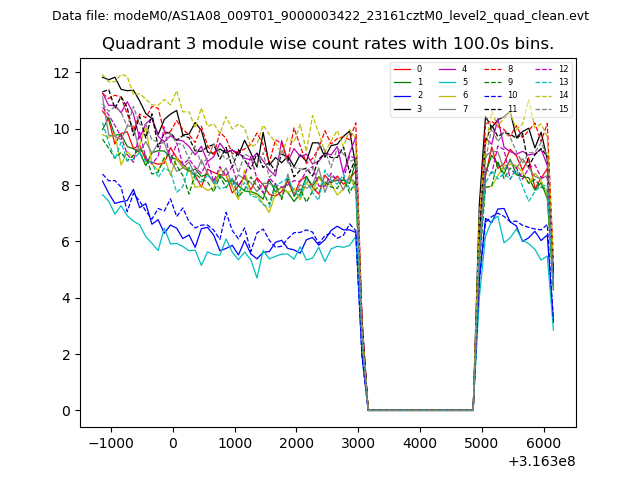
| Module-wise count rates for Quadrant C Data is divided into 100 sec bins |
 |
 |
| Module-wise count rates for Quadrant D Data is divided into 100 sec bins |
 |
 |
| Parameter | Plot |
|---|---|
| CZT HV Monitor | 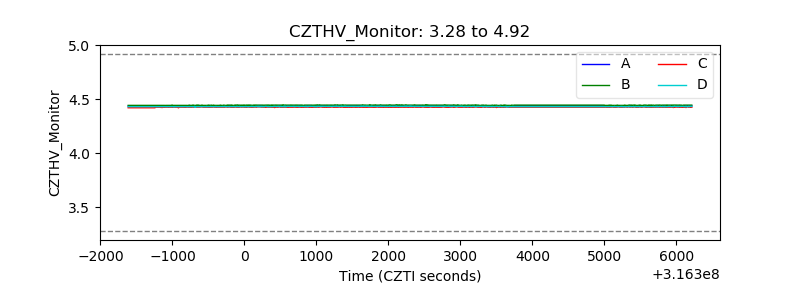 |
| D_VDD | 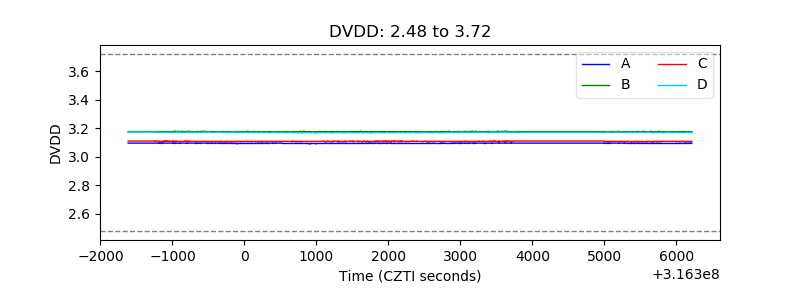 |
| Temperature 1 | 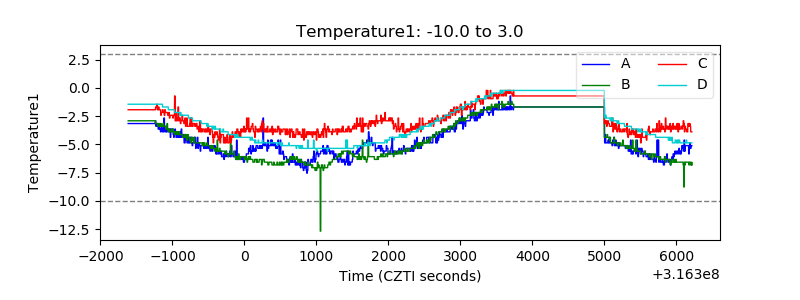 |
| Veto HV Monitor | 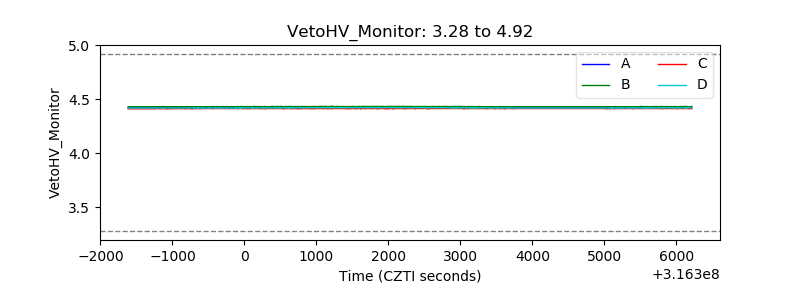 |
| Veto LLD | 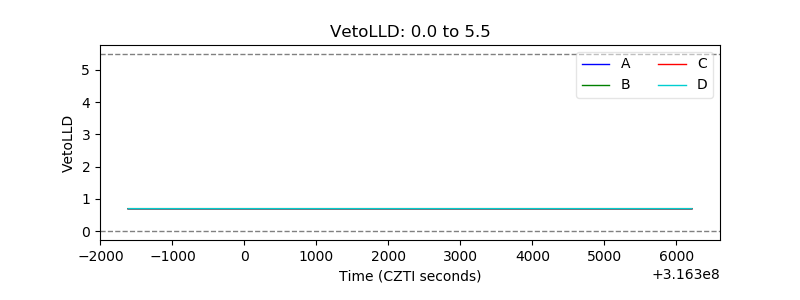 |
| Alpha Counter | 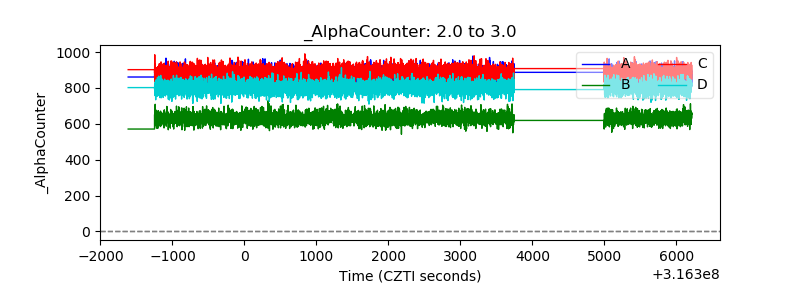 |
| _CPM_Rate | 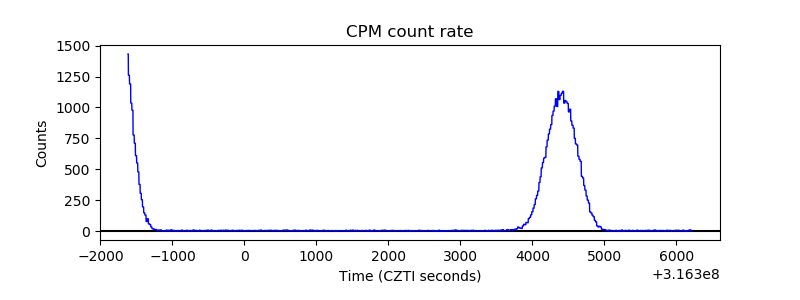 |
| CZT Counter | 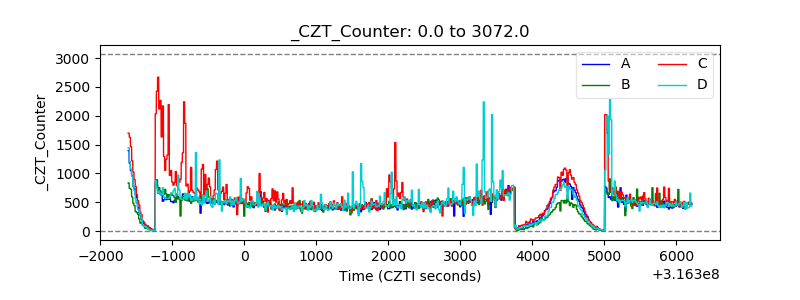 |
| +2.5 Volts monitor |  |
| +5 Volts monitor |  |
| _ROLL_ROT | 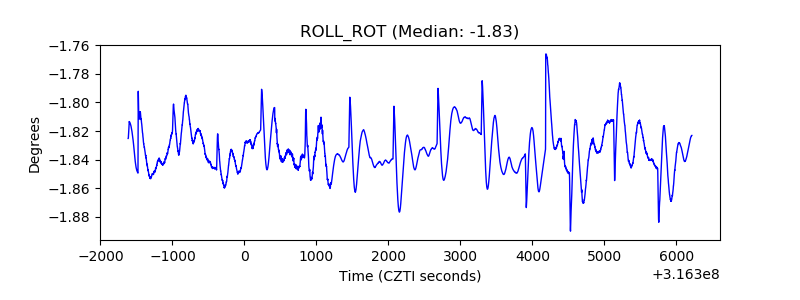 |
| _Roll_DEC | 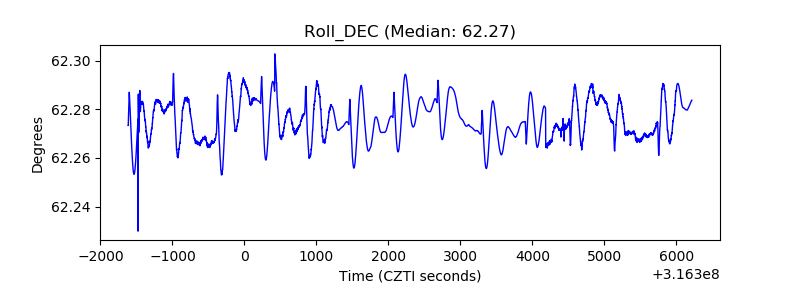 |
| _Roll_RA |  |
| Veto Counter | 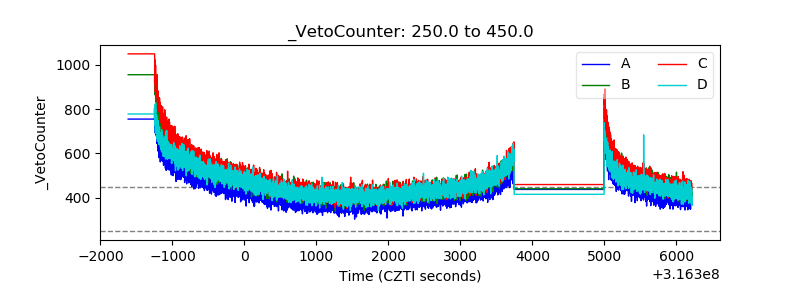 |