| Param | Original file | Final file |
|---|---|---|
| Filename | modeM0/AS1A08_009T01_9000003422_23162cztM0_level2.evt | modeM0/AS1A08_009T01_9000003422_23162cztM0_level2_quad_clean.evt |
| Size (bytes) | 454,394,880 | 105,874,560 |
| Size | 433.3 MB | 101.0 MB |
| Events in quadrant A | 3,042,352 | 688,783 |
| Events in quadrant B | 3,157,284 | 708,942 |
| Events in quadrant C | 3,574,250 | 682,282 |
| Events in quadrant D | 3,539,832 | 667,418 |
| Mode M0 | |||
|---|---|---|---|
| Quadrant | BADHDUFLAG | Total packets | Discarded packets |
| A | 0 | 13608 | 95 |
| B | 0 | 13827 | 90 |
| C | 0 | 15005 | 122 |
| D | 0 | 15377 | 92 |
| Mode SS | |||
|---|---|---|---|
| Quadrant | BADHDUFLAG | Total packets | Discarded packets |
| A | 0 | 134 | 2 |
| B | 0 | 134 | 0 |
| C | 0 | 134 | 4 |
| D | 0 | 134 | 2 |
| Mode M9 | |||
|---|---|---|---|
| Quadrant | BADHDUFLAG | Total packets | Discarded packets |
| A | 0 | 17 | 0 |
| B | 0 | 18 | 1 |
| C | 0 | 18 | 0 |
| D | 0 | 18 | 1 |
| Quadrant | Total seconds | Saturated seconds | Saturation percentage |
|---|---|---|---|
| A | 6585 | 17 | 0.258162% |
| B | 6590 | 26 | 0.394537% |
| C | 6592 | 161 | 2.442354% |
| D | 6593 | 190 | 2.881844% |
Noise dominated data is calculated using 1-second bins in cleaned event files. If a bin has >2000 counts, and if more than 50% of those come from <1% of pixels, then it is considered to be noise-dominated and hence unusable.
| Quadrant | # 1 sec bins | Bins with >0 counts | Bins with >2000 counts | High rate bins dominated by noise | Noise dominated (total time) | Noise dominated (detector-on time) | Marked lightcurve |
|---|---|---|---|---|---|---|---|
| A | 7540 | 6610 | 0 | 0 | 0.00% | 0.00% | 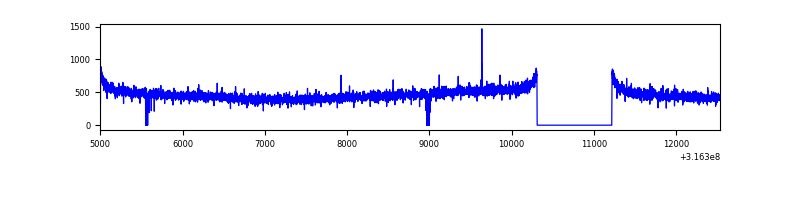 |
| B | 7536 | 6617 | 0 | 0 | 0.00% | 0.00% | 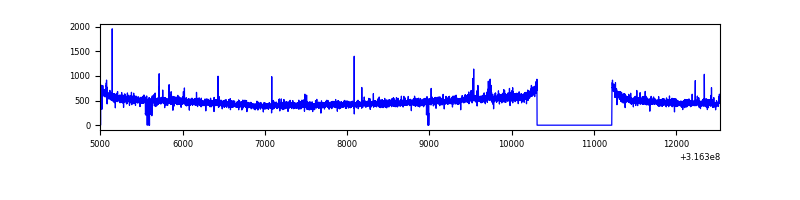 |
| C | 7532 | 6610 | 7 | 7 | 0.09% | 0.11% | 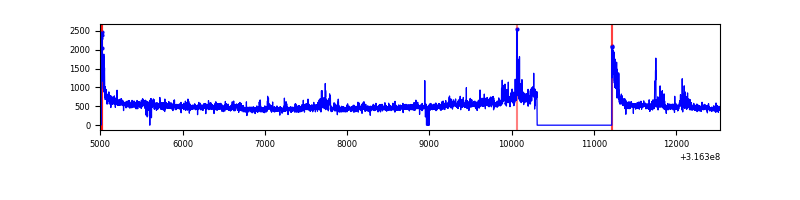 |
| D | 7540 | 6619 | 111 | 111 | 1.47% | 1.68% | 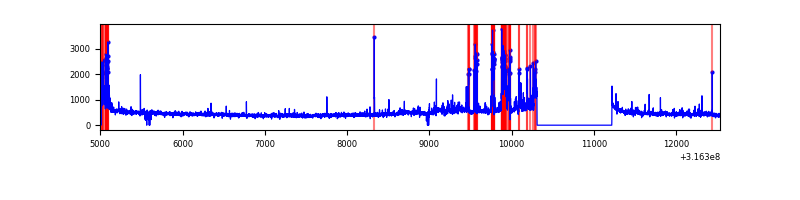 |
Top three noisy pixels from each quadrant. If the there are fewer than three noisy pixels in the level2.evt file, extra rows are filled as -1
| Pixel properties | Quadrant properties | ||||||
|---|---|---|---|---|---|---|---|
| Quadrant | DetID | PixID | Counts | Sigma | Mean | Median | Sigma |
| A | 13 | 254 | 10262 | 60.09 | 787 | 771 | 158.0 |
| A | 3 | 137 | 6881 | 38.68 | 787 | 771 | 158.0 |
| A | 0 | 226 | 6530 | 36.46 | 787 | 771 | 158.0 |
| B | 0 | 190 | 21540 | 136.15 | 796 | 775 | 152.5 |
| B | 12 | 111 | 17746 | 111.28 | 796 | 775 | 152.5 |
| B | 11 | 111 | 15848 | 98.83 | 796 | 775 | 152.5 |
| C | 0 | 10 | 289760 | 1639.45 | 766 | 771 | 176.3 |
| C | 14 | 238 | 119872 | 675.67 | 766 | 771 | 176.3 |
| C | 8 | 208 | 101749 | 572.85 | 766 | 771 | 176.3 |
| D | 12 | 233 | 261658 | 1423.56 | 762 | 740 | 183.3 |
| D | 12 | 17 | 183752 | 998.51 | 762 | 740 | 183.3 |
| D | 1 | 52 | 122006 | 661.62 | 762 | 740 | 183.3 |
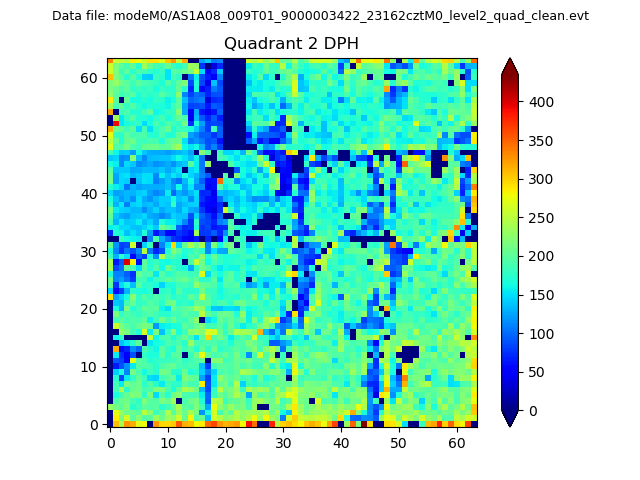
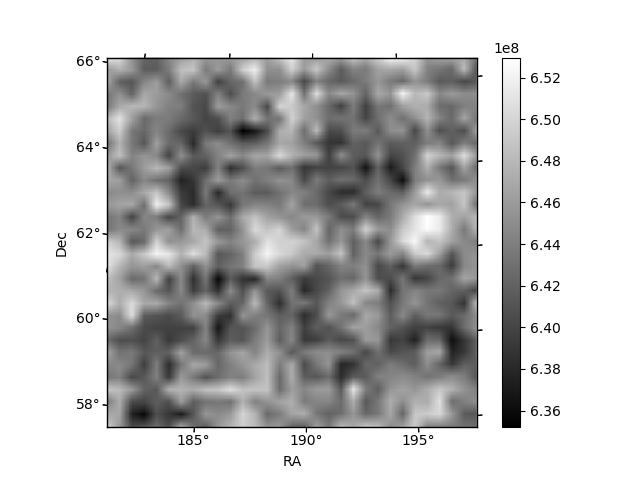
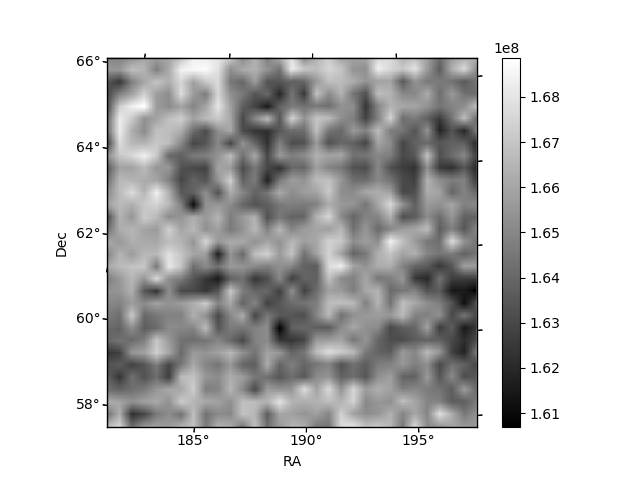
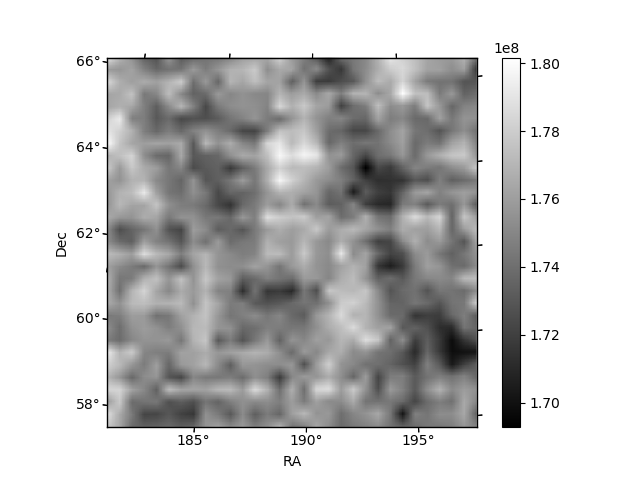
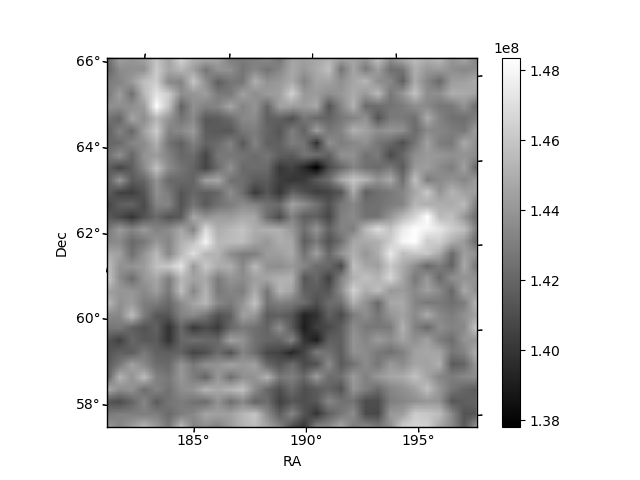
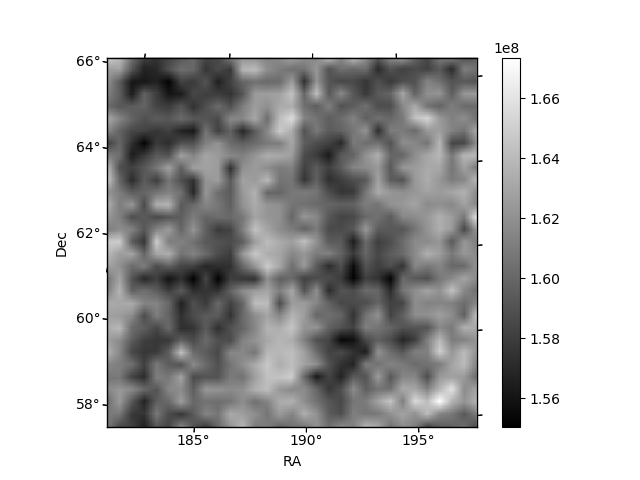
Histogram calculated using DETX and DETY for each event in the final _common_clean file
| Quadrant A | 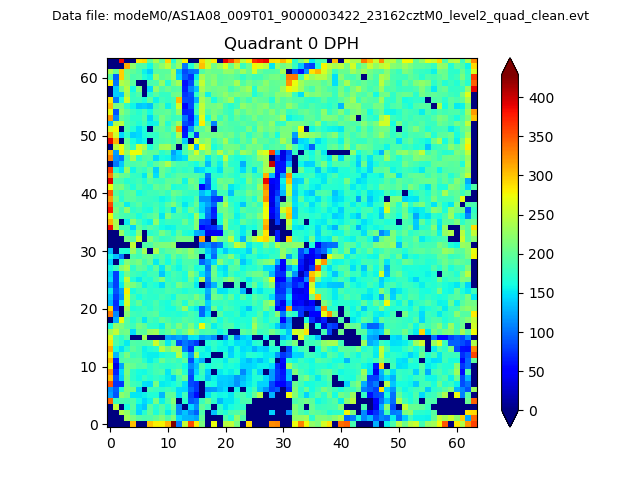 |
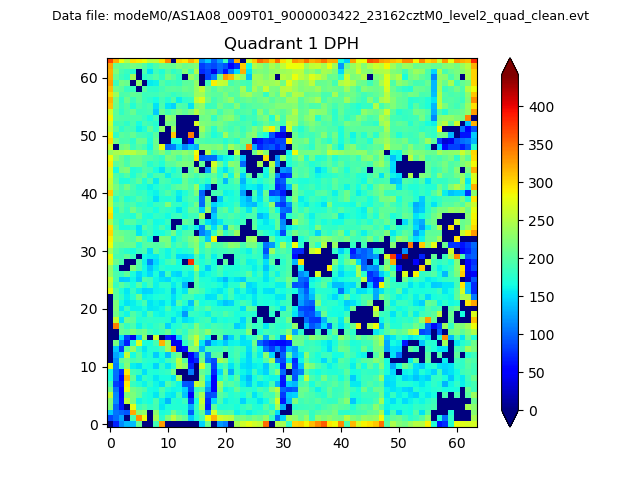 |
Quadrant B |
|---|---|---|---|
| Quadrant D | 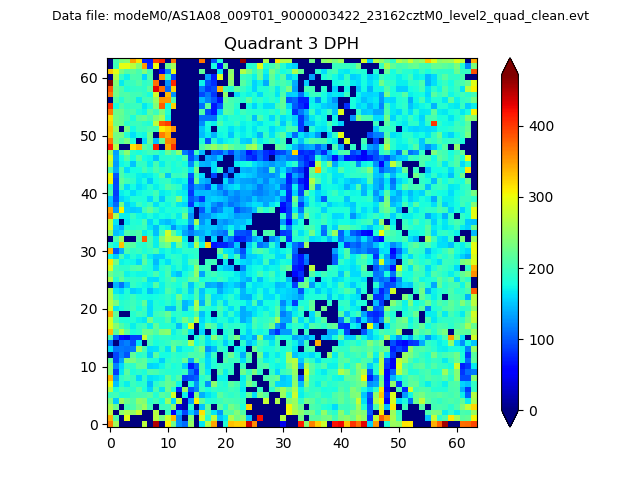 |
 |
Quadrant C |
| Plot type | Count rate plots | Images |
|---|---|---|
| Comparison with Poisson distribution Blue bars denote a histogram of data divided into 1 sec bins. Red curve is a Poisson curve with rate = median count rate of data. |
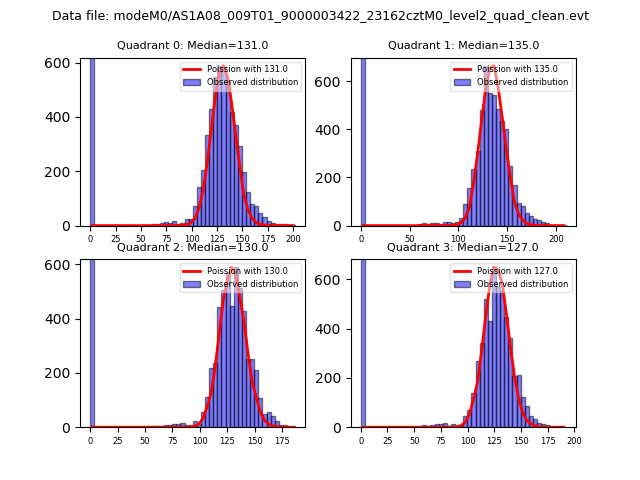 |
 |
| Quadrant-wise count rates Data is divided into 100 sec bins |
 |
|
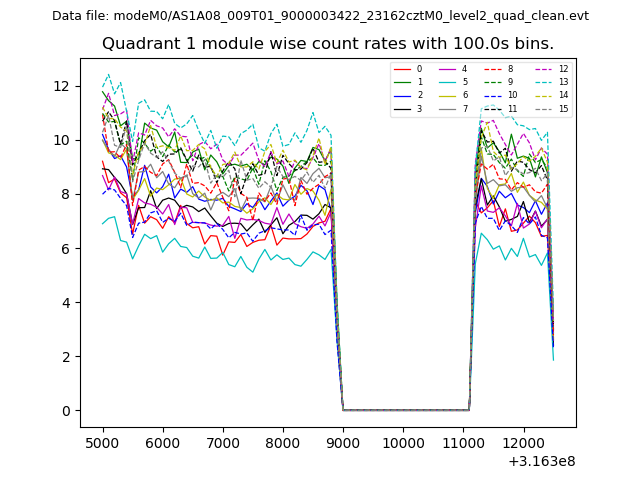
| Module-wise count rates for Quadrant A Data is divided into 100 sec bins |
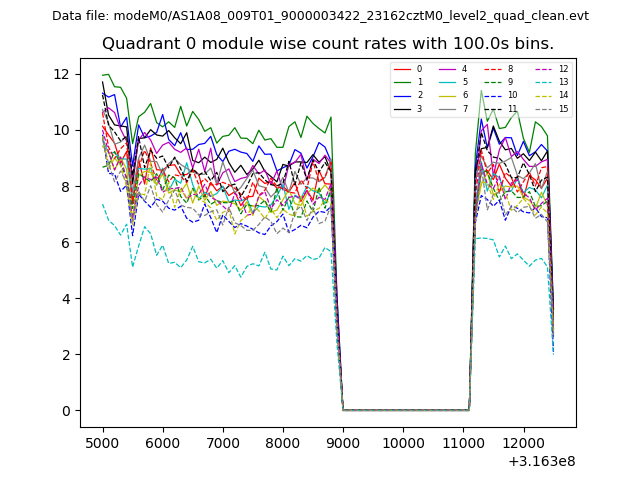 |
 |
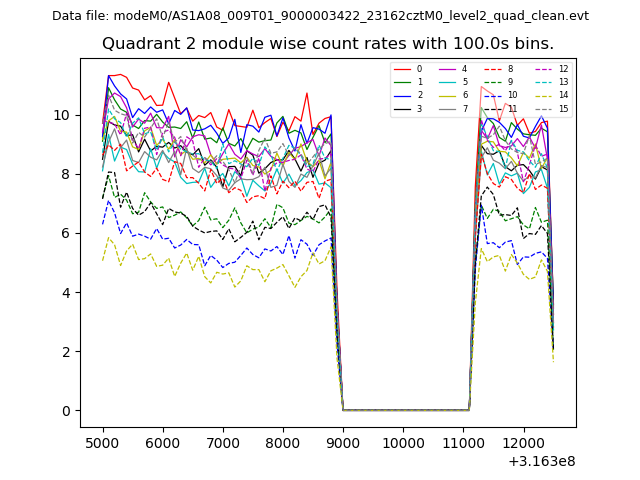
| Module-wise count rates for Quadrant B Data is divided into 100 sec bins |
 |
 |
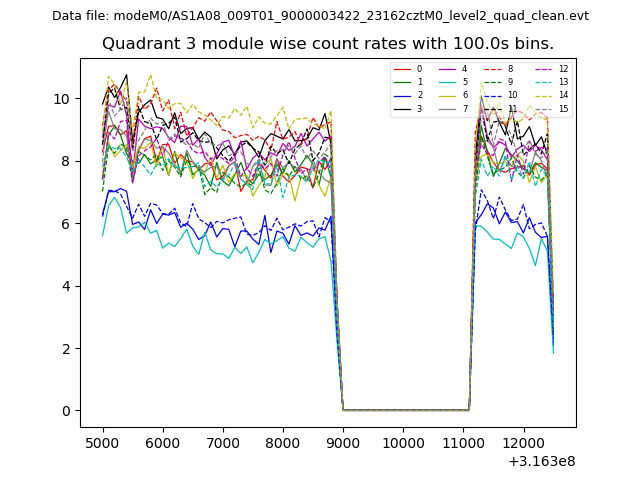
| Module-wise count rates for Quadrant C Data is divided into 100 sec bins |
 |
 |
| Module-wise count rates for Quadrant D Data is divided into 100 sec bins |
 |
 |
| Parameter | Plot |
|---|---|
| CZT HV Monitor | 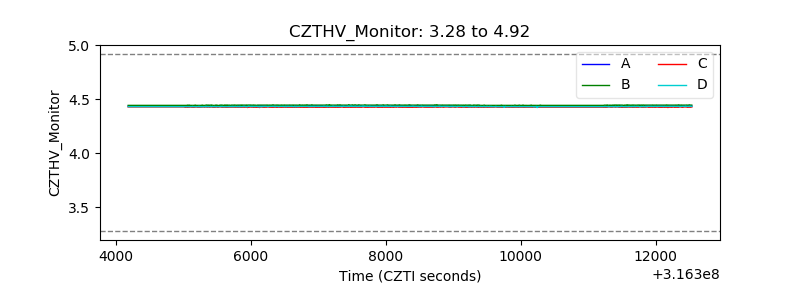 |
| D_VDD | 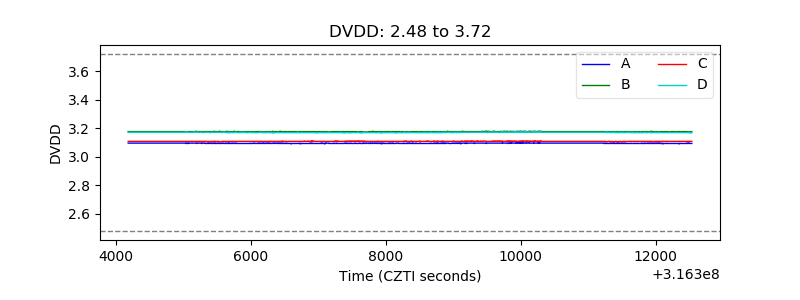 |
| Temperature 1 | 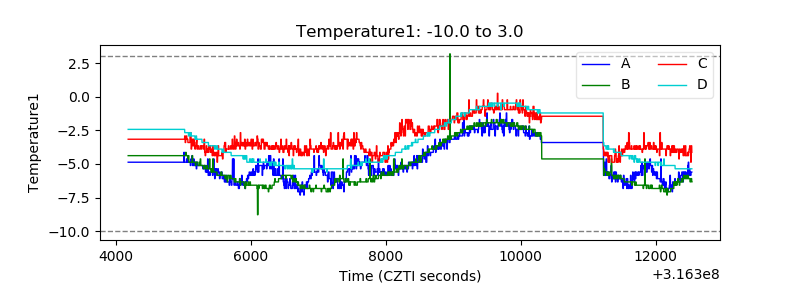 |
| Veto HV Monitor | 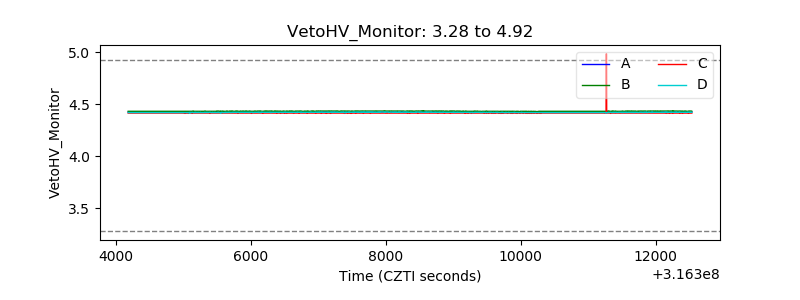 |
| Veto LLD | 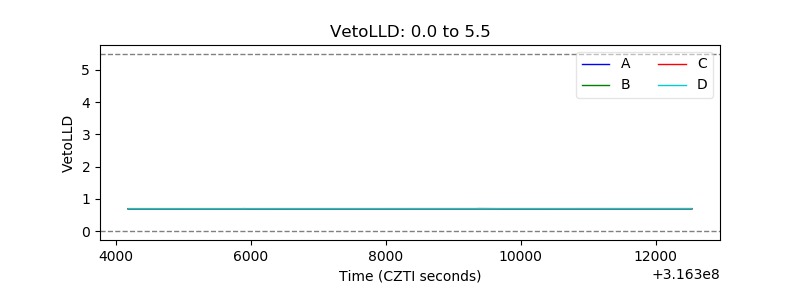 |
| Alpha Counter |  |
| _CPM_Rate |  |
| CZT Counter | 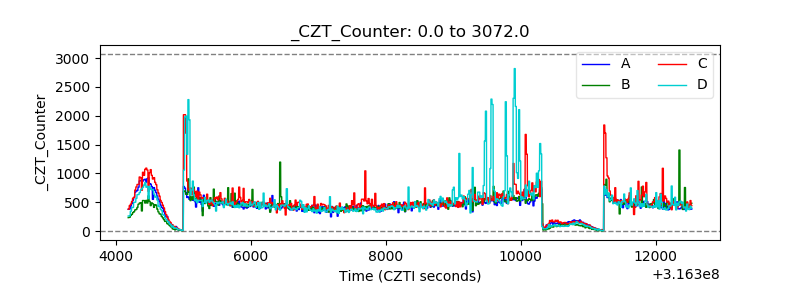 |
| +2.5 Volts monitor |  |
| +5 Volts monitor |  |
| _ROLL_ROT | 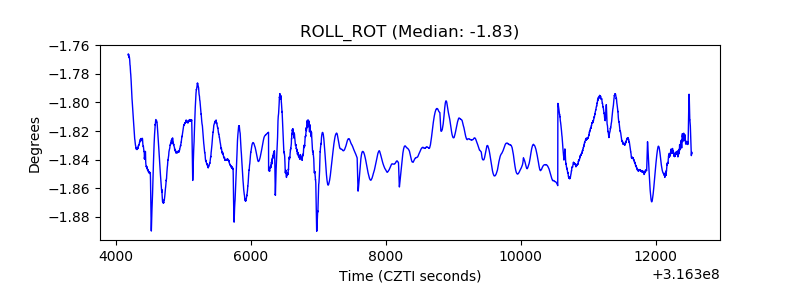 |
| _Roll_DEC | 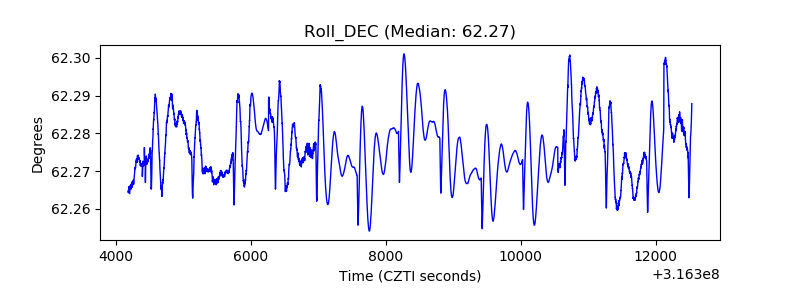 |
| _Roll_RA | 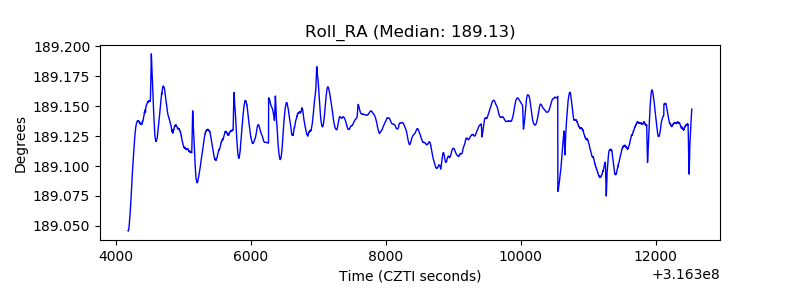 |
| Veto Counter | 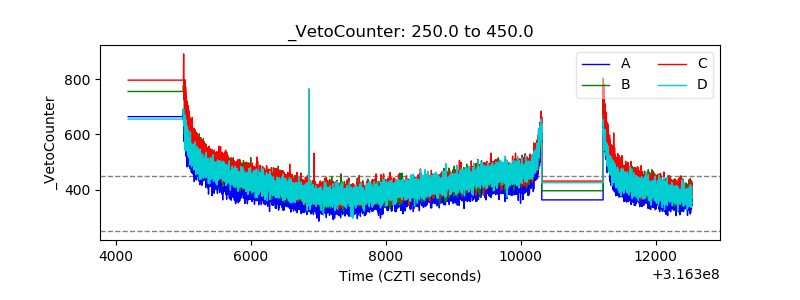 |