| Param | Original file | Final file |
|---|---|---|
| Filename | modeM0/AS1A08_009T01_9000003422_23163cztM0_level2.evt | modeM0/AS1A08_009T01_9000003422_23163cztM0_level2_quad_clean.evt |
| Size (bytes) | 566,127,360 | 114,318,720 |
| Size | 539.9 MB | 109.0 MB |
| Events in quadrant A | 3,632,402 | 732,538 |
| Events in quadrant B | 3,761,386 | 752,562 |
| Events in quadrant C | 4,146,666 | 722,950 |
| Events in quadrant D | 5,071,486 | 707,954 |
| Mode M0 | |||
|---|---|---|---|
| Quadrant | BADHDUFLAG | Total packets | Discarded packets |
| A | 0 | 16245 | 2 |
| B | 0 | 16477 | 2 |
| C | 0 | 17422 | 2 |
| D | 0 | 20890 | 2 |
| Mode SS | |||
|---|---|---|---|
| Quadrant | BADHDUFLAG | Total packets | Discarded packets |
| A | 0 | 160 | 0 |
| B | 0 | 160 | 0 |
| C | 0 | 160 | 0 |
| D | 0 | 160 | 0 |
| Mode M9 | |||
|---|---|---|---|
| Quadrant | BADHDUFLAG | Total packets | Discarded packets |
| A | 0 | 14 | 0 |
| B | 0 | 14 | 0 |
| C | 0 | 14 | 0 |
| D | 0 | 14 | 0 |
| Quadrant | Total seconds | Saturated seconds | Saturation percentage |
|---|---|---|---|
| A | 7860 | 31 | 0.394402% |
| B | 7860 | 65 | 0.826972% |
| C | 7860 | 198 | 2.519084% |
| D | 7861 | 518 | 6.589492% |
Noise dominated data is calculated using 1-second bins in cleaned event files. If a bin has >2000 counts, and if more than 50% of those come from <1% of pixels, then it is considered to be noise-dominated and hence unusable.
| Quadrant | # 1 sec bins | Bins with >0 counts | Bins with >2000 counts | High rate bins dominated by noise | Noise dominated (total time) | Noise dominated (detector-on time) | Marked lightcurve |
|---|---|---|---|---|---|---|---|
| A | 9235 | 7862 | 0 | 0 | 0.00% | 0.00% | 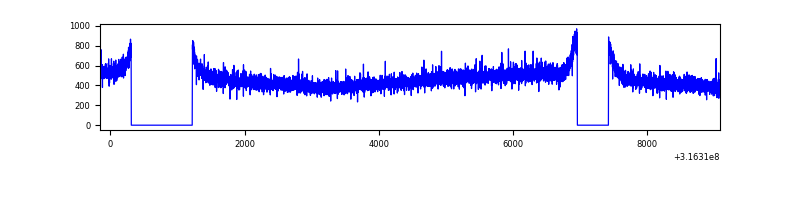 |
| B | 9235 | 7862 | 0 | 0 | 0.00% | 0.00% | 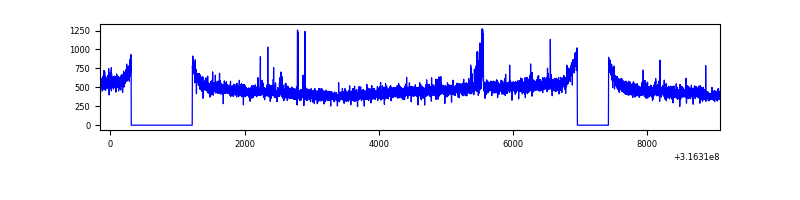 |
| C | 9235 | 7862 | 3 | 3 | 0.03% | 0.04% | 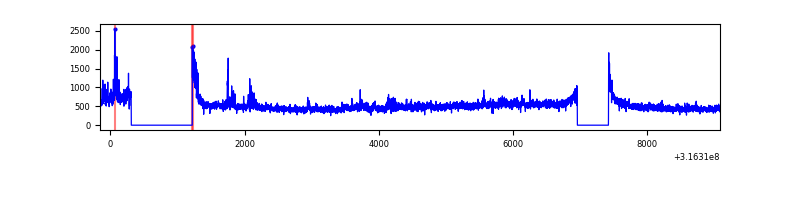 |
| D | 9236 | 7863 | 417 | 417 | 4.51% | 5.30% | 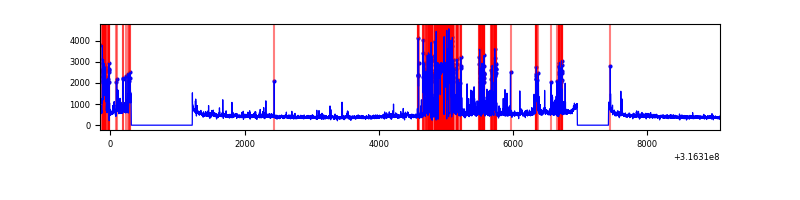 |
Top three noisy pixels from each quadrant. If the there are fewer than three noisy pixels in the level2.evt file, extra rows are filled as -1
| Pixel properties | Quadrant properties | ||||||
|---|---|---|---|---|---|---|---|
| Quadrant | DetID | PixID | Counts | Sigma | Mean | Median | Sigma |
| A | 13 | 254 | 11449 | 55.35 | 941 | 920 | 190.2 |
| A | 3 | 137 | 8365 | 39.14 | 941 | 920 | 190.2 |
| A | 0 | 226 | 7912 | 36.75 | 941 | 920 | 190.2 |
| B | 0 | 190 | 37931 | 202.95 | 947 | 920 | 182.4 |
| B | 12 | 111 | 21989 | 115.53 | 947 | 920 | 182.4 |
| B | 11 | 111 | 19320 | 100.9 | 947 | 920 | 182.4 |
| C | 0 | 10 | 269394 | 1265.31 | 909 | 914 | 212.2 |
| C | 14 | 238 | 142262 | 666.15 | 909 | 914 | 212.2 |
| C | 8 | 208 | 92539 | 431.82 | 909 | 914 | 212.2 |
| D | 1 | 52 | 1295437 | 5991.58 | 889 | 862 | 216.1 |
| D | 12 | 233 | 169056 | 778.44 | 889 | 862 | 216.1 |
| D | 13 | 153 | 95705 | 438.95 | 889 | 862 | 216.1 |
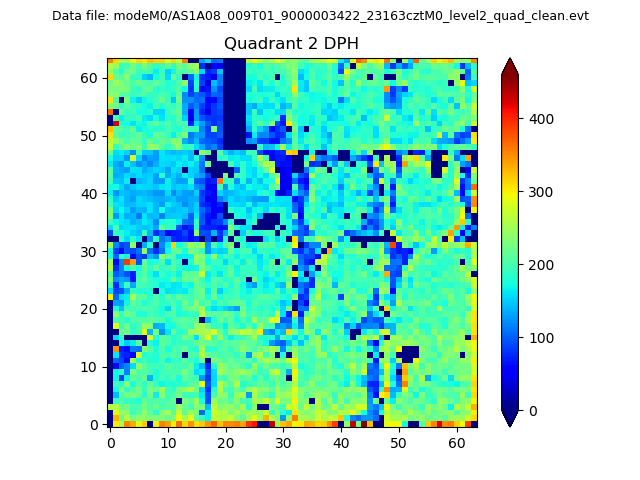
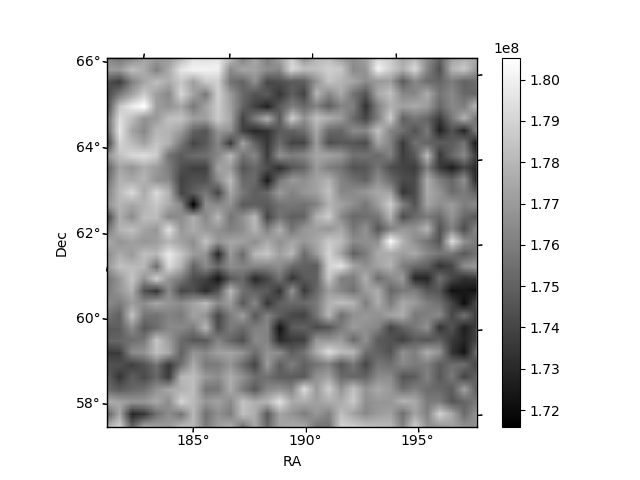
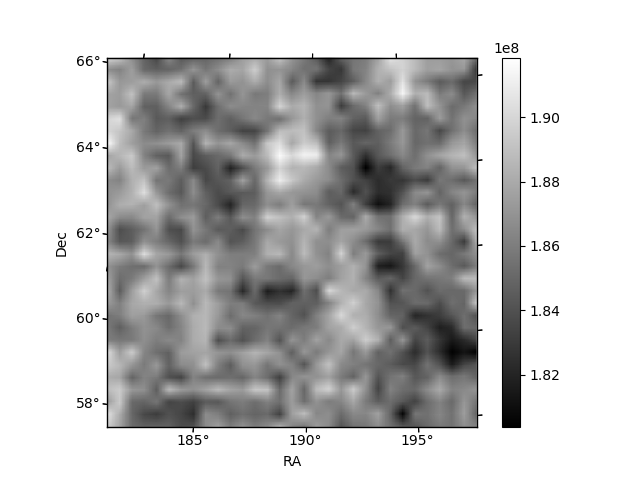
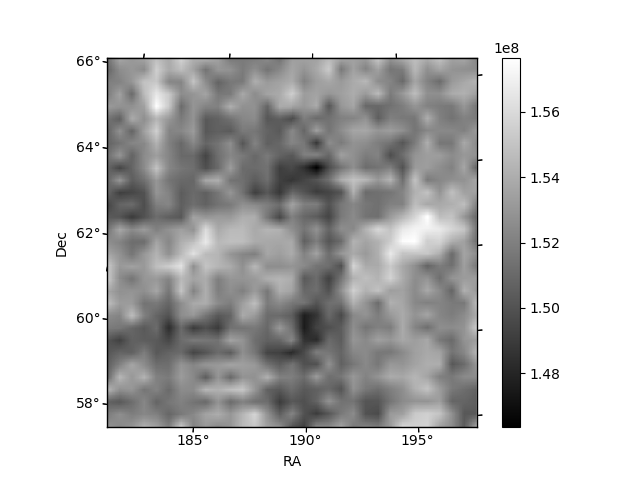
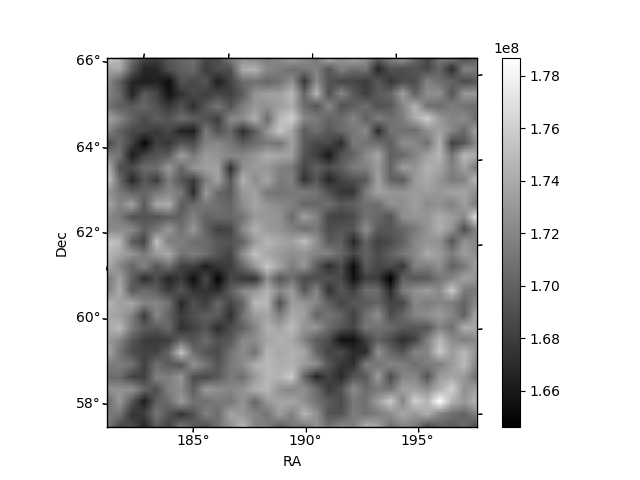
Histogram calculated using DETX and DETY for each event in the final _common_clean file
| Quadrant A |  |
 |
Quadrant B |
|---|---|---|---|
| Quadrant D | 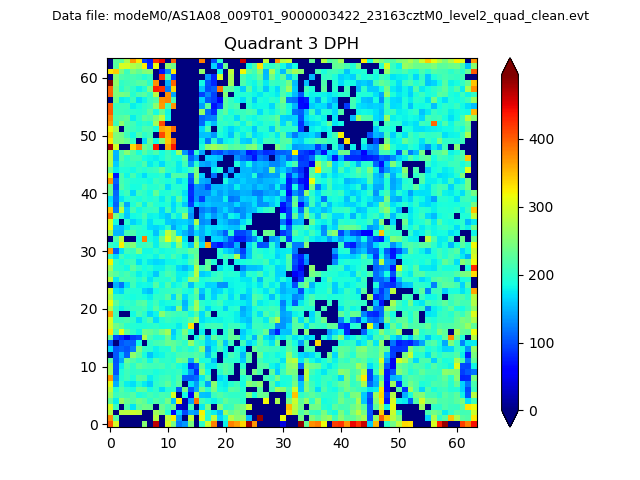 |
 |
Quadrant C |
| Plot type | Count rate plots | Images |
|---|---|---|
| Comparison with Poisson distribution Blue bars denote a histogram of data divided into 1 sec bins. Red curve is a Poisson curve with rate = median count rate of data. |
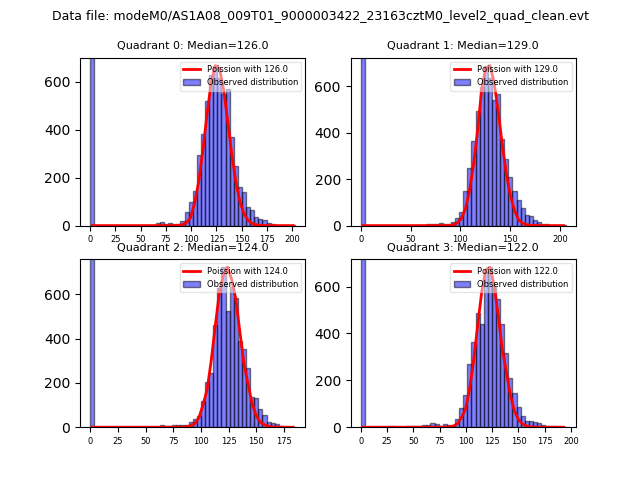 |
 |
| Quadrant-wise count rates Data is divided into 100 sec bins |
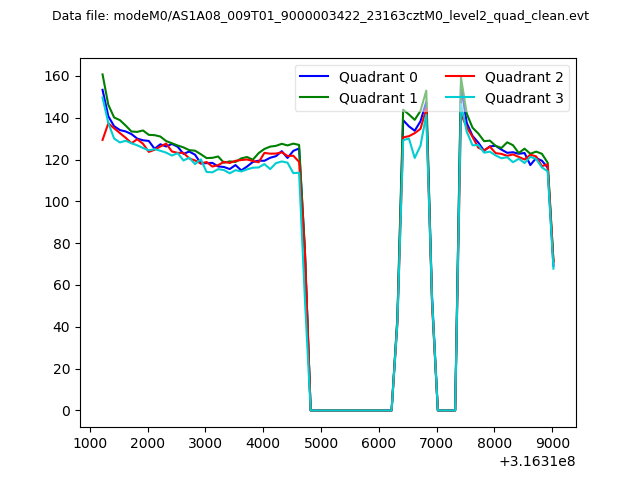 |
|
| Module-wise count rates for Quadrant A Data is divided into 100 sec bins |
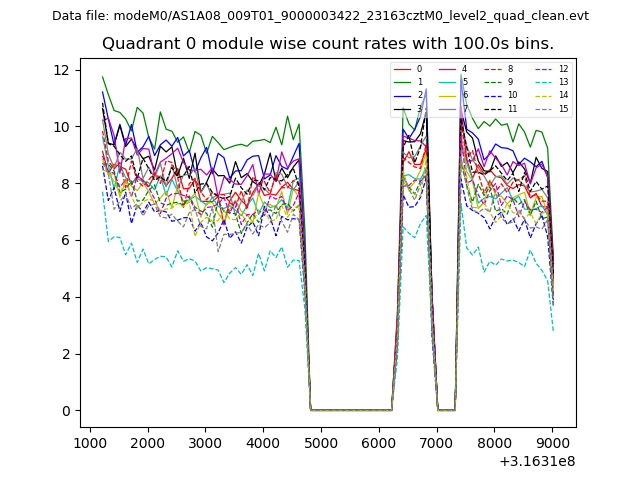 |
 |
| Module-wise count rates for Quadrant B Data is divided into 100 sec bins |
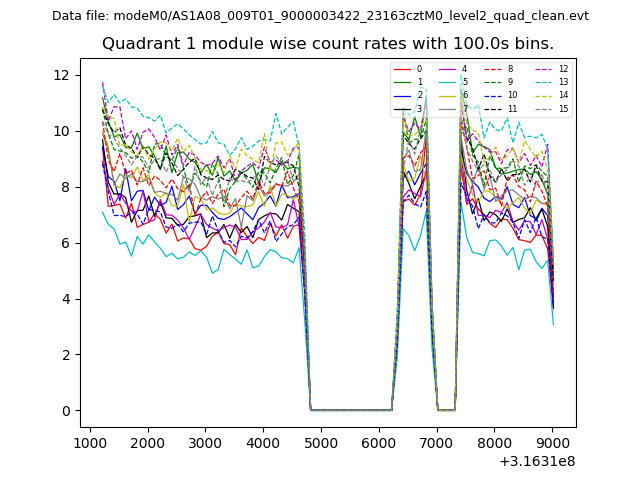 |
 |
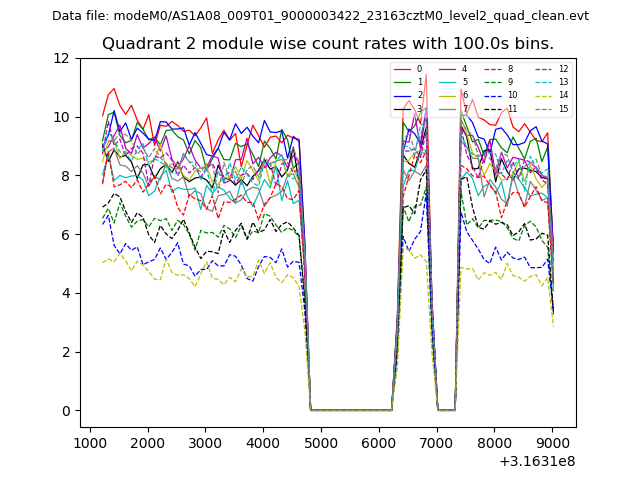
| Module-wise count rates for Quadrant C Data is divided into 100 sec bins |
 |
 |
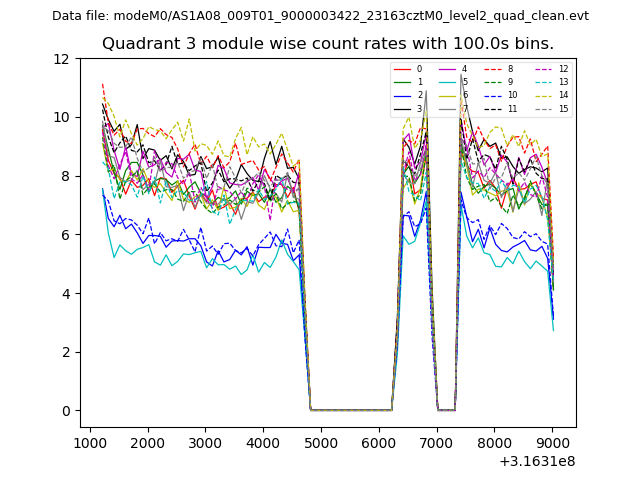
| Module-wise count rates for Quadrant D Data is divided into 100 sec bins |
 |
 |
| Parameter | Plot |
|---|---|
| CZT HV Monitor | 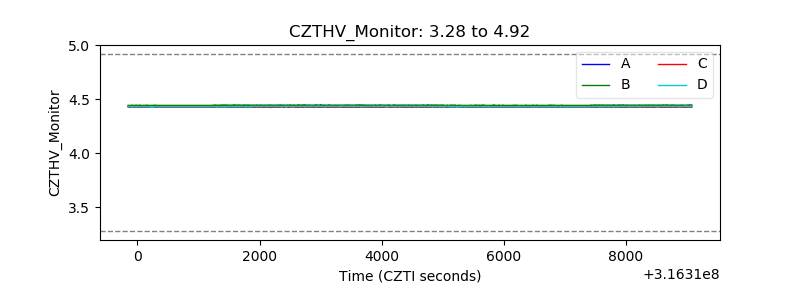 |
| D_VDD | 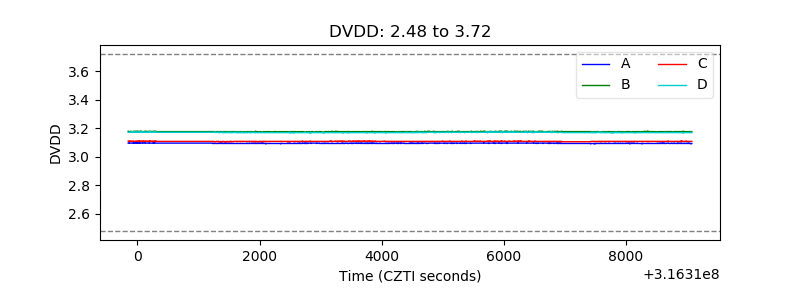 |
| Temperature 1 | 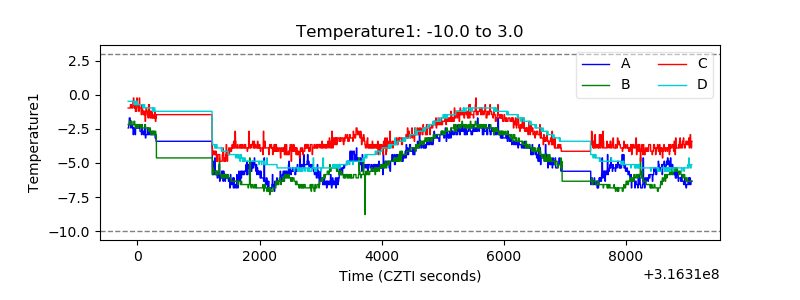 |
| Veto HV Monitor |  |
| Veto LLD | 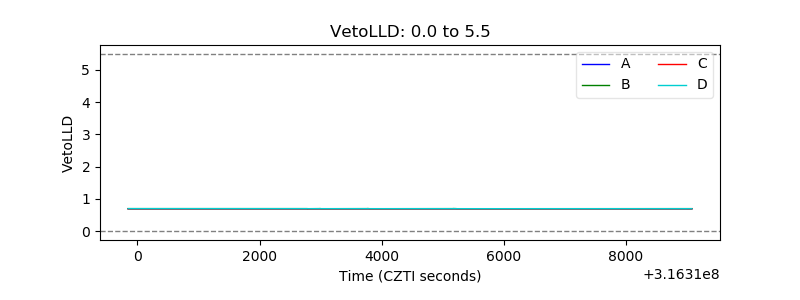 |
| Alpha Counter | 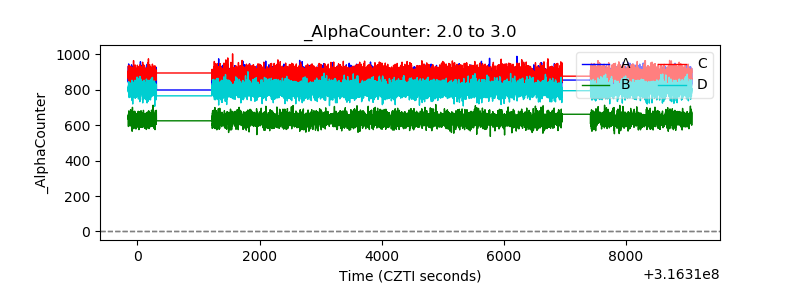 |
| _CPM_Rate |  |
| CZT Counter | 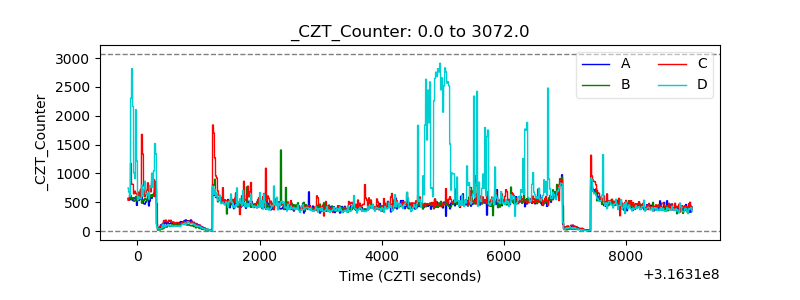 |
| +2.5 Volts monitor |  |
| +5 Volts monitor |  |
| _ROLL_ROT | 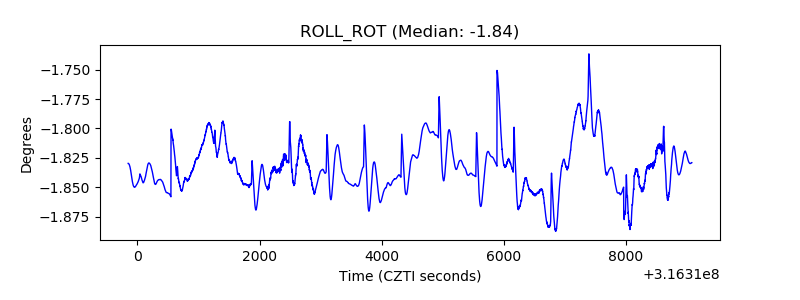 |
| _Roll_DEC |  |
| _Roll_RA |  |
| Veto Counter | 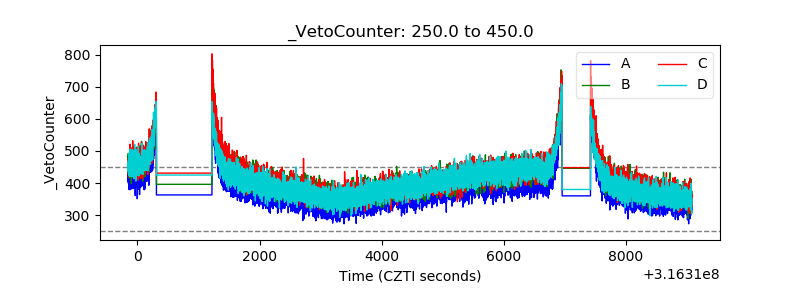 |