| Param | Original file | Final file |
|---|---|---|
| Filename | modeM0/AS1A08_009T01_9000003422_23165cztM0_level2.evt | modeM0/AS1A08_009T01_9000003422_23165cztM0_level2_quad_clean.evt |
| Size (bytes) | 473,506,560 | 109,719,360 |
| Size | 451.6 MB | 104.6 MB |
| Events in quadrant A | 3,276,106 | 704,665 |
| Events in quadrant B | 3,389,123 | 721,781 |
| Events in quadrant C | 3,802,718 | 695,855 |
| Events in quadrant D | 3,372,125 | 688,425 |
| Mode M0 | |||
|---|---|---|---|
| Quadrant | BADHDUFLAG | Total packets | Discarded packets |
| A | 0 | 14899 | 1 |
| B | 0 | 15076 | 1 |
| C | 0 | 16121 | 1 |
| D | 0 | 15431 | 1 |
| Mode SS | |||
|---|---|---|---|
| Quadrant | BADHDUFLAG | Total packets | Discarded packets |
| A | 0 | 148 | 0 |
| B | 0 | 148 | 0 |
| C | 0 | 148 | 0 |
| D | 0 | 148 | 0 |
| Mode M9 | |||
|---|---|---|---|
| Quadrant | BADHDUFLAG | Total packets | Discarded packets |
| A | 0 | 4 | 0 |
| B | 0 | 4 | 0 |
| C | 0 | 4 | 0 |
| D | 0 | 4 | 0 |
| Quadrant | Total seconds | Saturated seconds | Saturation percentage |
|---|---|---|---|
| A | 7362 | 17 | 0.230916% |
| B | 7363 | 29 | 0.393861% |
| C | 7363 | 91 | 1.235909% |
| D | 7362 | 24 | 0.325998% |
Noise dominated data is calculated using 1-second bins in cleaned event files. If a bin has >2000 counts, and if more than 50% of those come from <1% of pixels, then it is considered to be noise-dominated and hence unusable.
| Quadrant | # 1 sec bins | Bins with >0 counts | Bins with >2000 counts | High rate bins dominated by noise | Noise dominated (total time) | Noise dominated (detector-on time) | Marked lightcurve |
|---|---|---|---|---|---|---|---|
| A | 7702 | 7363 | 0 | 0 | 0.00% | 0.00% | 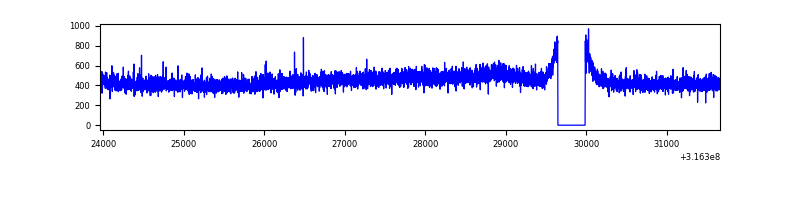 |
| B | 7703 | 7364 | 1 | 1 | 0.01% | 0.01% | 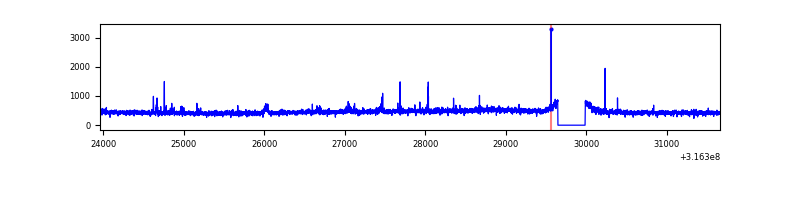 |
| C | 7703 | 7364 | 2 | 2 | 0.03% | 0.03% | 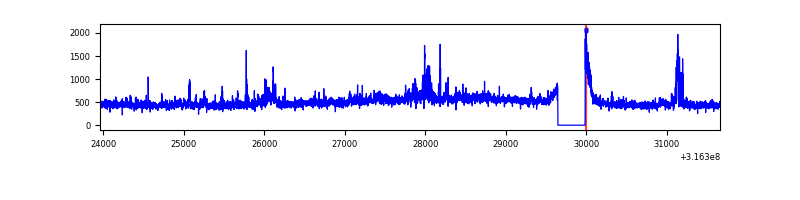 |
| D | 7702 | 7363 | 18 | 18 | 0.23% | 0.24% | 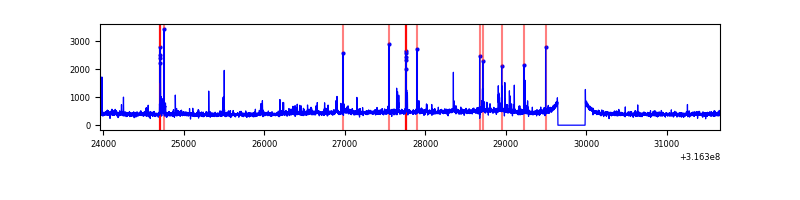 |
Top three noisy pixels from each quadrant. If the there are fewer than three noisy pixels in the level2.evt file, extra rows are filled as -1
| Pixel properties | Quadrant properties | ||||||
|---|---|---|---|---|---|---|---|
| Quadrant | DetID | PixID | Counts | Sigma | Mean | Median | Sigma |
| A | 13 | 254 | 9656 | 51.39 | 849 | 831 | 171.7 |
| A | 3 | 137 | 7677 | 39.87 | 849 | 831 | 171.7 |
| A | 0 | 226 | 7169 | 36.91 | 849 | 831 | 171.7 |
| B | 12 | 111 | 20203 | 120.79 | 847 | 826 | 160.4 |
| B | 11 | 111 | 17994 | 107.02 | 847 | 826 | 160.4 |
| B | 14 | 111 | 15724 | 92.87 | 847 | 826 | 160.4 |
| C | 0 | 10 | 465705 | 2452.47 | 811 | 815 | 189.6 |
| C | 14 | 238 | 127805 | 669.92 | 811 | 815 | 189.6 |
| C | 8 | 208 | 42561 | 220.23 | 811 | 815 | 189.6 |
| D | 1 | 52 | 115741 | 573.65 | 824 | 797 | 200.4 |
| D | 10 | 199 | 71752 | 354.12 | 824 | 797 | 200.4 |
| D | 2 | 234 | 30322 | 147.35 | 824 | 797 | 200.4 |
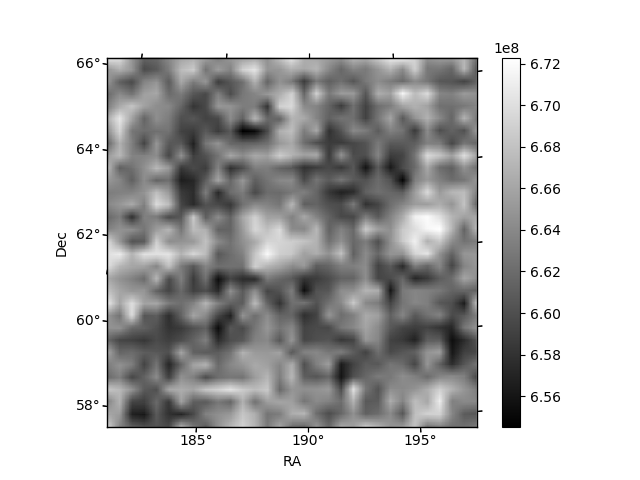
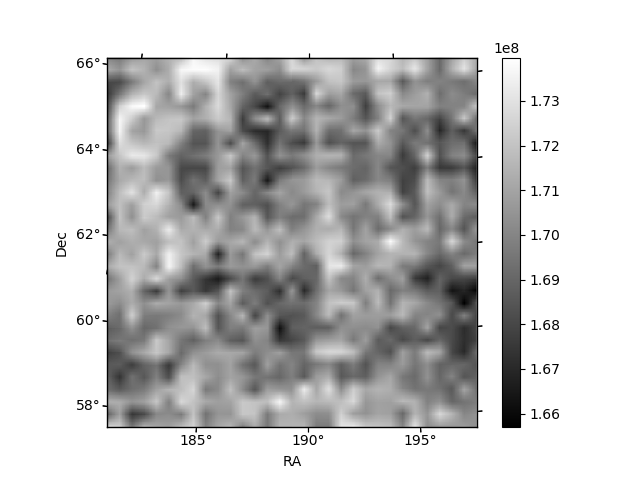
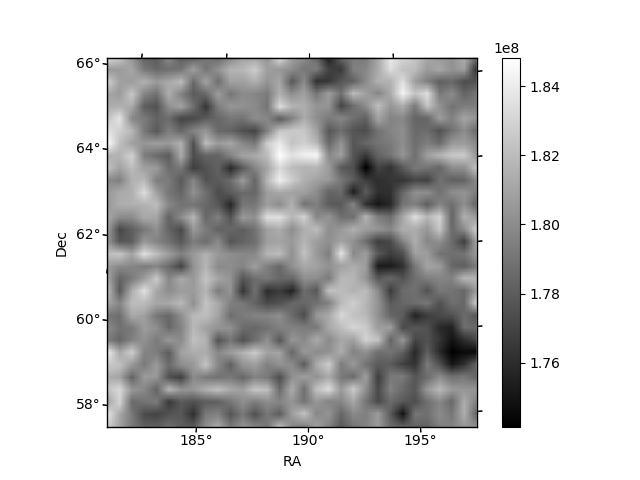
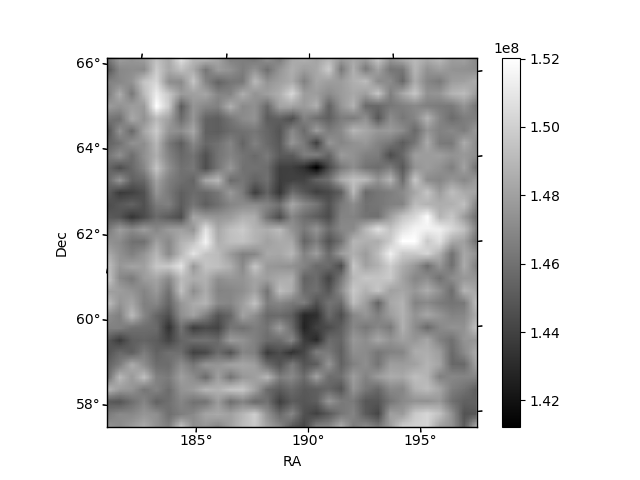
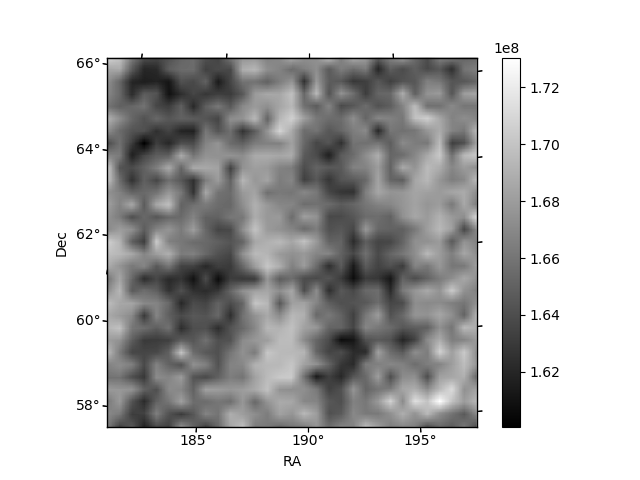
Histogram calculated using DETX and DETY for each event in the final _common_clean file
| Quadrant A | 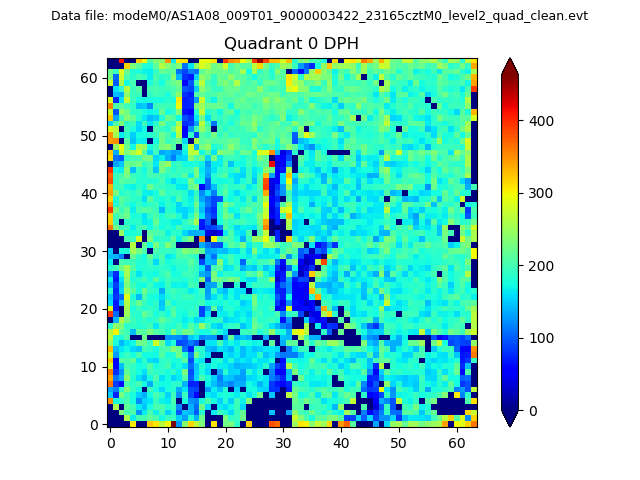 |
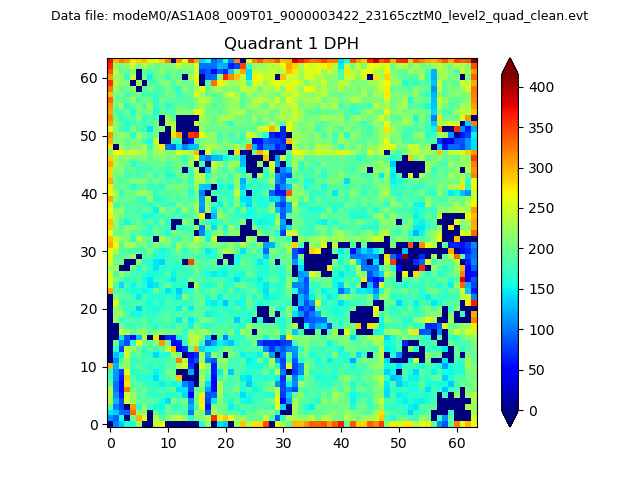 |
Quadrant B |
|---|---|---|---|
| Quadrant D | 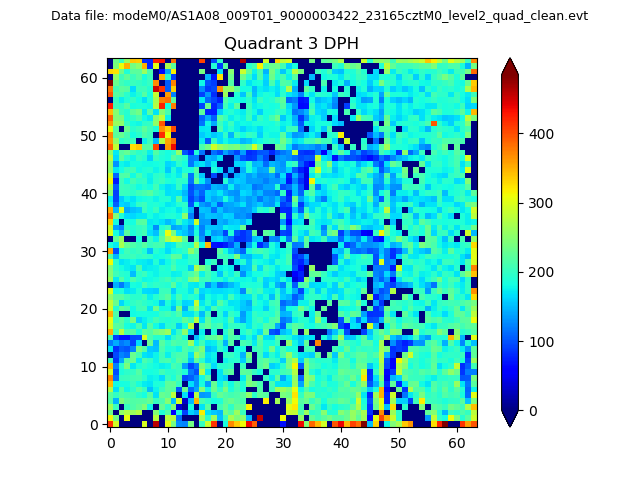 |
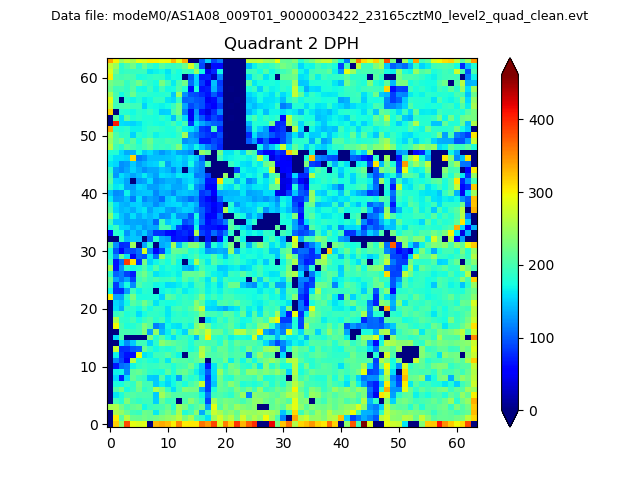 |
Quadrant C |
| Plot type | Count rate plots | Images |
|---|---|---|
| Comparison with Poisson distribution Blue bars denote a histogram of data divided into 1 sec bins. Red curve is a Poisson curve with rate = median count rate of data. |
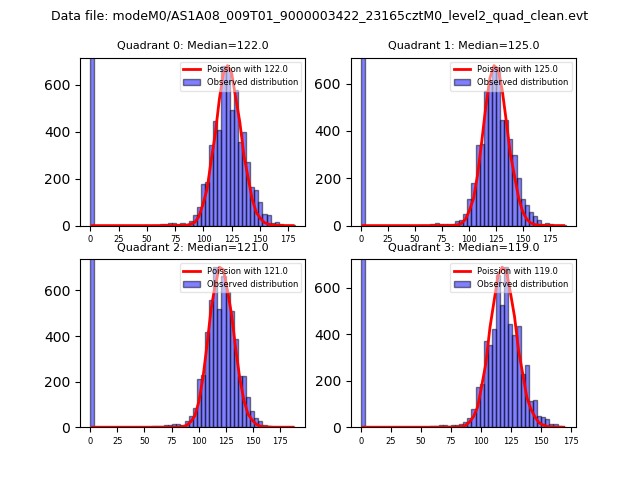 |
 |
| Quadrant-wise count rates Data is divided into 100 sec bins |
 |
|
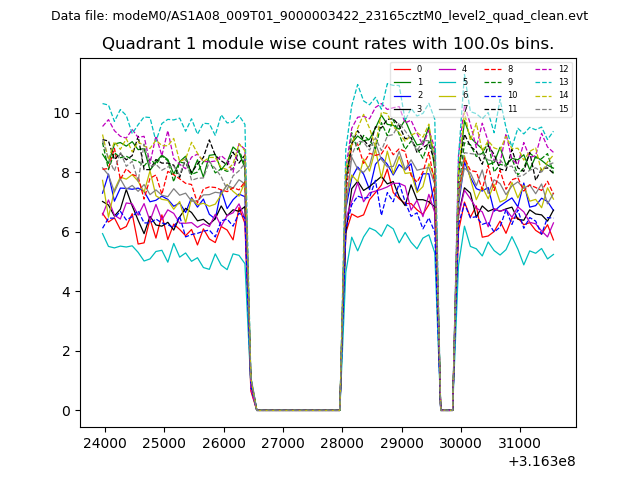
| Module-wise count rates for Quadrant A Data is divided into 100 sec bins |
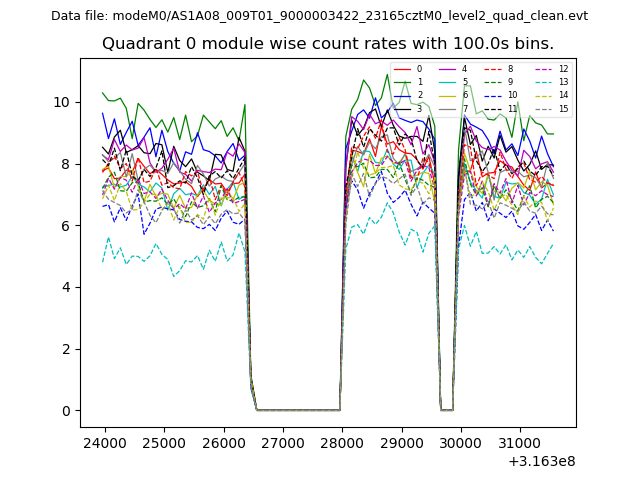 |
 |
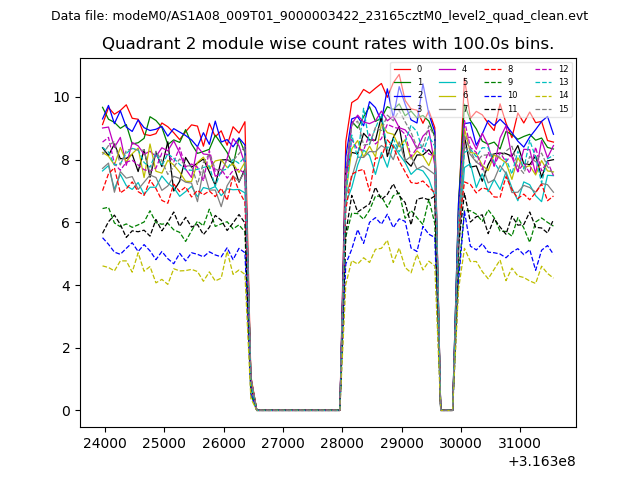
| Module-wise count rates for Quadrant B Data is divided into 100 sec bins |
 |
 |
| Module-wise count rates for Quadrant C Data is divided into 100 sec bins |
 |
 |
| Module-wise count rates for Quadrant D Data is divided into 100 sec bins |
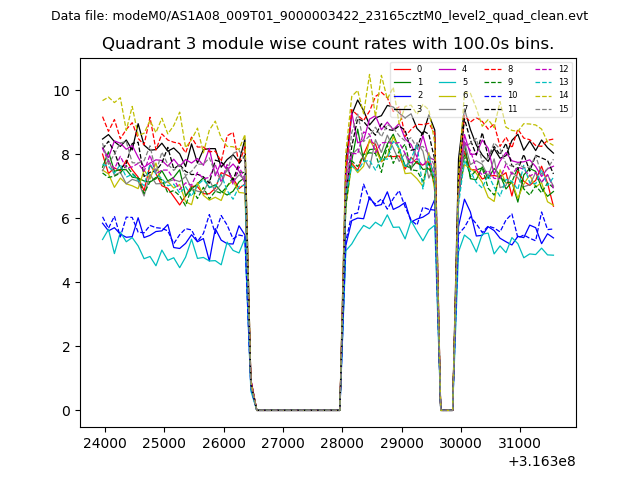 |
 |
| Parameter | Plot |
|---|---|
| CZT HV Monitor | 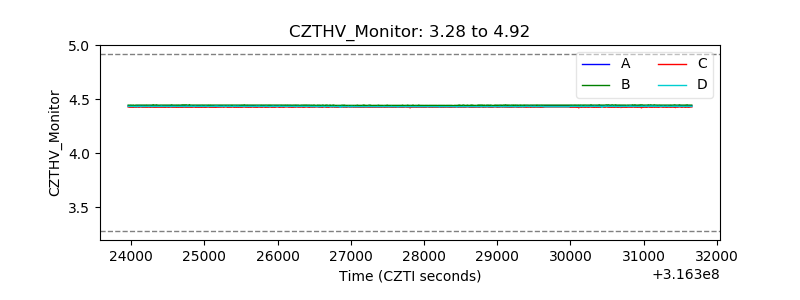 |
| D_VDD | 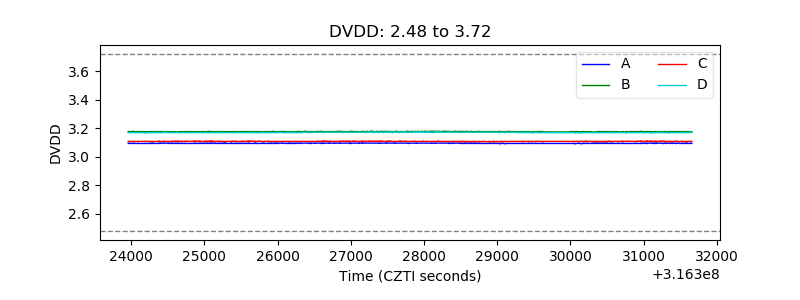 |
| Temperature 1 | 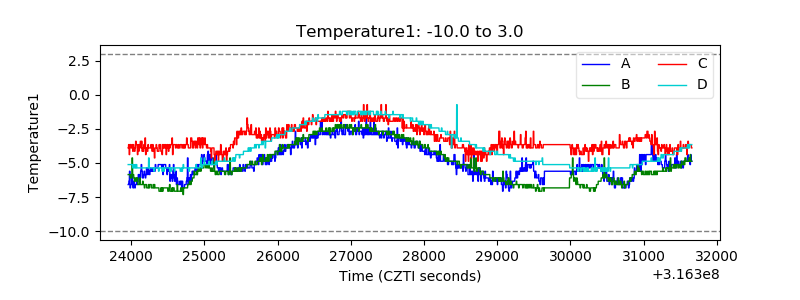 |
| Veto HV Monitor | 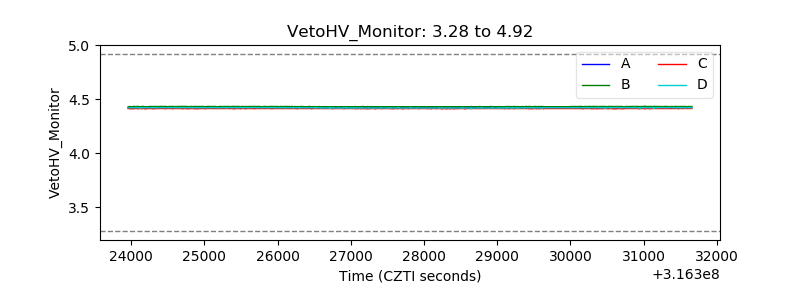 |
| Veto LLD | 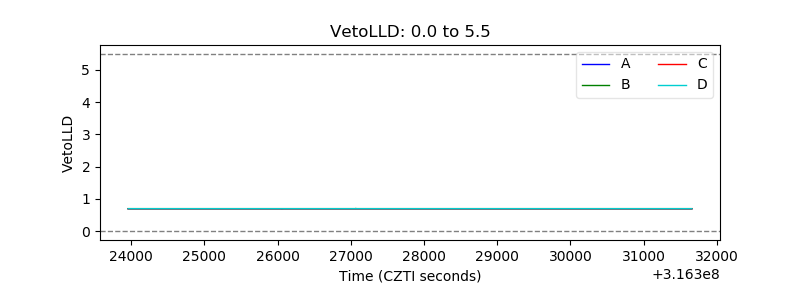 |
| Alpha Counter | 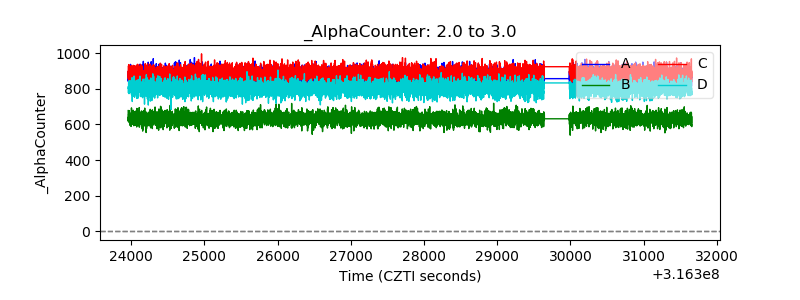 |
| _CPM_Rate | 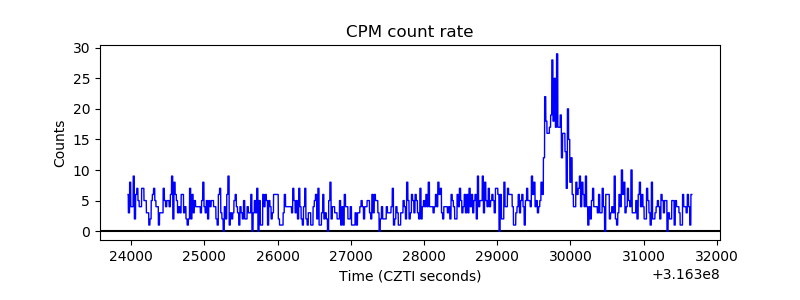 |
| CZT Counter |  |
| +2.5 Volts monitor |  |
| +5 Volts monitor |  |
| _ROLL_ROT | 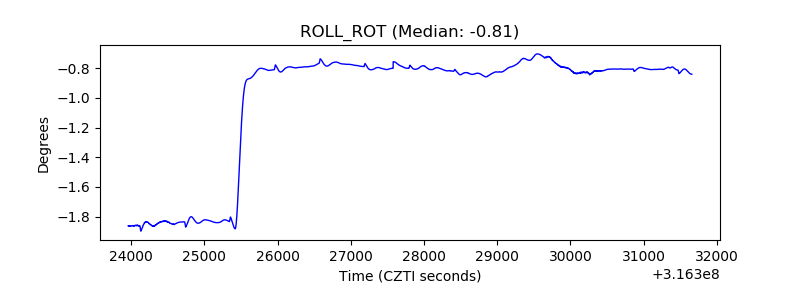 |
| _Roll_DEC | 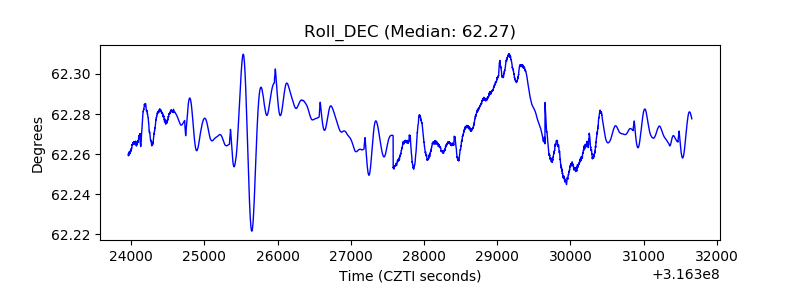 |
| _Roll_RA | 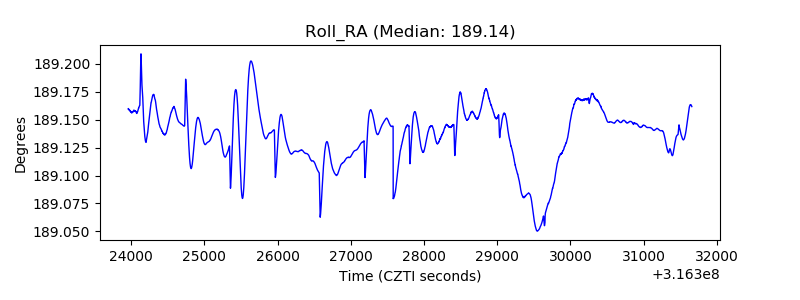 |
| Veto Counter | 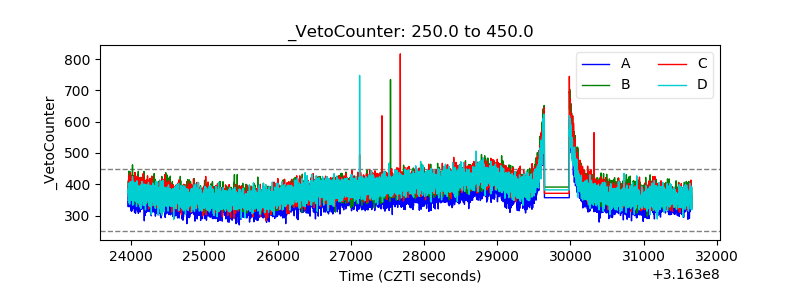 |