| Param | Original file | Final file |
|---|---|---|
| Filename | modeM0/AS1A08_009T01_9000003422_23167cztM0_level2.evt | modeM0/AS1A08_009T01_9000003422_23167cztM0_level2_quad_clean.evt |
| Size (bytes) | 263,070,720 | 52,416,000 |
| Size | 250.9 MB | 50.0 MB |
| Events in quadrant A | 1,876,059 | 324,162 |
| Events in quadrant B | 1,936,301 | 329,905 |
| Events in quadrant C | 2,025,802 | 318,519 |
| Events in quadrant D | 1,838,712 | 315,366 |
| Mode M0 | |||
|---|---|---|---|
| Quadrant | BADHDUFLAG | Total packets | Discarded packets |
| A | 0 | 8514 | 0 |
| B | 0 | 8602 | 0 |
| C | 0 | 8676 | 0 |
| D | 0 | 8570 | 0 |
| Mode SS | |||
|---|---|---|---|
| Quadrant | BADHDUFLAG | Total packets | Discarded packets |
| A | 0 | 84 | 0 |
| B | 0 | 84 | 0 |
| C | 0 | 84 | 0 |
| D | 0 | 84 | 0 |
| Quadrant | Total seconds | Saturated seconds | Saturation percentage |
|---|---|---|---|
| A | 4247 | 1 | 0.023546% |
| B | 4248 | 2 | 0.047081% |
| C | 4248 | 20 | 0.470810% |
| D | 4248 | 7 | 0.164783% |
Noise dominated data is calculated using 1-second bins in cleaned event files. If a bin has >2000 counts, and if more than 50% of those come from <1% of pixels, then it is considered to be noise-dominated and hence unusable.
| Quadrant | # 1 sec bins | Bins with >0 counts | Bins with >2000 counts | High rate bins dominated by noise | Noise dominated (total time) | Noise dominated (detector-on time) | Marked lightcurve |
|---|---|---|---|---|---|---|---|
| A | 4247 | 4247 | 0 | 0 | 0.00% | 0.00% | 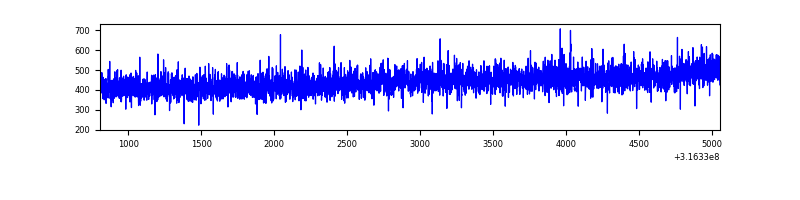 |
| B | 4248 | 4248 | 0 | 0 | 0.00% | 0.00% | 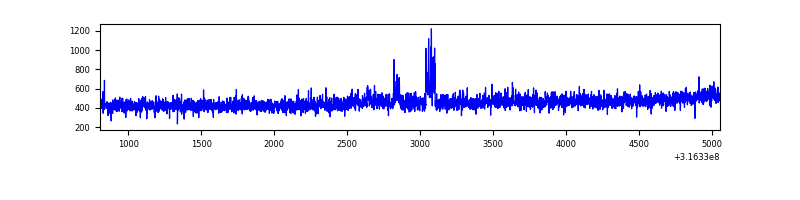 |
| C | 4248 | 4248 | 0 | 0 | 0.00% | 0.00% | 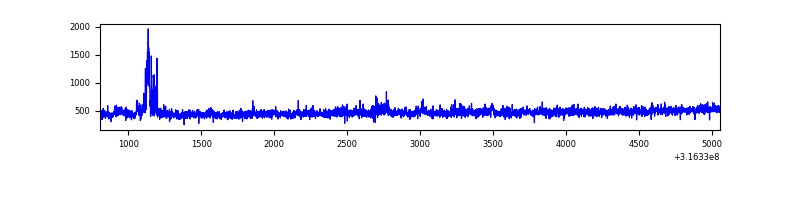 |
| D | 4248 | 4248 | 4 | 4 | 0.09% | 0.09% | 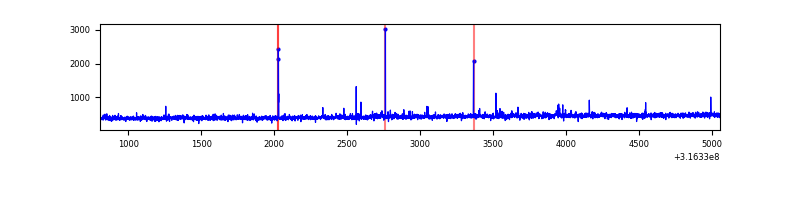 |
Top three noisy pixels from each quadrant. If the there are fewer than three noisy pixels in the level2.evt file, extra rows are filled as -1
| Pixel properties | Quadrant properties | ||||||
|---|---|---|---|---|---|---|---|
| Quadrant | DetID | PixID | Counts | Sigma | Mean | Median | Sigma |
| A | 13 | 254 | 6032 | 56.33 | 486 | 476 | 98.6 |
| A | 3 | 137 | 4342 | 39.2 | 486 | 476 | 98.6 |
| A | 0 | 226 | 4118 | 36.93 | 486 | 476 | 98.6 |
| B | 0 | 190 | 29049 | 307.77 | 483 | 470 | 92.9 |
| B | 12 | 111 | 11222 | 115.79 | 483 | 470 | 92.9 |
| B | 11 | 111 | 10241 | 105.22 | 483 | 470 | 92.9 |
| C | 0 | 10 | 86583 | 784.62 | 467 | 468 | 109.8 |
| C | 14 | 238 | 74388 | 673.51 | 467 | 468 | 109.8 |
| C | 8 | 208 | 41651 | 375.23 | 467 | 468 | 109.8 |
| D | 2 | 234 | 19000 | 158.21 | 475 | 460 | 117.2 |
| D | 1 | 52 | 12629 | 103.84 | 475 | 460 | 117.2 |
| D | 8 | 195 | 11482 | 94.05 | 475 | 460 | 117.2 |
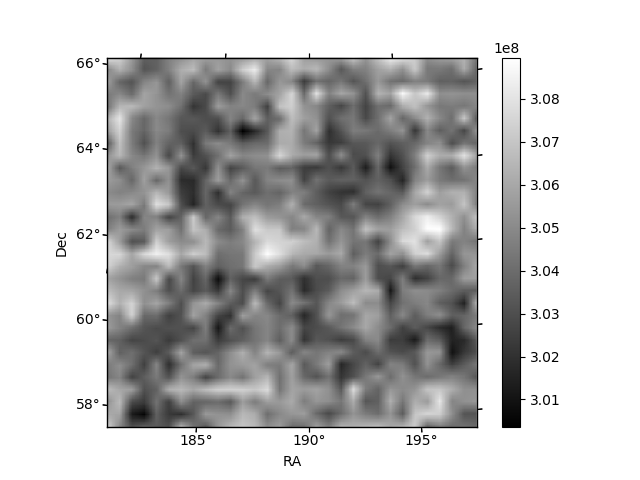
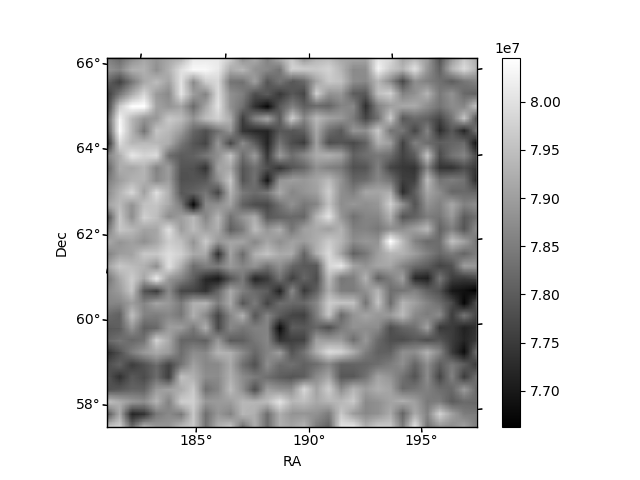
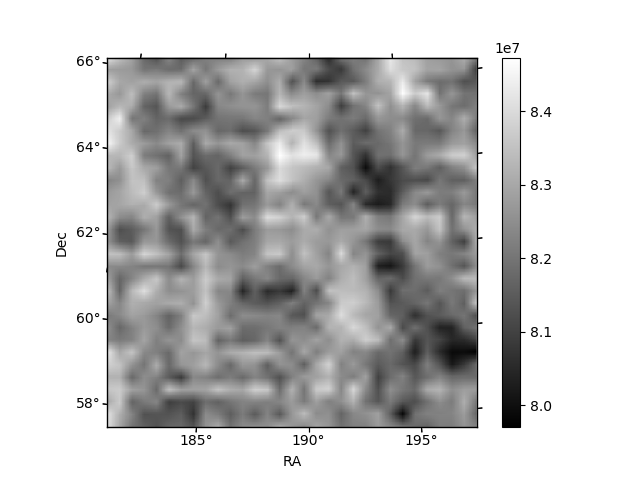
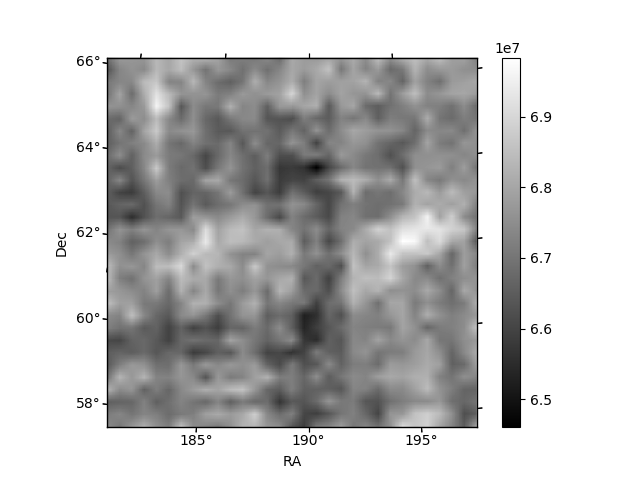
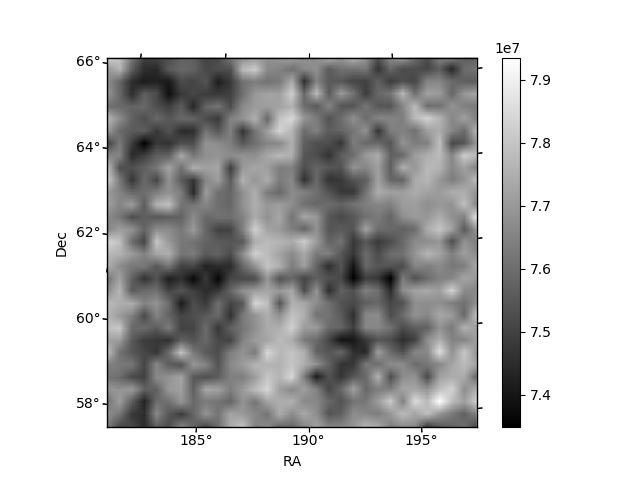
Histogram calculated using DETX and DETY for each event in the final _common_clean file
| Quadrant A | 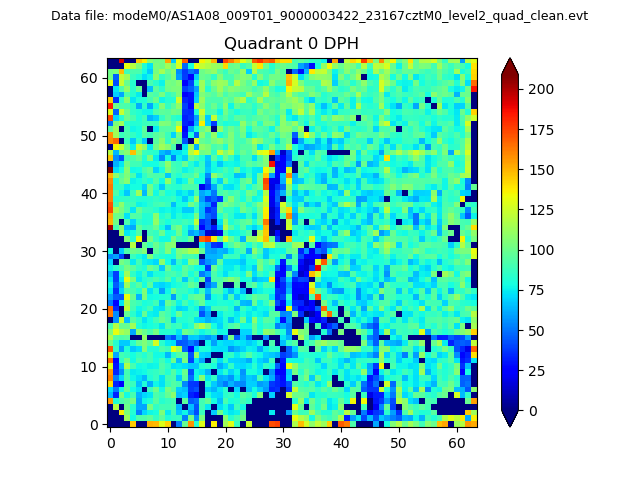 |
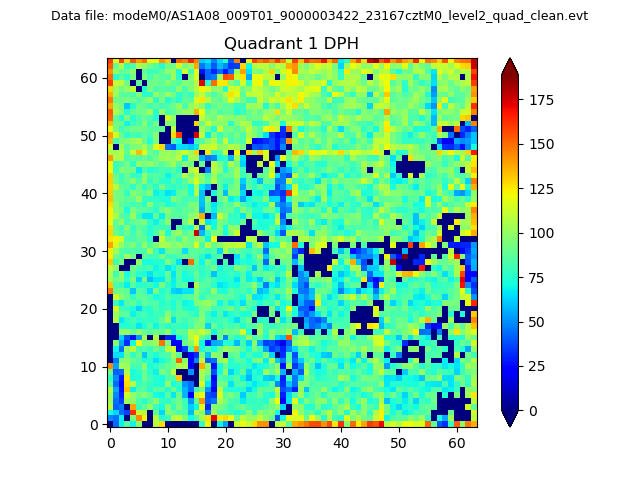 |
Quadrant B |
|---|---|---|---|
| Quadrant D | 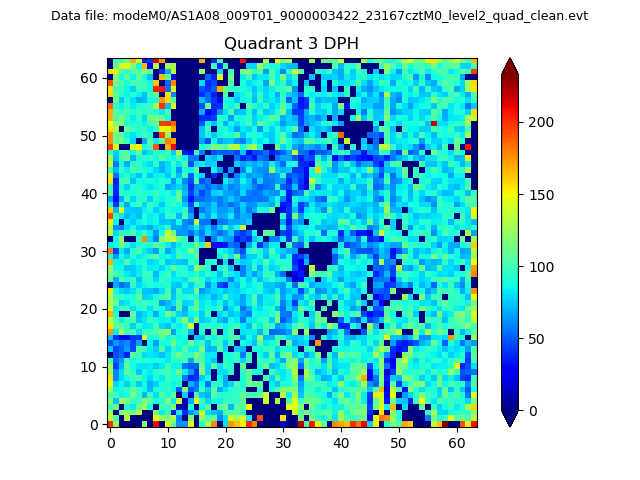 |
 |
Quadrant C |
| Plot type | Count rate plots | Images |
|---|---|---|
| Comparison with Poisson distribution Blue bars denote a histogram of data divided into 1 sec bins. Red curve is a Poisson curve with rate = median count rate of data. |
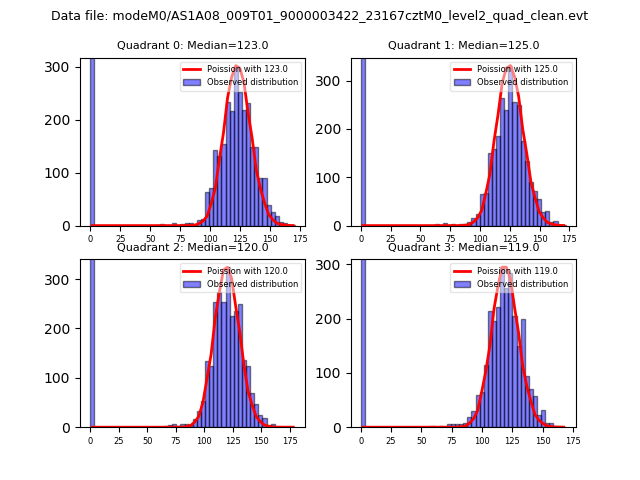 |
 |
| Quadrant-wise count rates Data is divided into 100 sec bins |
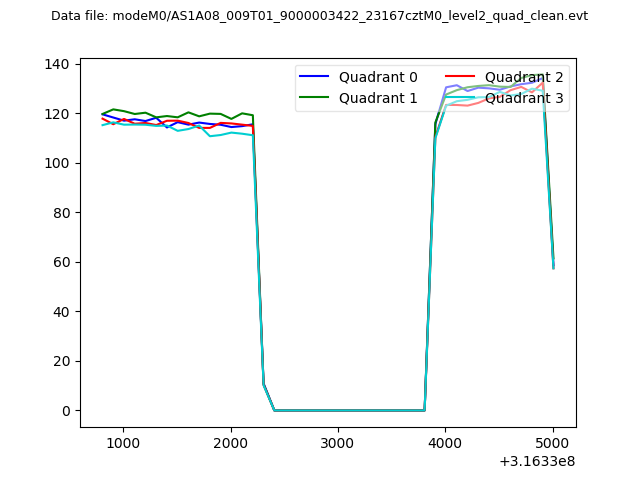 |
|
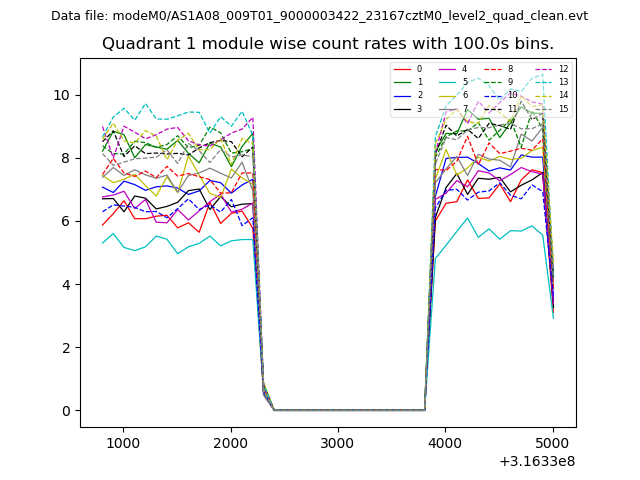
| Module-wise count rates for Quadrant A Data is divided into 100 sec bins |
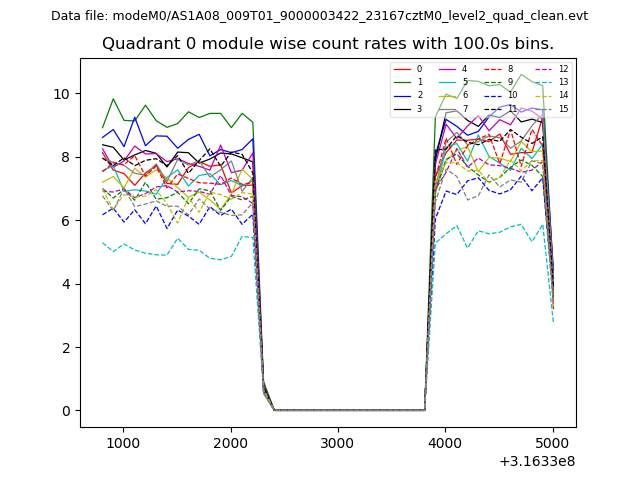 |
 |
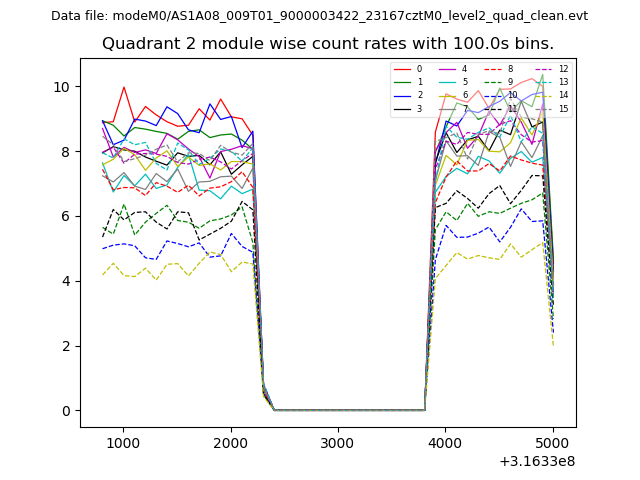
| Module-wise count rates for Quadrant B Data is divided into 100 sec bins |
 |
 |
| Module-wise count rates for Quadrant C Data is divided into 100 sec bins |
 |
 |
| Module-wise count rates for Quadrant D Data is divided into 100 sec bins |
 |
 |
| Parameter | Plot |
|---|---|
| CZT HV Monitor | 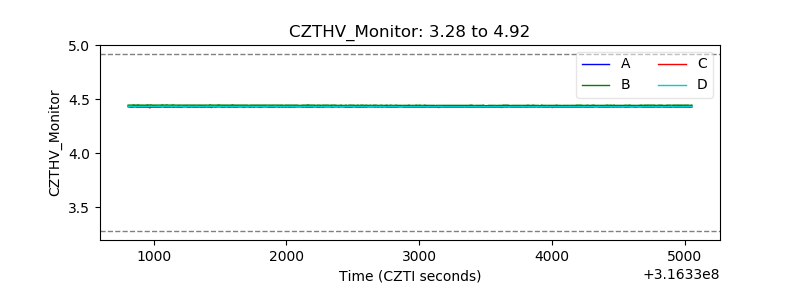 |
| D_VDD | 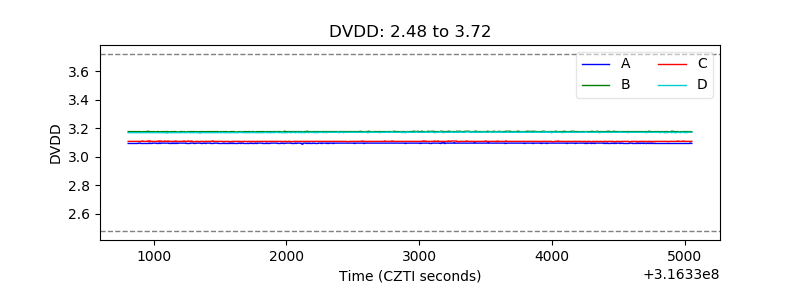 |
| Temperature 1 | 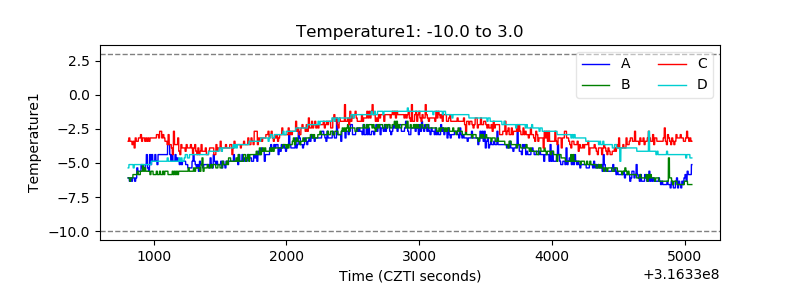 |
| Veto HV Monitor | 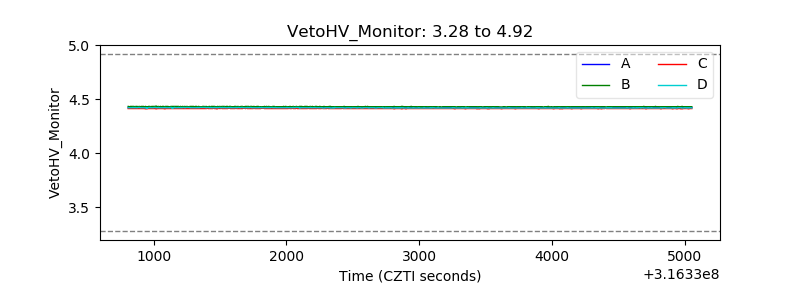 |
| Veto LLD | 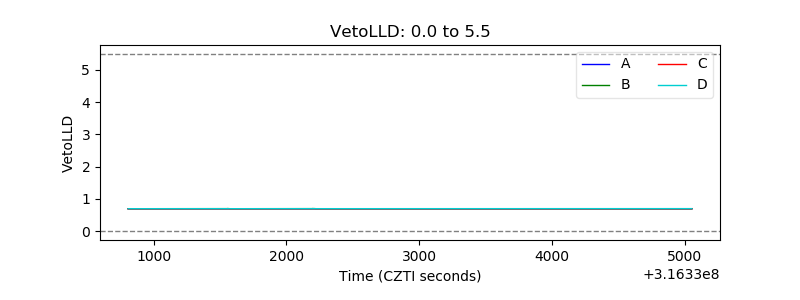 |
| Alpha Counter | 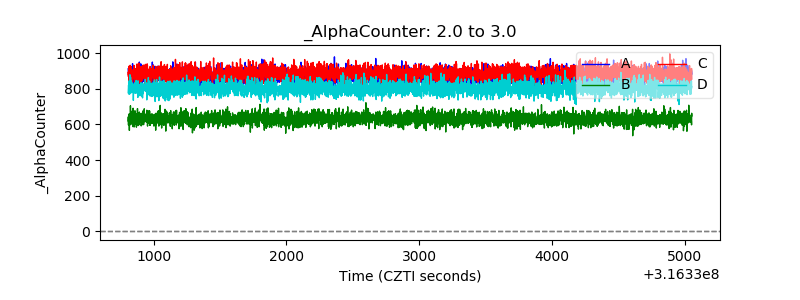 |
| _CPM_Rate | 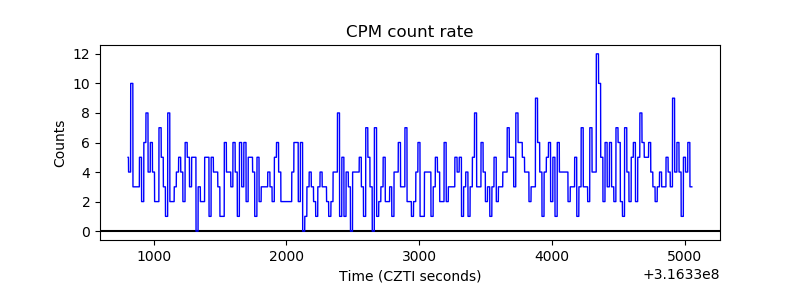 |
| CZT Counter | 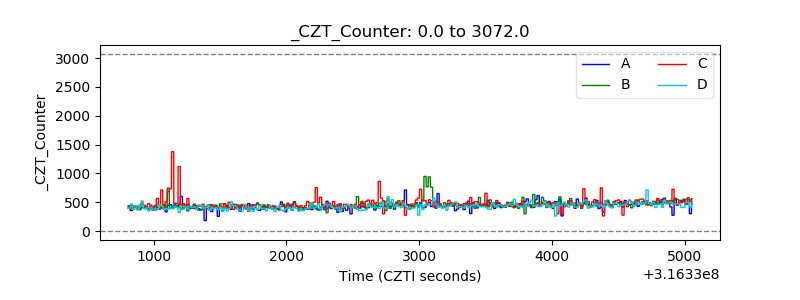 |
| +2.5 Volts monitor | 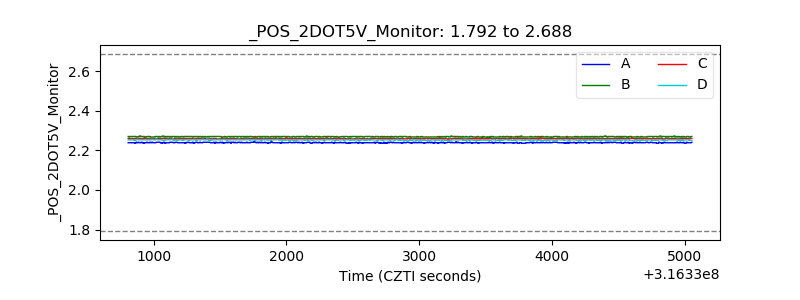 |
| +5 Volts monitor |  |
| _ROLL_ROT | 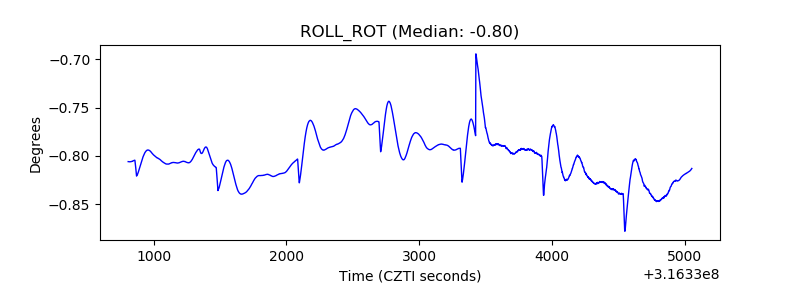 |
| _Roll_DEC |  |
| _Roll_RA | 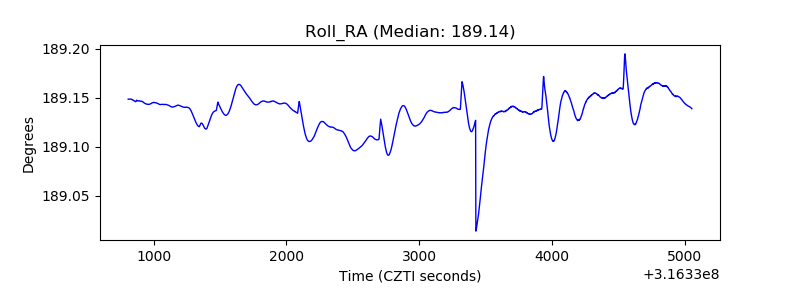 |
| Veto Counter | 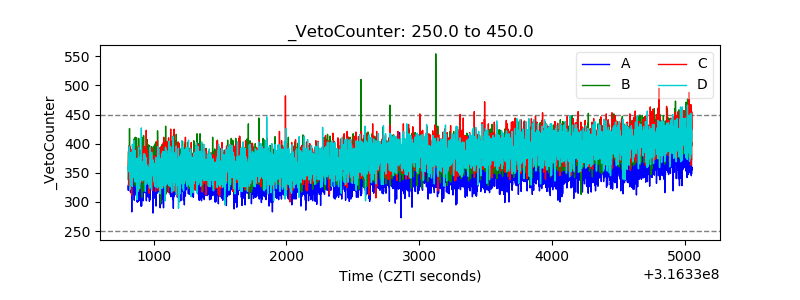 |