| Param | Original file | Final file |
|---|---|---|
| Filename | modeM0/AS1A07_148T05_9000003424cztM0_level2.fits | modeM0/AS1A07_148T05_9000003424cztM0_level2_quad_clean.evt |
| Size (bytes) | 531,596,160 | 477,881,280 |
| Size | 507.0 MB | 455.7 MB |
| Events in quadrant A | 3,276,194 | 2,778,225 |
| Events in quadrant B | 3,162,560 | 2,880,778 |
| Events in quadrant C | 3,237,870 | 2,760,975 |
| Events in quadrant D | 2,820,694 | 2,451,422 |
| Mode SS | |||
|---|---|---|---|
| Quadrant | BADHDUFLAG | Total packets | Discarded packets |
| A | 0 | 1066 | 0 |
| B | 0 | 1066 | 0 |
| C | 0 | 1066 | 0 |
| D | 0 | 1066 | 0 |
| Mode M0 | |||
|---|---|---|---|
| Quadrant | BADHDUFLAG | Total packets | Discarded packets |
| A | 0 | 126984 | 0 |
| B | 0 | 116580 | 0 |
| C | 0 | 122752 | 0 |
| D | 0 | 140033 | 0 |
| Mode M9 | |||
|---|---|---|---|
| Quadrant | BADHDUFLAG | Total packets | Discarded packets |
| A | 0 | 108 | 0 |
| B | 0 | 108 | 0 |
| C | 0 | 108 | 0 |
| D | 0 | 108 | 0 |
| Quadrant | Total seconds | Saturated seconds | Saturation percentage |
|---|---|---|---|
| A | 52486 | 1941 | 3.698129% |
| B | 52486 | 1301 | 2.478756% |
| C | 52486 | 1661 | 3.164653% |
| D | 52485 | 2617 | 4.986187% |
Noise dominated data is calculated using 1-second bins in cleaned event files. If a bin has >2000 counts, and if more than 50% of those come from <1% of pixels, then it is considered to be noise-dominated and hence unusable.
| Quadrant | # 1 sec bins | Bins with >0 counts | Bins with >2000 counts | High rate bins dominated by noise | Noise dominated (total time) | Noise dominated (detector-on time) | Marked lightcurve |
|---|---|---|---|---|---|---|---|
| A | 66437 | 52482 | 0 | 0 | 0.00% | 0.00% |  |
| B | 66437 | 52464 | 0 | 0 | 0.00% | 0.00% | 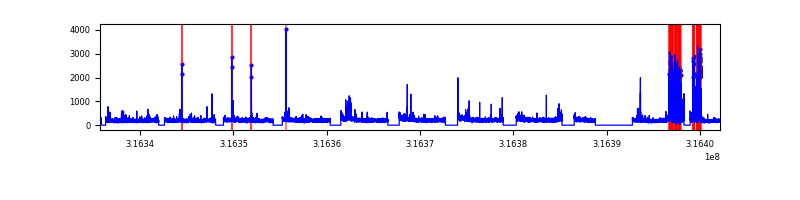 |
| C | 66437 | 52479 | 0 | 0 | 0.00% | 0.00% |  |
| D | 66437 | 52480 | 0 | 0 | 0.00% | 0.00% |  |
Top three noisy pixels from each quadrant. If the there are fewer than three noisy pixels in the level2.evt file, extra rows are filled as -1
| Pixel properties | Quadrant properties | ||||||
|---|---|---|---|---|---|---|---|
| Quadrant | DetID | PixID | Counts | Sigma | Mean | Median | Sigma |
| A | 0 | 29 | 3139 | 11.05 | 852 | 798 | 211.9 |
| A | 7 | 110 | 2586 | 8.44 | 852 | 798 | 211.9 |
| A | 9 | 19 | 2396 | 7.54 | 852 | 798 | 211.9 |
| B | 2 | 9 | 2426 | 9.89 | 837 | 801 | 164.2 |
| B | 3 | 80 | 2120 | 8.03 | 837 | 801 | 164.2 |
| B | 5 | 232 | 2105 | 7.94 | 837 | 801 | 164.2 |
| C | 9 | 209 | 2213 | 6.46 | 857 | 805 | 218.0 |
| C | 3 | 126 | 2177 | 6.29 | 857 | 805 | 218.0 |
| C | 3 | 158 | 2112 | 5.99 | 857 | 805 | 218.0 |
| D | 3 | 14 | 2045 | 6.06 | 806 | 735 | 216.3 |
| D | 15 | 46 | 2036 | 6.01 | 806 | 735 | 216.3 |
| D | 6 | 231 | 2010 | 5.89 | 806 | 735 | 216.3 |
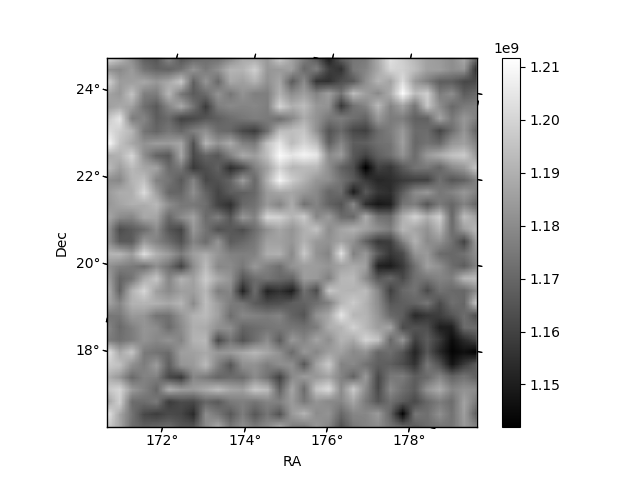
Histogram calculated using DETX and DETY for each event in the final _common_clean file
| Quadrant A | 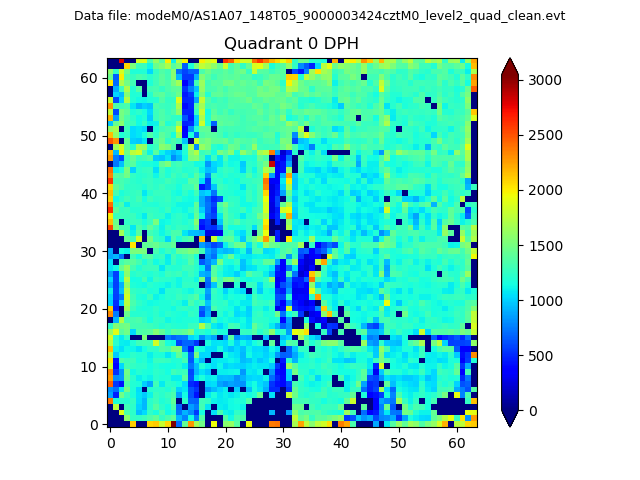 |
 |
Quadrant B |
|---|---|---|---|
| Quadrant D |  |
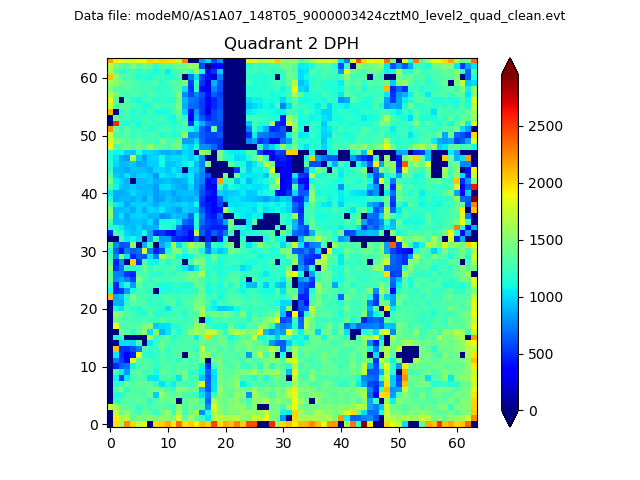 |
Quadrant C |
| Plot type | Count rate plots | Images |
|---|---|---|
| Comparison with Poisson distribution Blue bars denote a histogram of data divided into 1 sec bins. Red curve is a Poisson curve with rate = median count rate of data. |
 |
 |
| Quadrant-wise count rates Data is divided into 100 sec bins |
 |
|
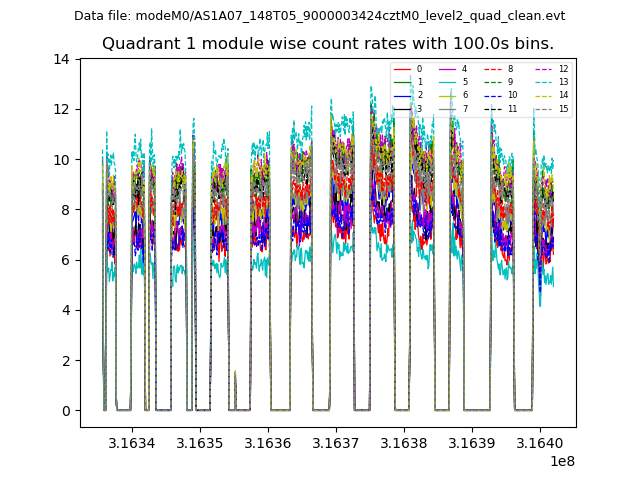
| Module-wise count rates for Quadrant A Data is divided into 100 sec bins |
 |
 |
| Module-wise count rates for Quadrant B Data is divided into 100 sec bins |
 |
 |
| Module-wise count rates for Quadrant C Data is divided into 100 sec bins |
 |
 |
| Module-wise count rates for Quadrant D Data is divided into 100 sec bins |
 |
 |
| Parameter | Plot |
|---|---|
| CZT HV Monitor | 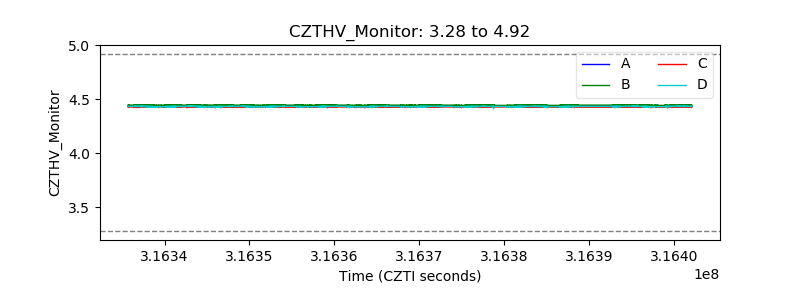 |
| D_VDD | 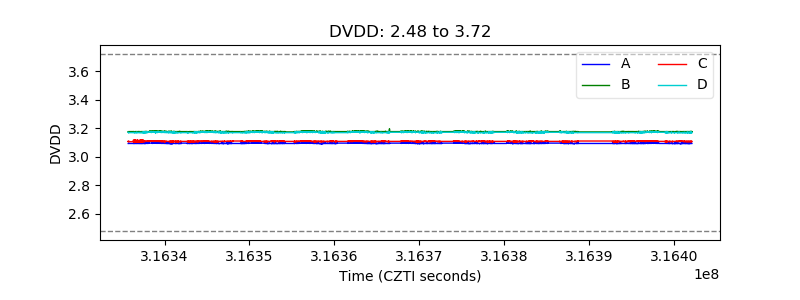 |
| Temperature 1 | 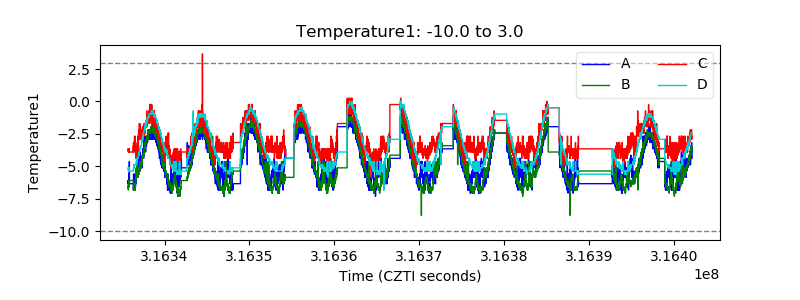 |
| Veto HV Monitor |  |
| Veto LLD | 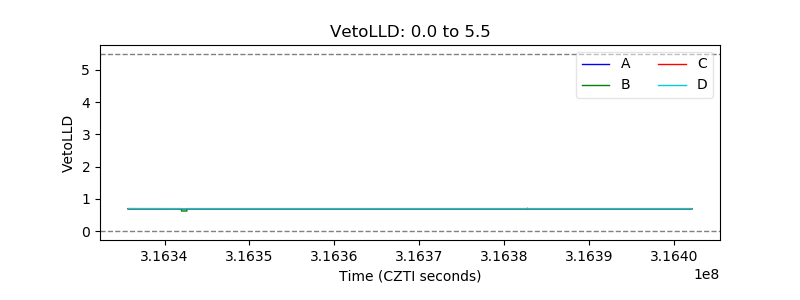 |
| Alpha Counter |  |
| _CPM_Rate |  |
| CZT Counter | 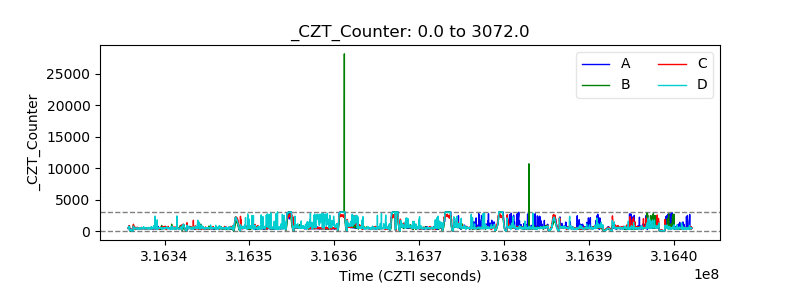 |
| +2.5 Volts monitor |  |
| +5 Volts monitor | 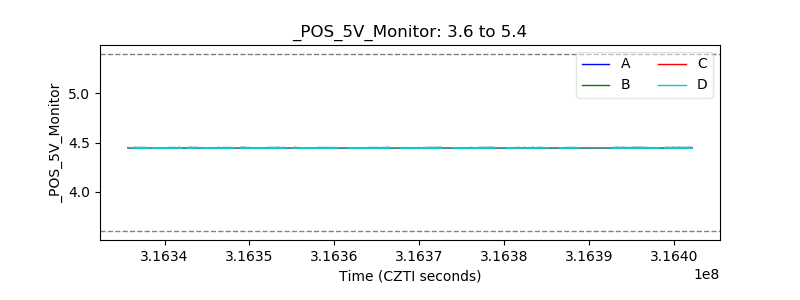 |
| _ROLL_ROT |  |
| _Roll_DEC | 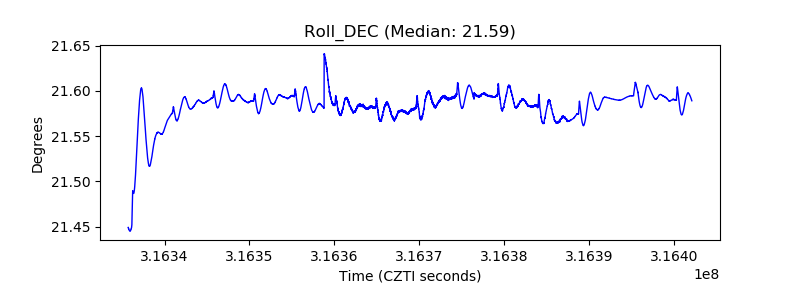 |
| _Roll_RA | 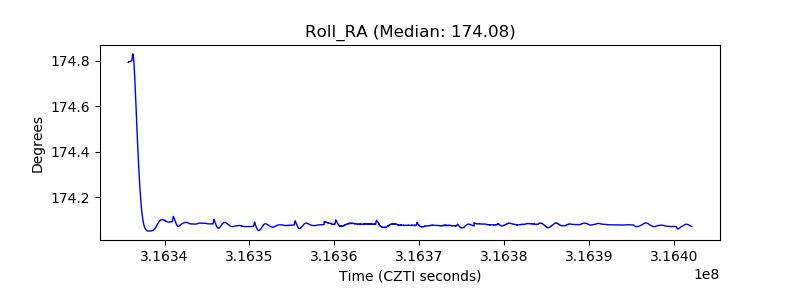 |
| Veto Counter |  |