| Param | Original file | Final file |
|---|---|---|
| Filename | modeM0/AS1A07_148T05_9000003424_23168cztM0_level2.evt | modeM0/AS1A07_148T05_9000003424_23168cztM0_level2_quad_clean.evt |
| Size (bytes) | 451,163,520 | 72,832,320 |
| Size | 430.3 MB | 69.5 MB |
| Events in quadrant A | 3,098,144 | 441,163 |
| Events in quadrant B | 3,196,913 | 449,965 |
| Events in quadrant C | 3,375,785 | 431,573 |
| Events in quadrant D | 3,546,870 | 425,149 |
| Mode SS | |||
|---|---|---|---|
| Quadrant | BADHDUFLAG | Total packets | Discarded packets |
| A | 0 | 132 | 0 |
| B | 0 | 132 | 0 |
| C | 0 | 132 | 0 |
| D | 0 | 132 | 0 |
| Mode M0 | |||
|---|---|---|---|
| Quadrant | BADHDUFLAG | Total packets | Discarded packets |
| A | 0 | 13323 | 1 |
| B | 0 | 13503 | 1 |
| C | 0 | 14194 | 1 |
| D | 0 | 14712 | 1 |
| Mode M9 | |||
|---|---|---|---|
| Quadrant | BADHDUFLAG | Total packets | Discarded packets |
| A | 0 | 9 | 0 |
| B | 0 | 9 | 0 |
| C | 0 | 9 | 0 |
| D | 0 | 9 | 0 |
| Quadrant | Total seconds | Saturated seconds | Saturation percentage |
|---|---|---|---|
| A | 6563 | 14 | 0.213317% |
| B | 6564 | 35 | 0.533211% |
| C | 6564 | 79 | 1.203534% |
| D | 6564 | 74 | 1.127361% |
Noise dominated data is calculated using 1-second bins in cleaned event files. If a bin has >2000 counts, and if more than 50% of those come from <1% of pixels, then it is considered to be noise-dominated and hence unusable.
| Quadrant | # 1 sec bins | Bins with >0 counts | Bins with >2000 counts | High rate bins dominated by noise | Noise dominated (total time) | Noise dominated (detector-on time) | Marked lightcurve |
|---|---|---|---|---|---|---|---|
| A | 7413 | 6564 | 0 | 0 | 0.00% | 0.00% | 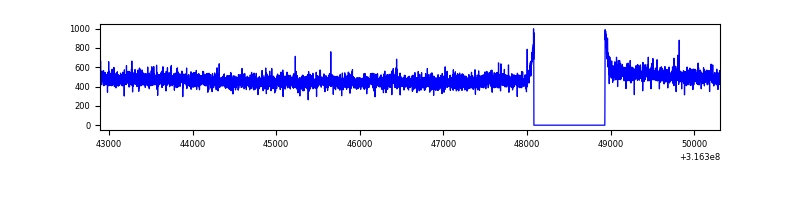 |
| B | 7414 | 6565 | 5 | 5 | 0.07% | 0.08% | 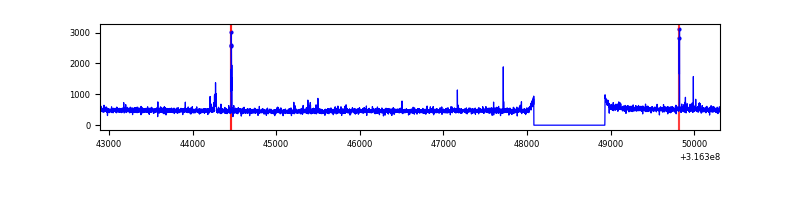 |
| C | 7414 | 6565 | 10 | 10 | 0.13% | 0.15% | 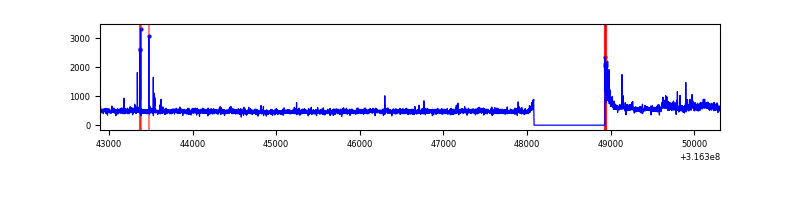 |
| D | 7414 | 6565 | 51 | 51 | 0.69% | 0.78% | 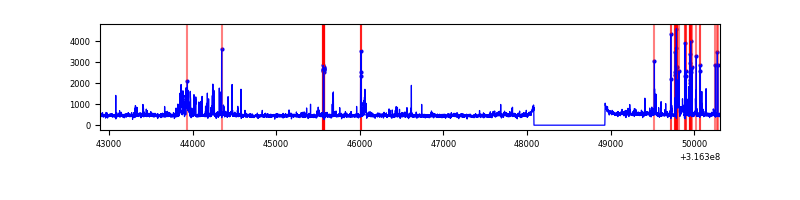 |
Top three noisy pixels from each quadrant. If the there are fewer than three noisy pixels in the level2.evt file, extra rows are filled as -1
| Pixel properties | Quadrant properties | ||||||
|---|---|---|---|---|---|---|---|
| Quadrant | DetID | PixID | Counts | Sigma | Mean | Median | Sigma |
| A | 13 | 254 | 9109 | 50.76 | 802 | 786 | 164.0 |
| A | 3 | 137 | 7004 | 37.92 | 802 | 786 | 164.0 |
| A | 0 | 226 | 6917 | 37.39 | 802 | 786 | 164.0 |
| B | 0 | 190 | 26060 | 164.61 | 798 | 777 | 153.6 |
| B | 12 | 111 | 19027 | 118.82 | 798 | 777 | 153.6 |
| B | 5 | 172 | 18097 | 112.76 | 798 | 777 | 153.6 |
| C | 0 | 10 | 222159 | 1223.25 | 770 | 775 | 181.0 |
| C | 14 | 238 | 122122 | 670.5 | 770 | 775 | 181.0 |
| C | 9 | 15 | 26541 | 142.37 | 770 | 775 | 181.0 |
| D | 7 | 238 | 340951 | 1781.7 | 781 | 759 | 190.9 |
| D | 12 | 233 | 81218 | 421.39 | 781 | 759 | 190.9 |
| D | 1 | 239 | 41052 | 211.03 | 781 | 759 | 190.9 |
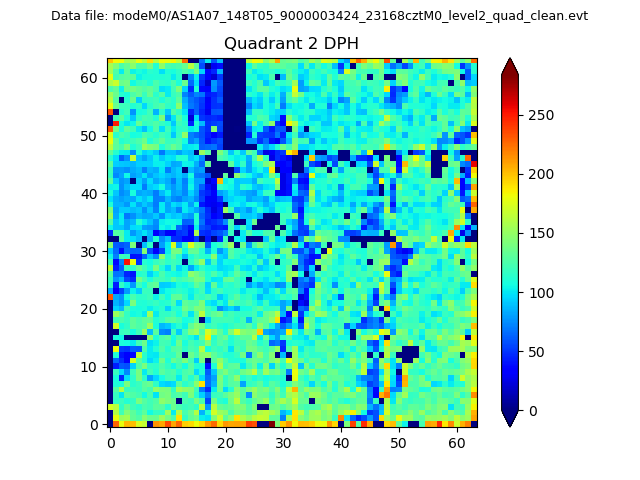
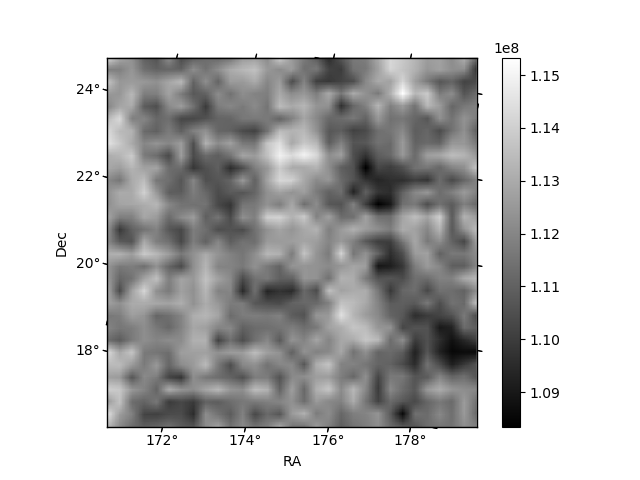
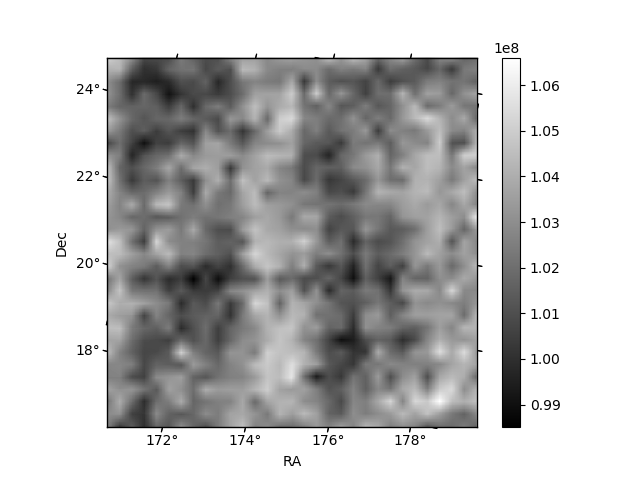
Histogram calculated using DETX and DETY for each event in the final _common_clean file
| Quadrant A | 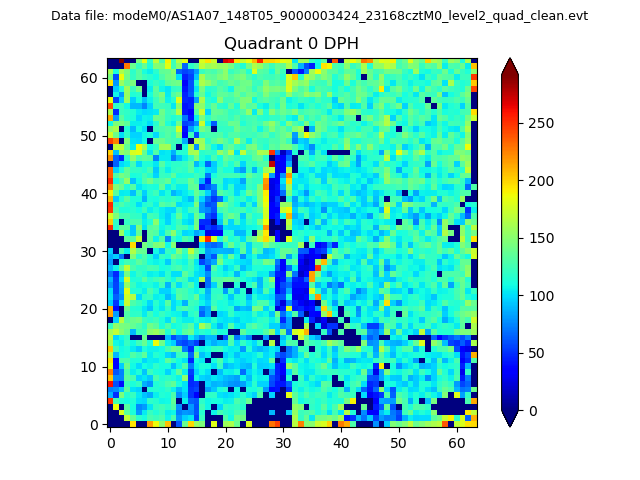 |
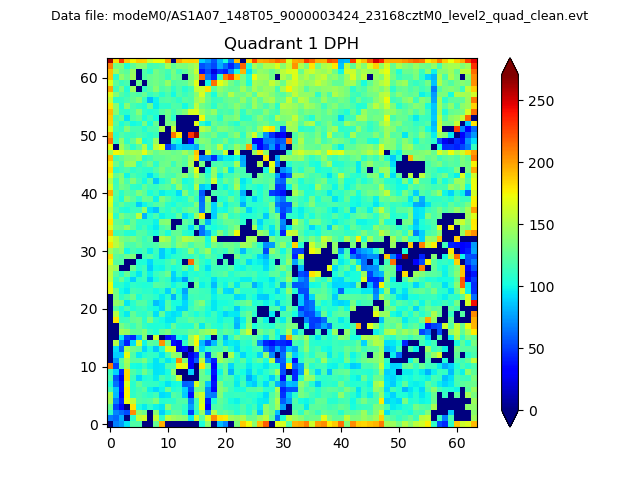 |
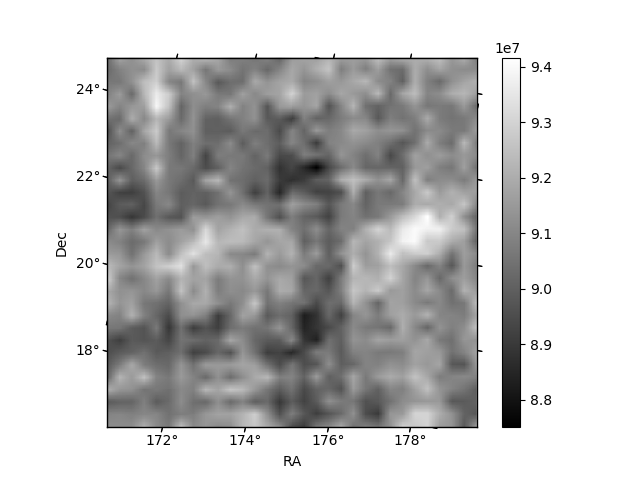
Quadrant B |
|---|---|---|---|
| Quadrant D | 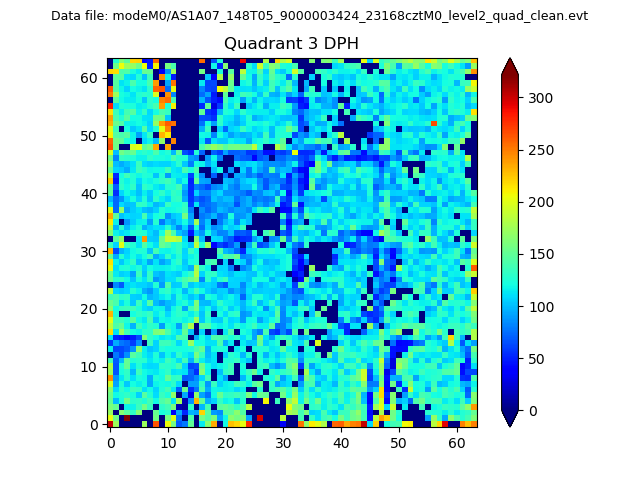 |
 |
Quadrant C |
| Plot type | Count rate plots | Images |
|---|---|---|
| Comparison with Poisson distribution Blue bars denote a histogram of data divided into 1 sec bins. Red curve is a Poisson curve with rate = median count rate of data. |
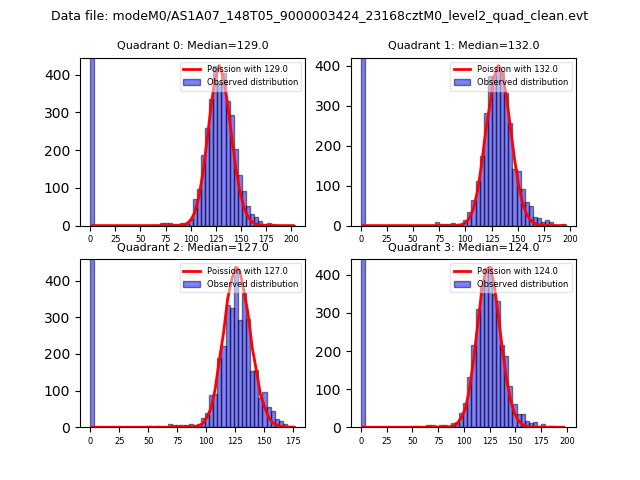 |
 |
| Quadrant-wise count rates Data is divided into 100 sec bins |
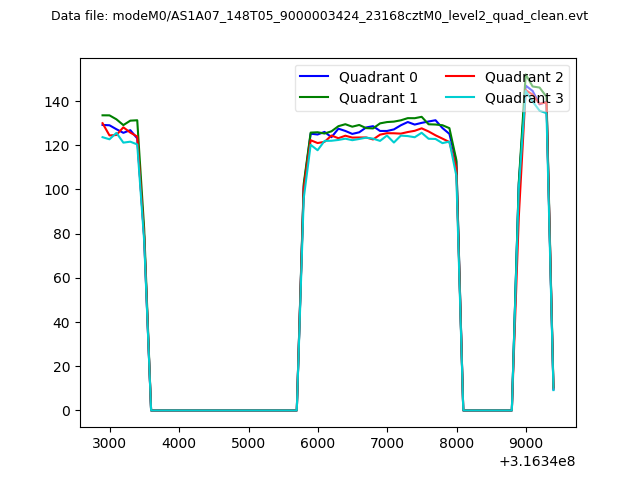 |
|
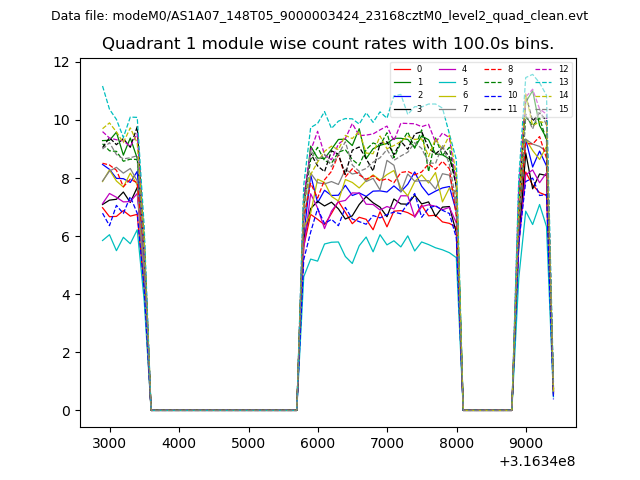
| Module-wise count rates for Quadrant A Data is divided into 100 sec bins |
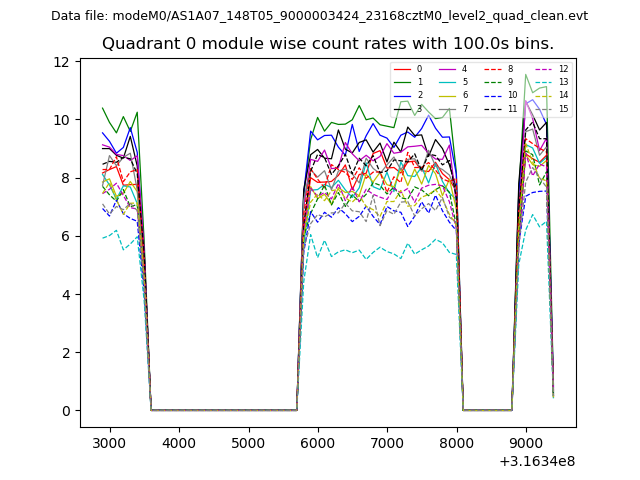 |
 |
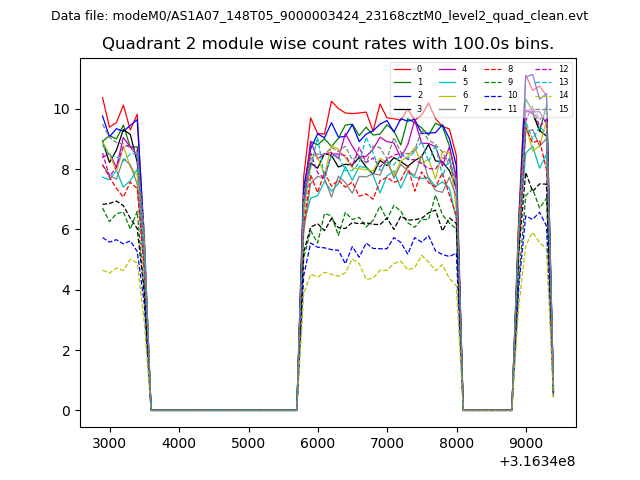
| Module-wise count rates for Quadrant B Data is divided into 100 sec bins |
 |
 |
| Module-wise count rates for Quadrant C Data is divided into 100 sec bins |
 |
 |
| Module-wise count rates for Quadrant D Data is divided into 100 sec bins |
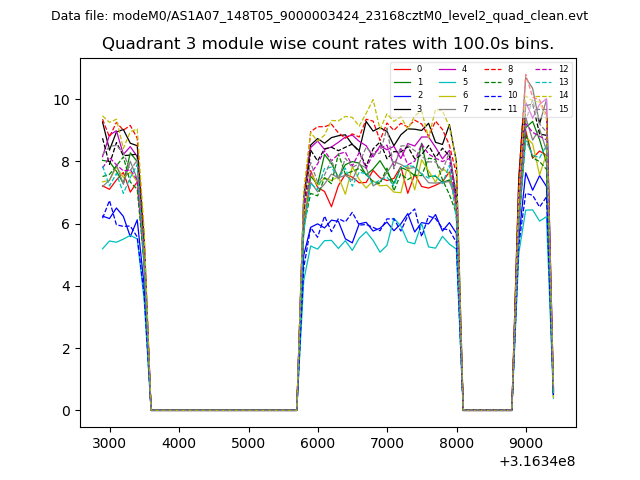 |
 |
| Parameter | Plot |
|---|---|
| CZT HV Monitor | 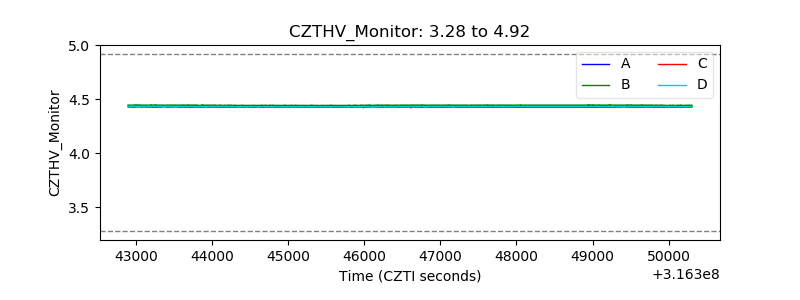 |
| D_VDD | 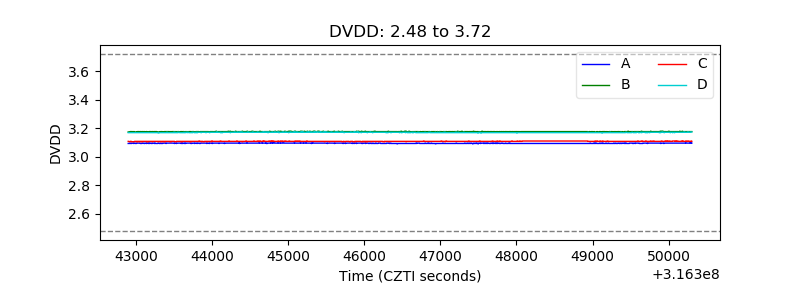 |
| Temperature 1 | 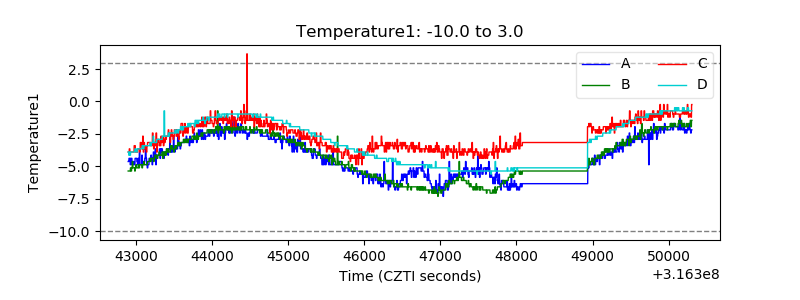 |
| Veto HV Monitor | 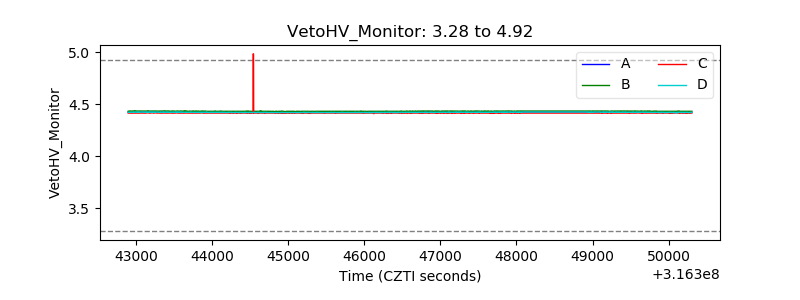 |
| Veto LLD | 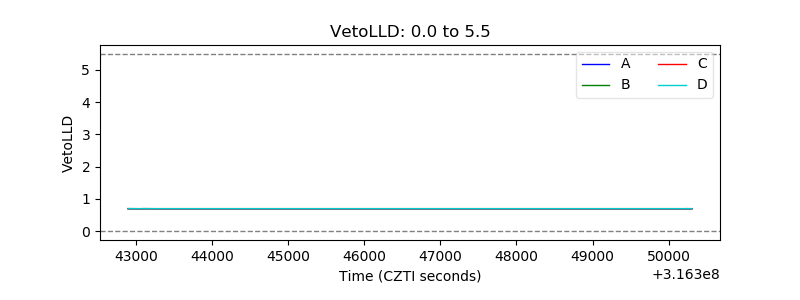 |
| Alpha Counter | 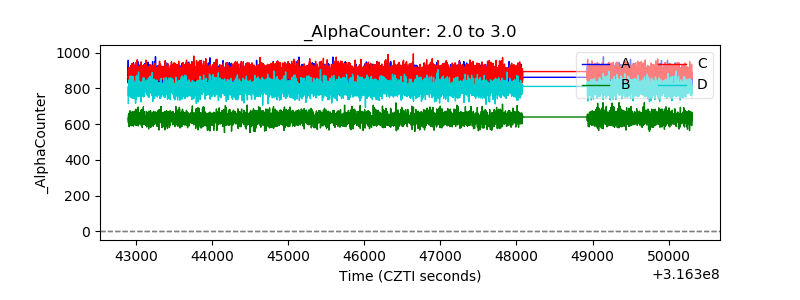 |
| _CPM_Rate | 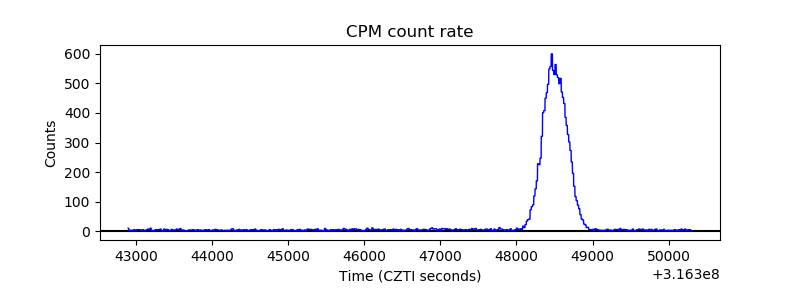 |
| CZT Counter |  |
| +2.5 Volts monitor |  |
| +5 Volts monitor |  |
| _ROLL_ROT | 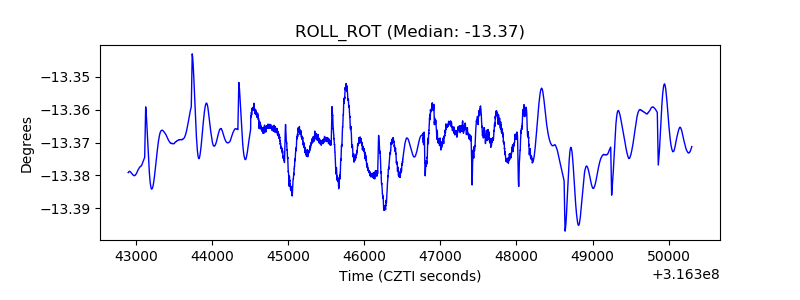 |
| _Roll_DEC | 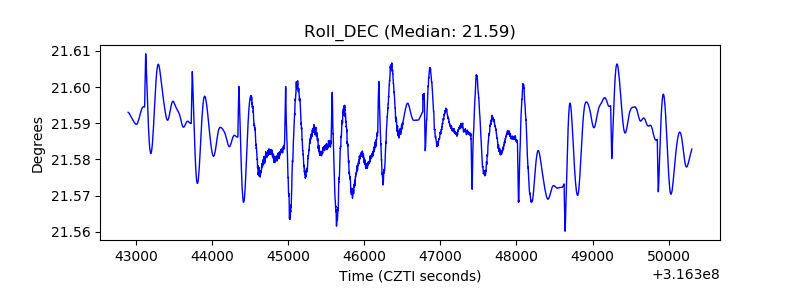 |
| _Roll_RA | 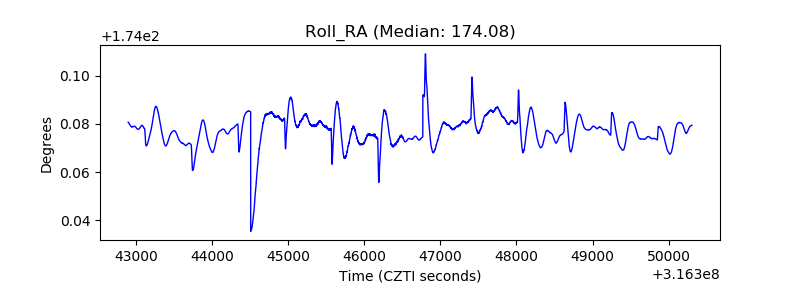 |
| Veto Counter | 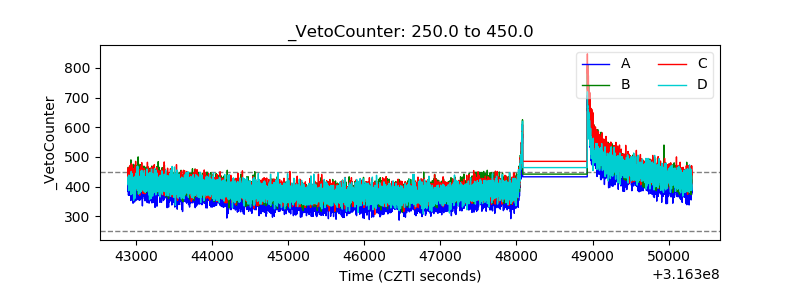 |