| Param | Original file | Final file |
|---|---|---|
| Filename | modeM0/AS1A07_148T05_9000003424_23169cztM0_level2.evt | modeM0/AS1A07_148T05_9000003424_23169cztM0_level2_quad_clean.evt |
| Size (bytes) | 533,856,960 | 65,491,200 |
| Size | 509.1 MB | 62.5 MB |
| Events in quadrant A | 3,329,400 | 386,095 |
| Events in quadrant B | 3,433,636 | 393,136 |
| Events in quadrant C | 3,867,290 | 377,228 |
| Events in quadrant D | 5,077,097 | 353,188 |
| Mode SS | |||
|---|---|---|---|
| Quadrant | BADHDUFLAG | Total packets | Discarded packets |
| A | 0 | 138 | 0 |
| B | 0 | 138 | 0 |
| C | 0 | 138 | 0 |
| D | 0 | 138 | 0 |
| Mode M0 | |||
|---|---|---|---|
| Quadrant | BADHDUFLAG | Total packets | Discarded packets |
| A | 0 | 14140 | 1 |
| B | 0 | 14316 | 1 |
| C | 0 | 15985 | 1 |
| D | 0 | 19634 | 1 |
| Mode M9 | |||
|---|---|---|---|
| Quadrant | BADHDUFLAG | Total packets | Discarded packets |
| A | 0 | 10 | 0 |
| B | 0 | 10 | 0 |
| C | 0 | 10 | 0 |
| D | 0 | 10 | 0 |
| Quadrant | Total seconds | Saturated seconds | Saturation percentage |
|---|---|---|---|
| A | 6786 | 62 | 0.913646% |
| B | 6787 | 63 | 0.928245% |
| C | 6787 | 131 | 1.930161% |
| D | 6787 | 519 | 7.646972% |
Noise dominated data is calculated using 1-second bins in cleaned event files. If a bin has >2000 counts, and if more than 50% of those come from <1% of pixels, then it is considered to be noise-dominated and hence unusable.
| Quadrant | # 1 sec bins | Bins with >0 counts | Bins with >2000 counts | High rate bins dominated by noise | Noise dominated (total time) | Noise dominated (detector-on time) | Marked lightcurve |
|---|---|---|---|---|---|---|---|
| A | 7766 | 6786 | 1 | 1 | 0.01% | 0.01% | 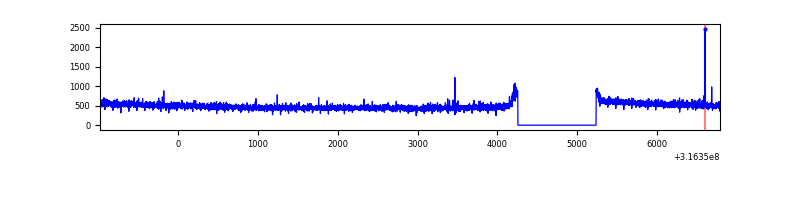 |
| B | 7767 | 6787 | 5 | 5 | 0.06% | 0.07% | 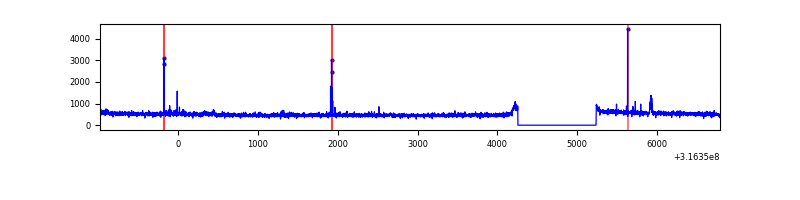 |
| C | 7767 | 6787 | 24 | 24 | 0.31% | 0.35% | 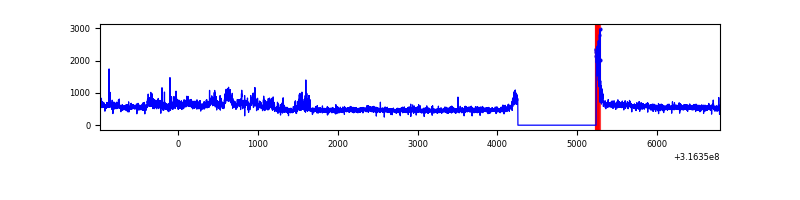 |
| D | 7767 | 6787 | 440 | 440 | 5.66% | 6.48% | 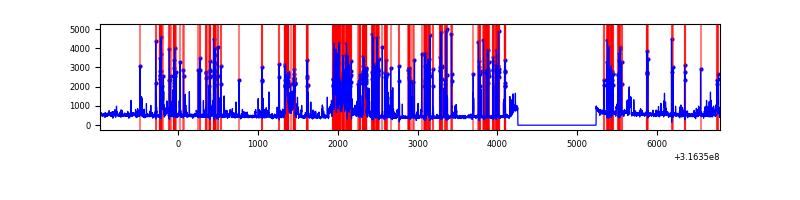 |
Top three noisy pixels from each quadrant. If the there are fewer than three noisy pixels in the level2.evt file, extra rows are filled as -1
| Pixel properties | Quadrant properties | ||||||
|---|---|---|---|---|---|---|---|
| Quadrant | DetID | PixID | Counts | Sigma | Mean | Median | Sigma |
| A | 13 | 254 | 9190 | 47.56 | 862 | 842 | 175.5 |
| A | 0 | 226 | 7620 | 38.61 | 862 | 842 | 175.5 |
| A | 3 | 137 | 7306 | 36.82 | 862 | 842 | 175.5 |
| B | 0 | 190 | 36011 | 212.5 | 856 | 834 | 165.5 |
| B | 12 | 111 | 20086 | 116.3 | 856 | 834 | 165.5 |
| B | 4 | 216 | 19333 | 111.75 | 856 | 834 | 165.5 |
| C | 0 | 10 | 416986 | 2140.77 | 826 | 830 | 194.4 |
| C | 14 | 238 | 129882 | 663.86 | 826 | 830 | 194.4 |
| C | 8 | 208 | 91425 | 466.03 | 826 | 830 | 194.4 |
| D | 7 | 238 | 1123353 | 5554.24 | 821 | 797 | 202.1 |
| D | 1 | 239 | 534499 | 2640.68 | 821 | 797 | 202.1 |
| D | 1 | 52 | 210654 | 1038.34 | 821 | 797 | 202.1 |
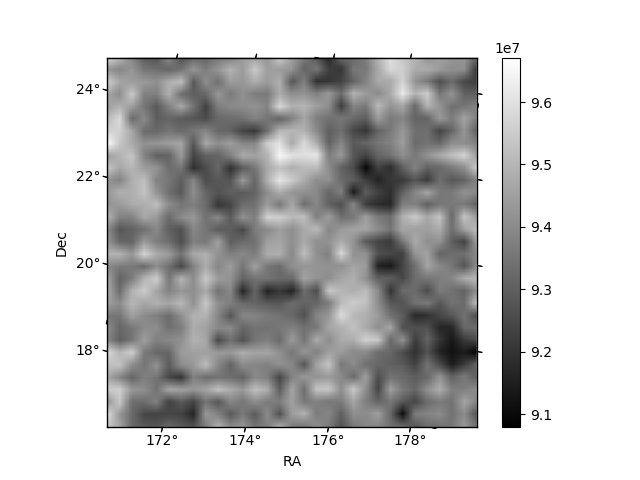
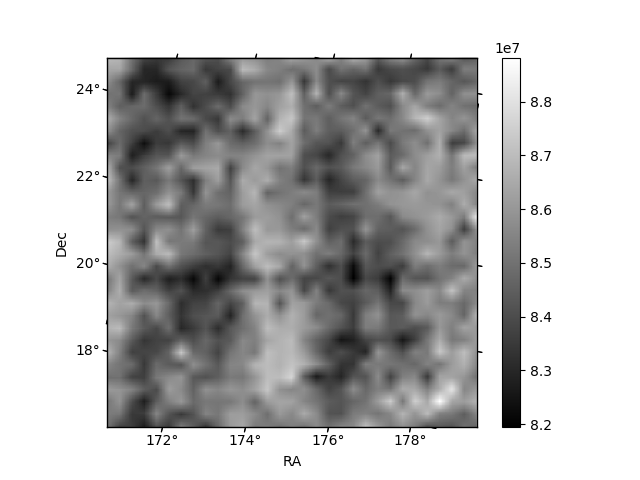
Histogram calculated using DETX and DETY for each event in the final _common_clean file
| Quadrant A |  |
 |
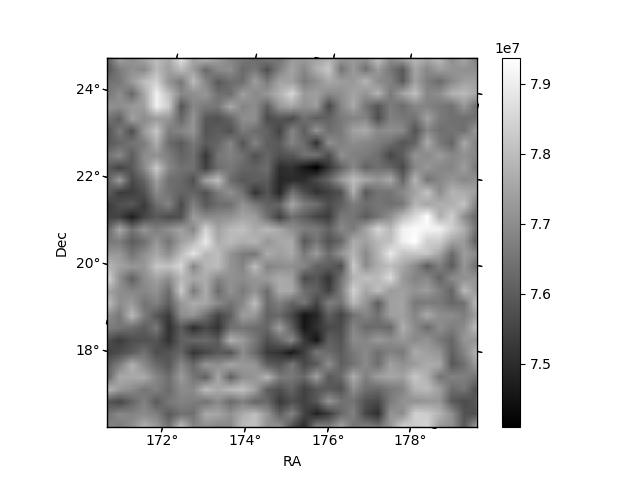
Quadrant B |
|---|---|---|---|
| Quadrant D |  |
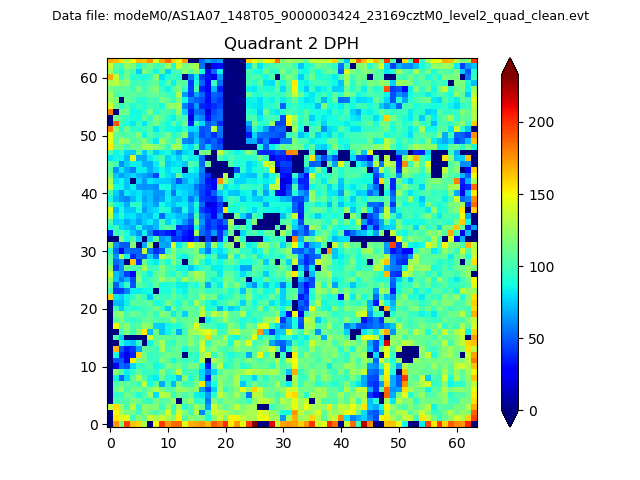 |
Quadrant C |
| Plot type | Count rate plots | Images |
|---|---|---|
| Comparison with Poisson distribution Blue bars denote a histogram of data divided into 1 sec bins. Red curve is a Poisson curve with rate = median count rate of data. |
 |
 |
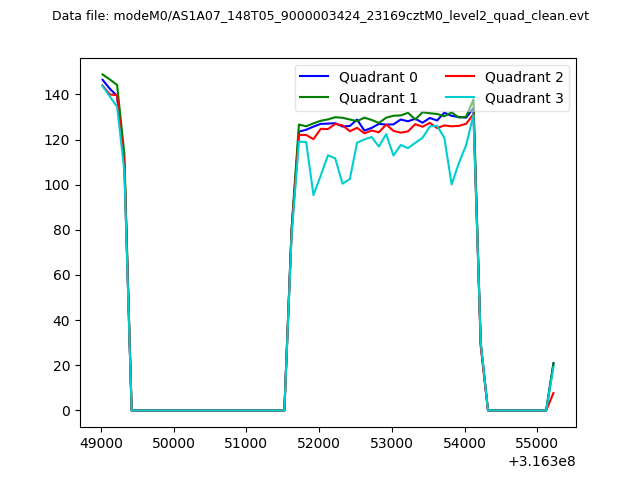
| Quadrant-wise count rates Data is divided into 100 sec bins |
 |
|
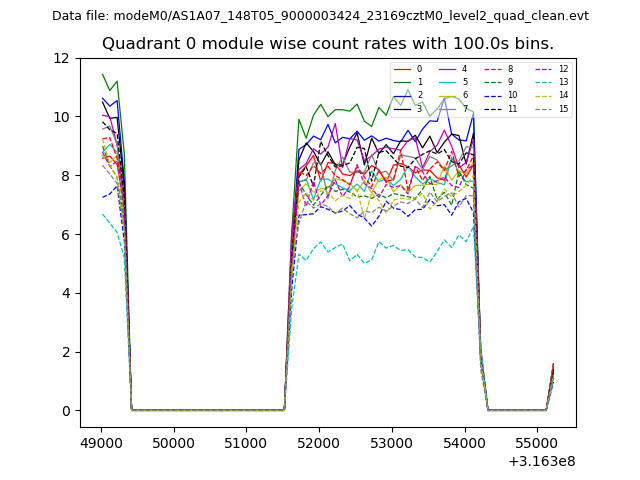
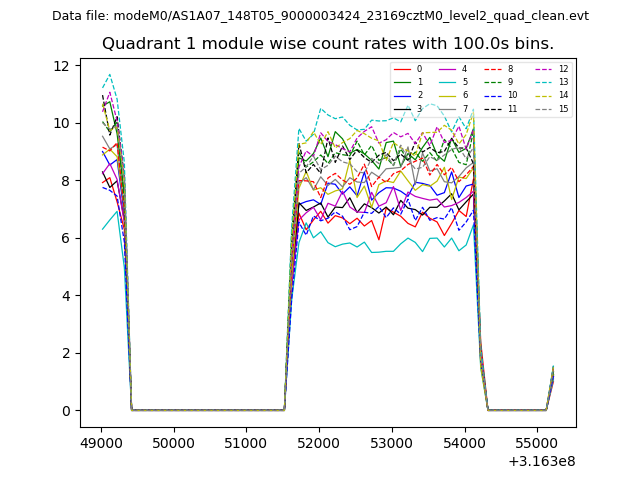
| Module-wise count rates for Quadrant A Data is divided into 100 sec bins |
 |
 |
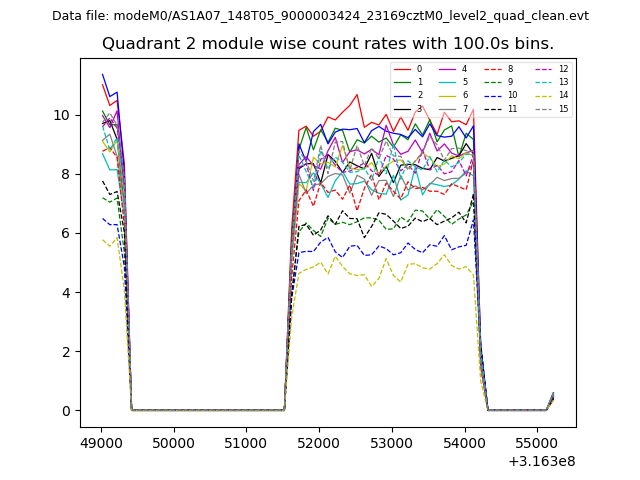
| Module-wise count rates for Quadrant B Data is divided into 100 sec bins |
 |
 |
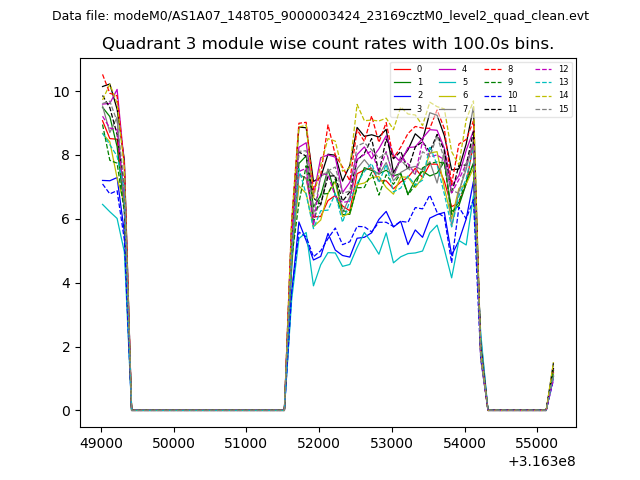
| Module-wise count rates for Quadrant C Data is divided into 100 sec bins |
 |
 |
| Module-wise count rates for Quadrant D Data is divided into 100 sec bins |
 |
 |
| Parameter | Plot |
|---|---|
| CZT HV Monitor | 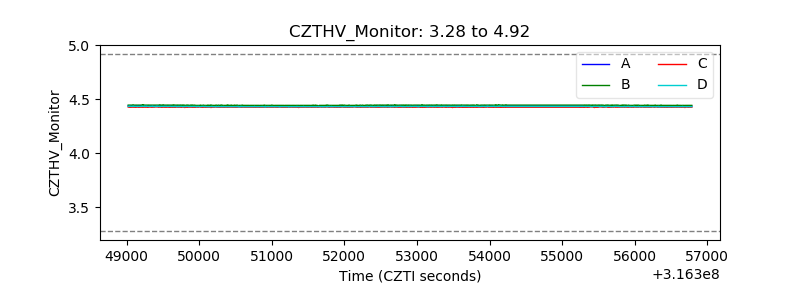 |
| D_VDD | 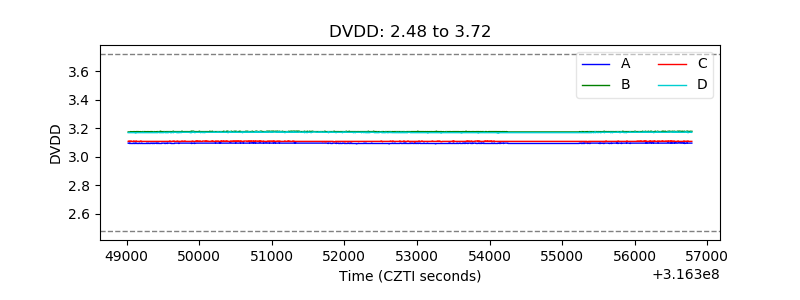 |
| Temperature 1 | 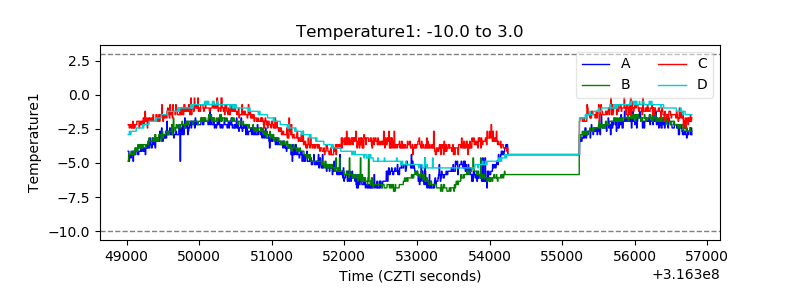 |
| Veto HV Monitor | 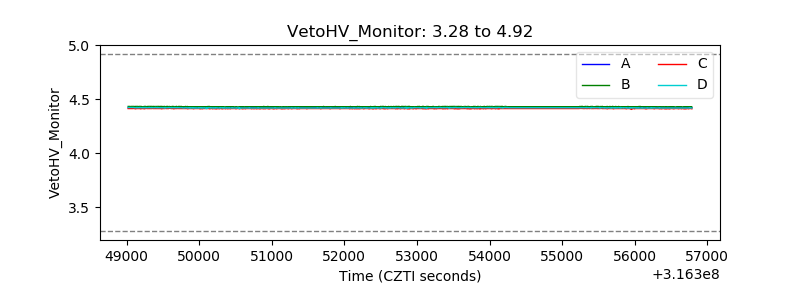 |
| Veto LLD |  |
| Alpha Counter | 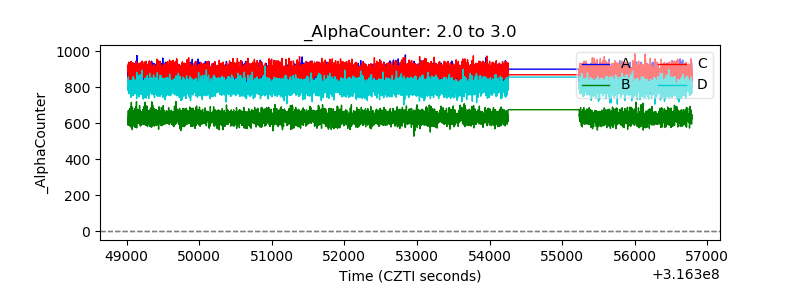 |
| _CPM_Rate | 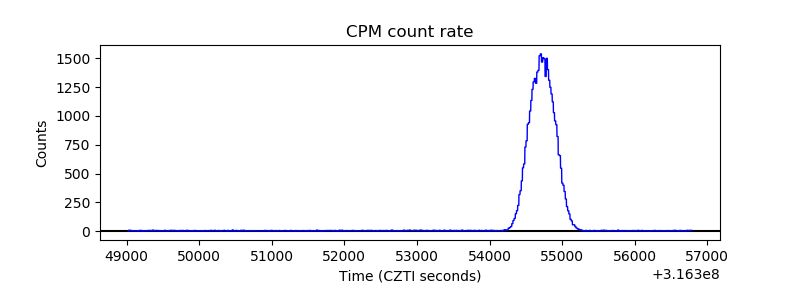 |
| CZT Counter | 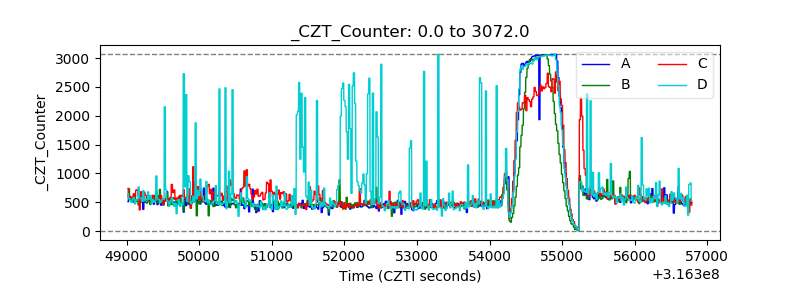 |
| +2.5 Volts monitor |  |
| +5 Volts monitor | 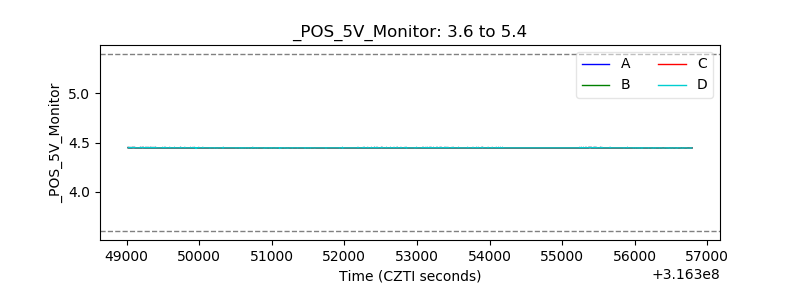 |
| _ROLL_ROT | 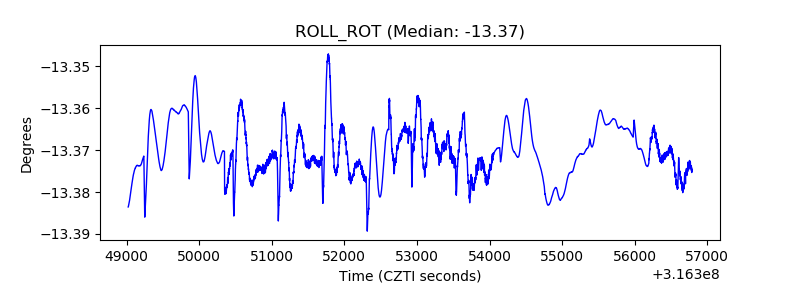 |
| _Roll_DEC | 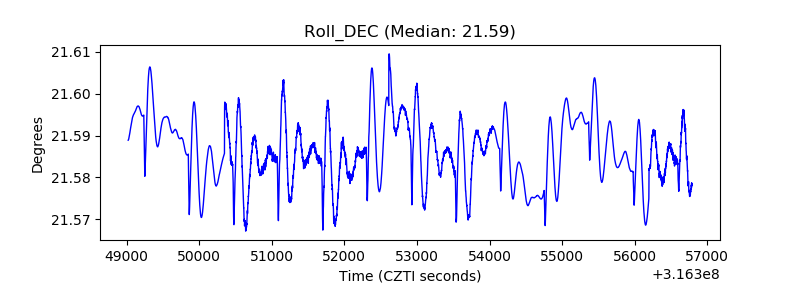 |
| _Roll_RA |  |
| Veto Counter | 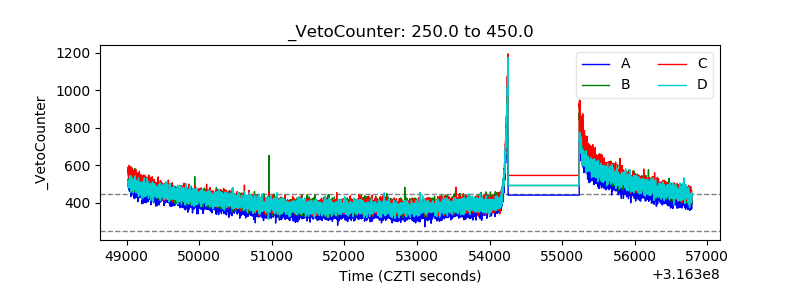 |