| Param | Original file | Final file |
|---|---|---|
| Filename | modeM0/AS1A07_148T05_9000003424_23171cztM0_level2.evt | modeM0/AS1A07_148T05_9000003424_23171cztM0_level2_quad_clean.evt |
| Size (bytes) | 668,661,120 | 63,383,040 |
| Size | 637.7 MB | 60.4 MB |
| Events in quadrant A | 3,397,838 | 378,981 |
| Events in quadrant B | 3,686,119 | 383,983 |
| Events in quadrant C | 4,314,062 | 368,960 |
| Events in quadrant D | 8,404,670 | 324,726 |
| Mode SS | |||
|---|---|---|---|
| Quadrant | BADHDUFLAG | Total packets | Discarded packets |
| A | 0 | 134 | 0 |
| B | 0 | 134 | 0 |
| C | 0 | 134 | 0 |
| D | 0 | 134 | 0 |
| Mode M0 | |||
|---|---|---|---|
| Quadrant | BADHDUFLAG | Total packets | Discarded packets |
| A | 0 | 14435 | 2 |
| B | 0 | 15244 | 2 |
| C | 0 | 17137 | 2 |
| D | 0 | 29519 | 2 |
| Mode M9 | |||
|---|---|---|---|
| Quadrant | BADHDUFLAG | Total packets | Discarded packets |
| A | 0 | 13 | 0 |
| B | 0 | 14 | 0 |
| C | 0 | 14 | 0 |
| D | 0 | 14 | 0 |
| Quadrant | Total seconds | Saturated seconds | Saturation percentage |
|---|---|---|---|
| A | 6628 | 41 | 0.618588% |
| B | 6628 | 75 | 1.131563% |
| C | 6628 | 305 | 4.601690% |
| D | 6628 | 1321 | 19.930597% |
Noise dominated data is calculated using 1-second bins in cleaned event files. If a bin has >2000 counts, and if more than 50% of those come from <1% of pixels, then it is considered to be noise-dominated and hence unusable.
| Quadrant | # 1 sec bins | Bins with >0 counts | Bins with >2000 counts | High rate bins dominated by noise | Noise dominated (total time) | Noise dominated (detector-on time) | Marked lightcurve |
|---|---|---|---|---|---|---|---|
| A | 7768 | 6629 | 1 | 1 | 0.01% | 0.02% | 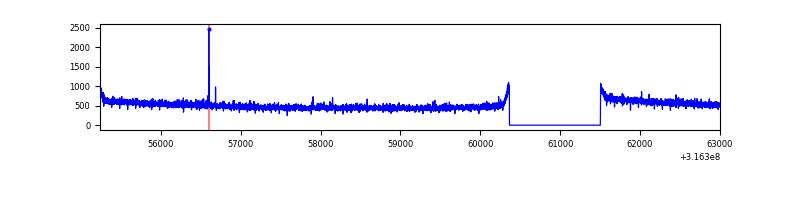 |
| B | 7768 | 6629 | 2 | 2 | 0.03% | 0.03% | 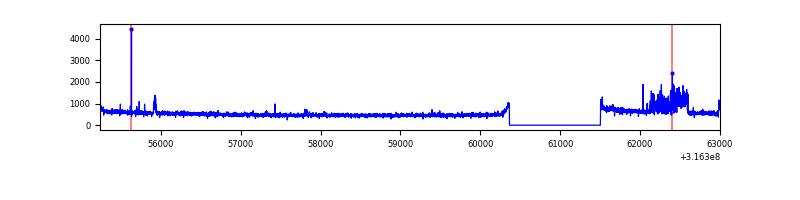 |
| C | 7768 | 6629 | 79 | 79 | 1.02% | 1.19% | 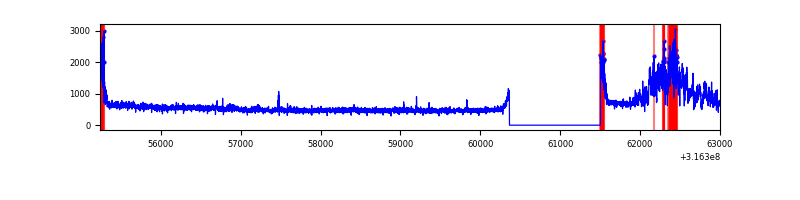 |
| D | 7768 | 6629 | 1315 | 1315 | 16.93% | 19.84% | 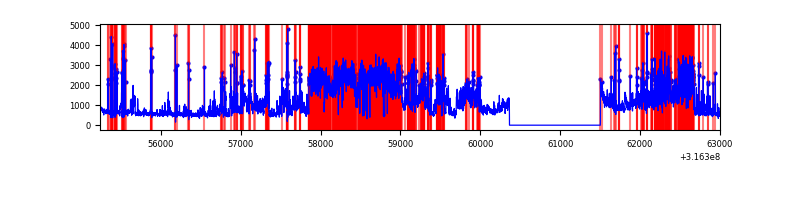 |
Top three noisy pixels from each quadrant. If the there are fewer than three noisy pixels in the level2.evt file, extra rows are filled as -1
| Pixel properties | Quadrant properties | ||||||
|---|---|---|---|---|---|---|---|
| Quadrant | DetID | PixID | Counts | Sigma | Mean | Median | Sigma |
| A | 13 | 254 | 9893 | 50.68 | 880 | 861 | 178.2 |
| A | 0 | 226 | 7743 | 38.62 | 880 | 861 | 178.2 |
| A | 6 | 16 | 7574 | 37.67 | 880 | 861 | 178.2 |
| B | 0 | 190 | 243738 | 1478.77 | 873 | 852 | 164.2 |
| B | 12 | 111 | 19510 | 113.6 | 873 | 852 | 164.2 |
| B | 11 | 111 | 17206 | 99.57 | 873 | 852 | 164.2 |
| C | 8 | 208 | 647358 | 3300.66 | 841 | 846 | 195.9 |
| C | 0 | 10 | 242742 | 1234.96 | 841 | 846 | 195.9 |
| C | 14 | 238 | 133335 | 676.4 | 841 | 846 | 195.9 |
| D | 7 | 238 | 4743416 | 23637.08 | 823 | 800 | 200.6 |
| D | 12 | 233 | 216035 | 1072.73 | 823 | 800 | 200.6 |
| D | 1 | 52 | 176563 | 876.0 | 823 | 800 | 200.6 |
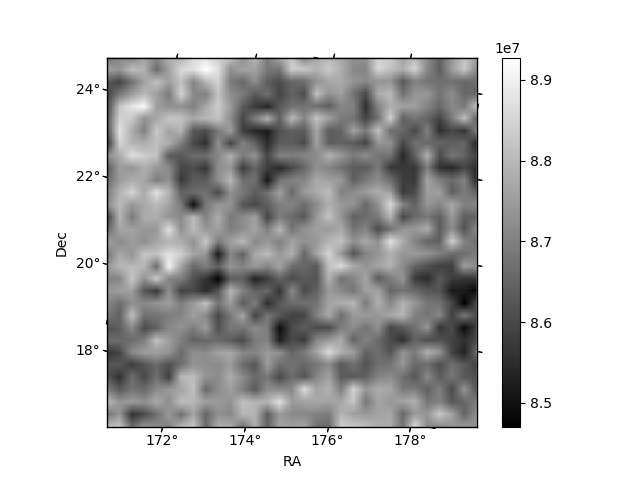
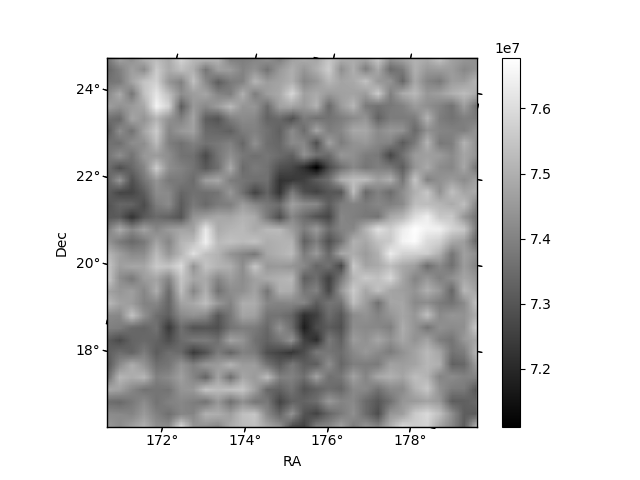
Histogram calculated using DETX and DETY for each event in the final _common_clean file
| Quadrant A | 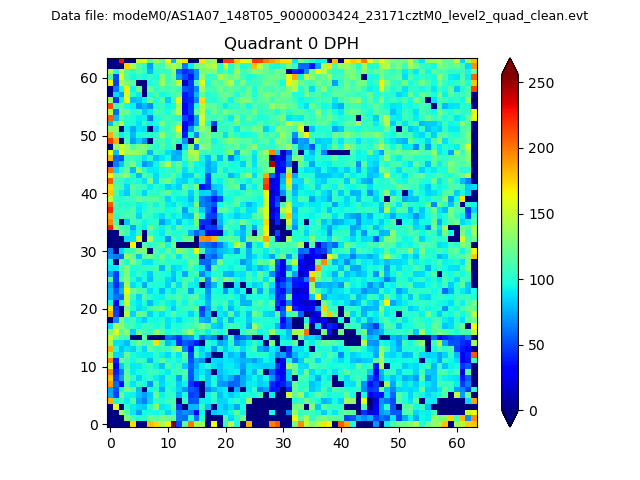 |
 |
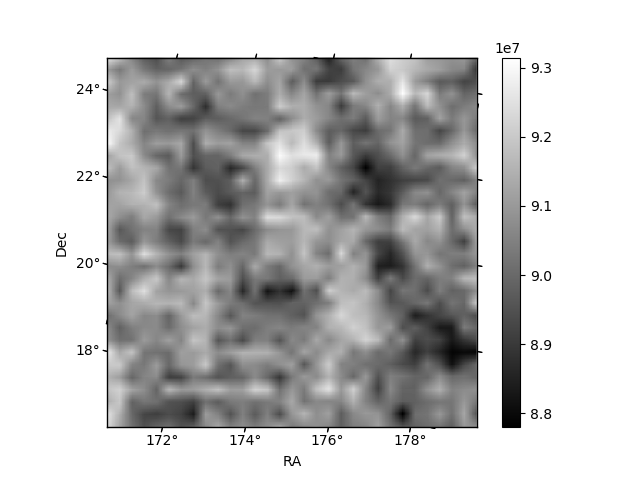
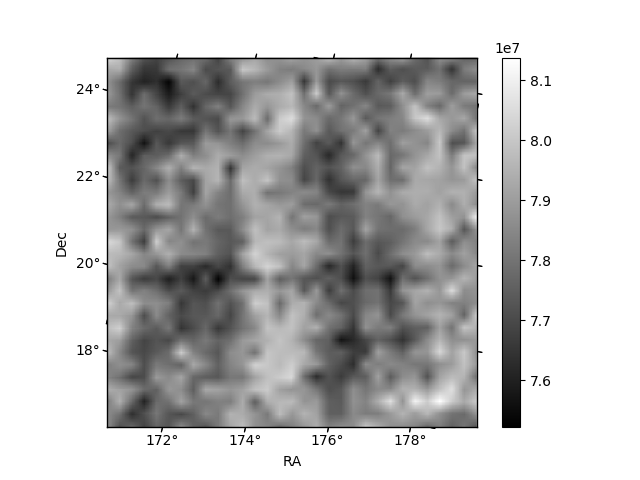
Quadrant B |
|---|---|---|---|
| Quadrant D |  |
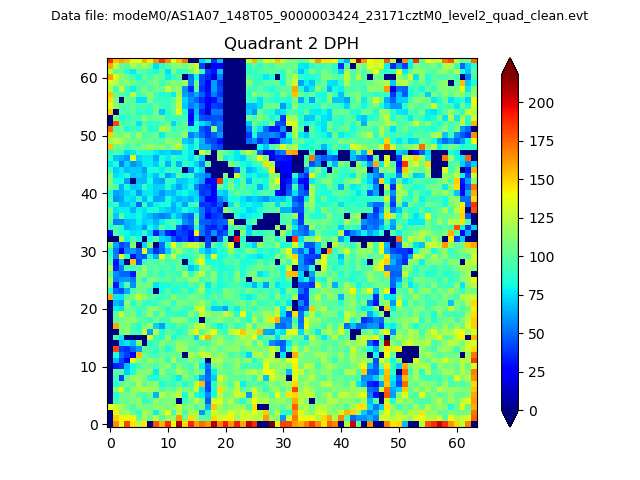 |
Quadrant C |
| Plot type | Count rate plots | Images |
|---|---|---|
| Comparison with Poisson distribution Blue bars denote a histogram of data divided into 1 sec bins. Red curve is a Poisson curve with rate = median count rate of data. |
 |
 |
| Quadrant-wise count rates Data is divided into 100 sec bins |
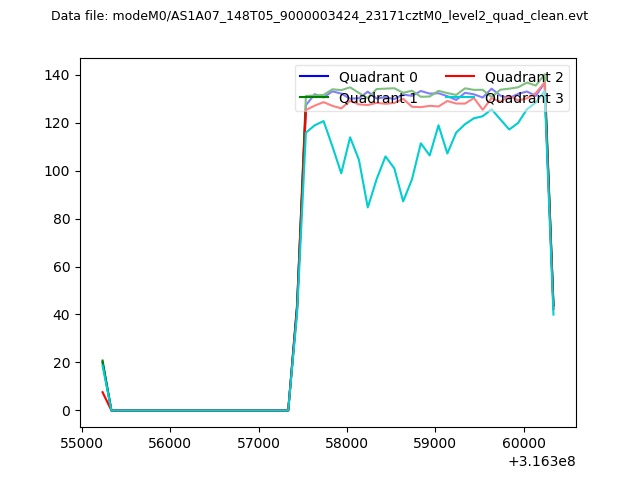 |
|
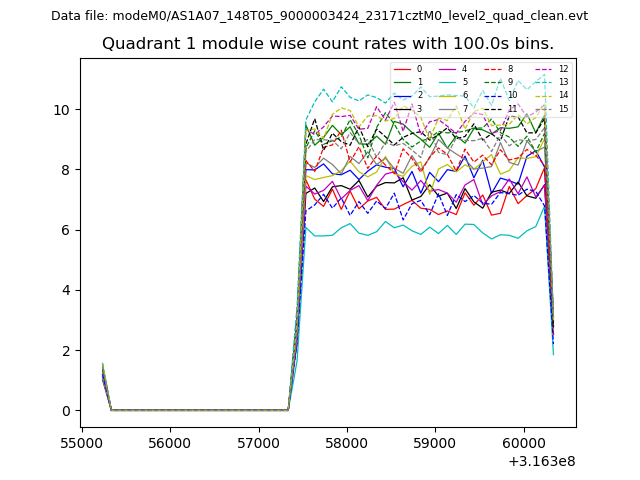
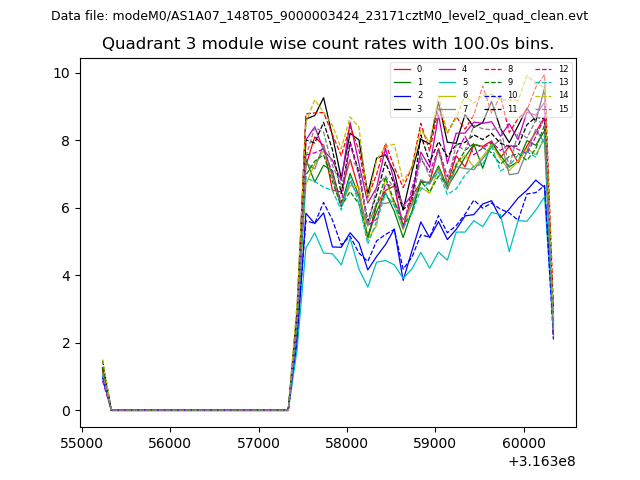
| Module-wise count rates for Quadrant A Data is divided into 100 sec bins |
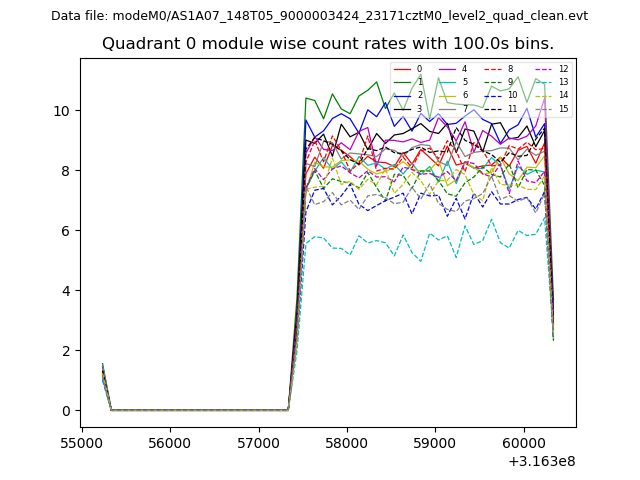 |
 |
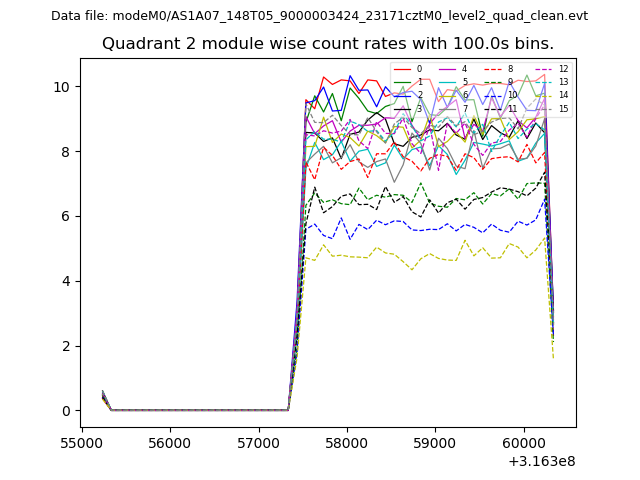
| Module-wise count rates for Quadrant B Data is divided into 100 sec bins |
 |
 |
| Module-wise count rates for Quadrant C Data is divided into 100 sec bins |
 |
 |
| Module-wise count rates for Quadrant D Data is divided into 100 sec bins |
 |
 |
| Parameter | Plot |
|---|---|
| CZT HV Monitor | 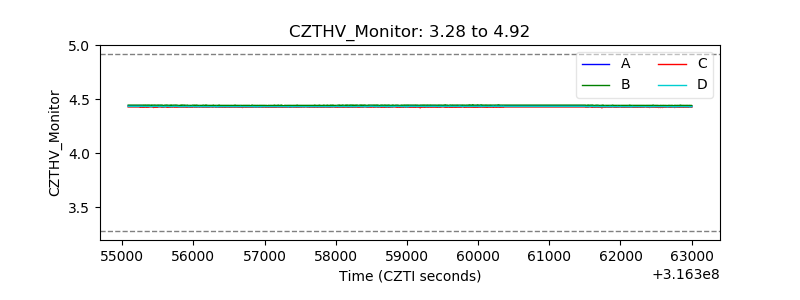 |
| D_VDD | 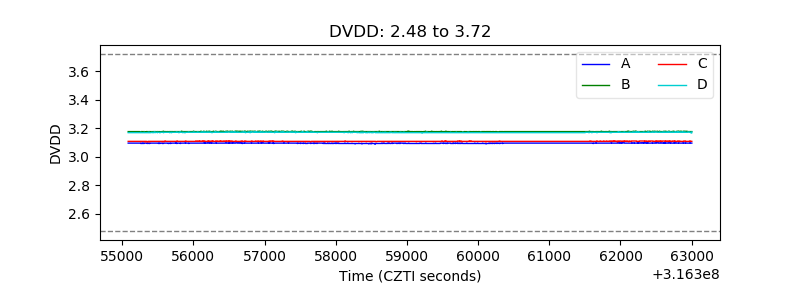 |
| Temperature 1 | 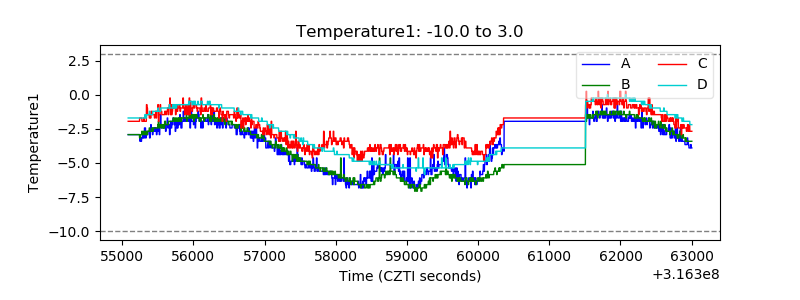 |
| Veto HV Monitor |  |
| Veto LLD |  |
| Alpha Counter | 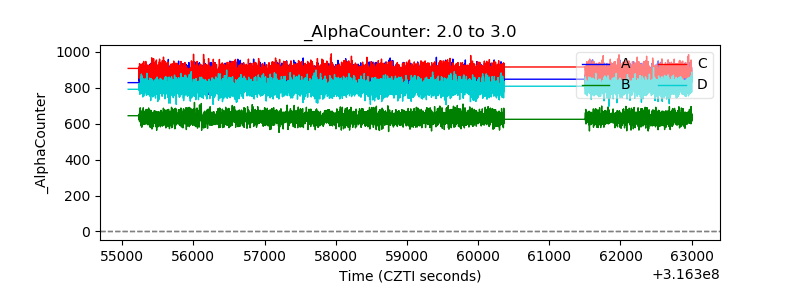 |
| _CPM_Rate | 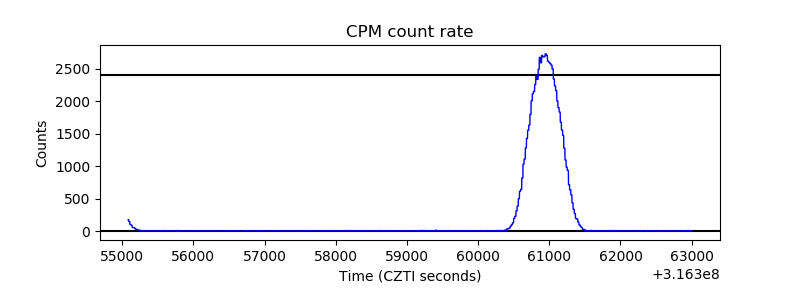 |
| CZT Counter |  |
| +2.5 Volts monitor |  |
| +5 Volts monitor | 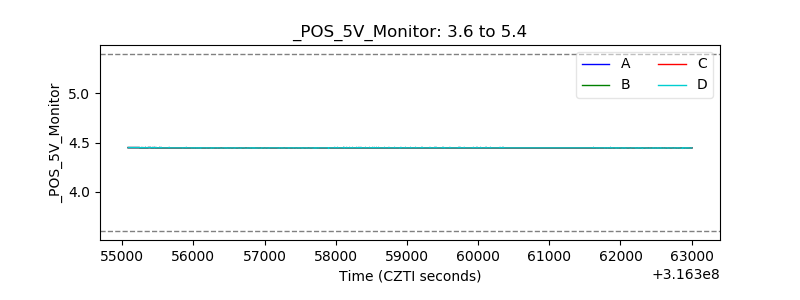 |
| _ROLL_ROT | 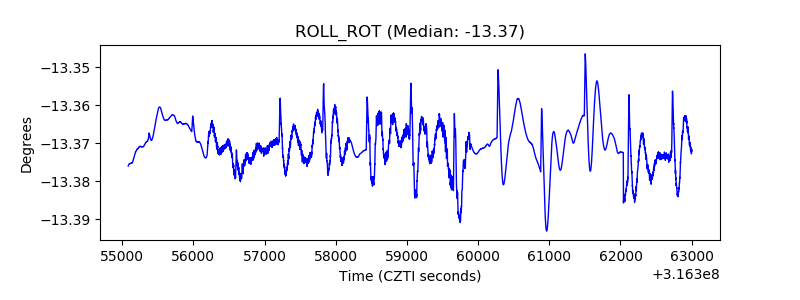 |
| _Roll_DEC | 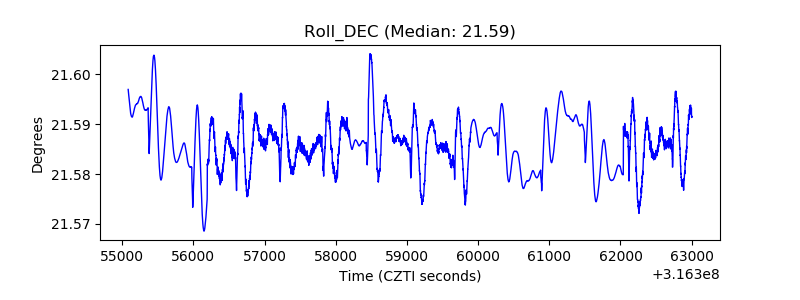 |
| _Roll_RA |  |
| Veto Counter | 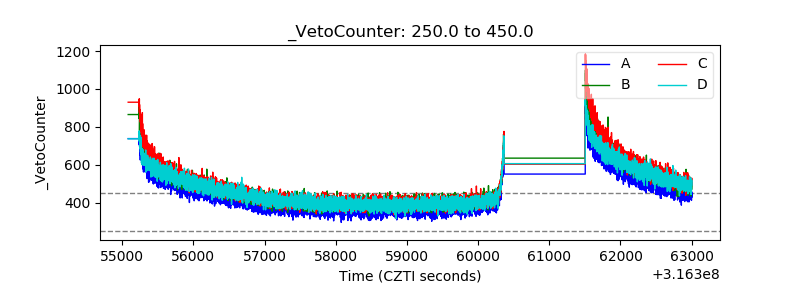 |